Introduction
To understand orthodontic tooth movement, a method of quantification of tooth position discrepancies in 3 dimensions is needed. Brackets and wires now can be fabricated by CAD/CAM technology on a setup made at the beginning of treatment, so that treatment should produce a reasonably precise duplicate of the setup. The extent of discrepancies between the planned and actual tooth movements can be quantified by registration of the setup and final models. The goal of this study was to evaluate the accuracy of a CAD/CAM lingual orthodontic technique.
Methods
Dental casts of 94 consecutive patients from 1 practice, representing a broad range of orthodontic problems, were scanned to create digital models, and then the setup and final models for each patient were registered individually for the maxillary and mandibular dental arches. Individual tooth discrepancies between the setup and actual outcome were computed and expressed in terms of a six-degrees-of-freedom rectangular coordinate system.
Results
Discrepancies in position and rotation between the setup and outcome were small for all teeth (generally less than 1 mm and 4°) except for the second molars, where some larger discrepancies were observed. Faciolingual expansion in the posterior teeth was greater in the setup than in the final models, especially at the second molars. Linear mixed models showed that age, type of tooth, jaw, initial crowding, time in slot-filling wire, use of elastics, days in treatment, interproximal reduction, and rebonding, were all influences on the final differences, but, for most of these factors, the influence was small, explaining only a small amount of the discrepancy between the planned and the actual outcomes.
Conclusion
These fully customized lingual orthodontic appliances were accurate in achieving the goals planned at the initial setup, except for the full amount of planned expansion and the inclination at the second molars. This methodology is the first step toward understanding and measuring tooth movement in 3 dimensions.
To assess changes in orthodontic treatment, sequential records obtained at different time points are compared. Historically, most quantitative comparisons in orthodontics have been made on cephalograms, which generate a 2-dimensional projection of 3-dimensional (3D) structures. Because of the overlapping of the left and right sides of the dental arches, it is particularly difficult to obtain a precise assessment of tooth movement. During the last 10 years, numerous 3D record modalities have been introduced. These include digital orthodontic models, cone-beam computed tomography (CBCT), and 3D photography. The new modalities allow for assessment of changes in 3 dimensions and customization of treatment planning, brackets, and wires by means of CAD/CAM technology.
Among the many advantages of digital models over conventional dental casts is the possibility of spatial registration. Digital models from different time points can be combined in the same coordinate system.
Previous studies measuring 3D tooth movement or tooth positional discrepancy can be classified into 3 categories based on their reported outcome. Group I includes all studies reporting tooth movement as the 3D translation of a chosen landmark in an x, y, and z system. In a study of this type, Ashmore et al registered bimonthly serial models on palatal rugae landmarks and described the translational movements of the molars subjected to a headgear force. To compute the molar translational parameters, these authors digitized 4 landmarks on each molar at each time point and constructed a centroid. They reported good reliability for the translational movements and lower reliability for the rotational parameters.
Group II comprises studies reporting both translation and rotation parameters based on the calculation of a transformation matrix in an x, y, and z system. This transformation matrix (mathematical expression of rotation and translation) is computed through an iterative closest-point registration between homologous teeth at different time points. Chen et al applied this method to measure simulated tooth movement on CBCT images. This methodology can also be used to compare planned tooth positions with the achieved positions.
Group III studies describe rotational parameters and translation relative to a finite helical axis system. Hayashi et al compared the finite helical axis system with the x, y, and z system, and found no statistically significant differences in absolute tooth movement measurements but noted differences in the description of the rotational parameters.
To understand orthodontic tooth movement, a method of quantification of tooth position discrepancies in 3 dimensions is needed. Although the registration of sequential orthodontic digital models is still controversial, setup models of the planned correction can be registered to the final obtained correction after orthodontic treatment. Current technology allows for the establishment of precise treatment goals and mechanics before treatment. Treatment goals are established in virtual space, and custom appliances are manufactured to produce the desired tooth movement. The use of goal-driven orthodontic techniques has not been validated, and it is not known how close the final treatment results are to the planned corrections.
Based on the above considerations, a new method for registration and superimposition of setup and final models, and assessment of tooth positional discrepancies was developed and validated. It consists of a 2-step registration of digital models: first, dental arches from different time points are registered in the same coordinate system; second, homologous teeth in different positions are registered to compute the transformation matrix between time points. This method allows for computation and description of differences between planned tooth positions used for appliances fabrication and achieved tooth positions. The obtained differences in position and orientation between teeth at 2 time points can be applied in the refinement of appliance fabrication.
The aim of this study was to assess the accuracy in translational and rotational tooth positioning of a CAD/CAM lingual orthodontic technique.
Material and methods
A sample was collected at an orthodontic office in Bad Essen, Germany, dedicated almost exclusively to lingual orthodontics with the Incognito appliance (3M-Unitek, Monrovia, Calif). Inclusion criteria were patients treated with the Incognito lingual technique in both dental arches and debonded between January 2008 and January 2009. The initial sample was composed of 118 patients. Exclusion criteria were surgical or skeletal anchorage treatment, unavailability of diagnostic records, and lack of compliance (defined as no appointment in 3 consecutive months). After application of the exclusion criteria, the final sample included 94 consecutive patients, whose demographic and malocclusion characteristics are shown in Tables I and II .
| Variable | Mean | SD | Minimum | Maximum |
|---|---|---|---|---|
| ANB (°) | 3.49 | 2.37 | −1.60 | 9.10 |
| Overjet (mm) | 4.80 | 2.40 | −4.70 | 11.50 |
| Overbite (mm) | 3.58 | 2.23 | −6.70 | 7.60 |
| Age (y) | 27.7 | 12.5 | 15.5 | 61.6 |
| Treatment time (d) | 601.4 | 213.3 | 145.0 | 1159.0 |
| Rebondings (n) | 1.78 | 2.10 | 0.00 | 9.00 |
| Crowding, maxillary arch (mm) | −2.48 | 4.07 | −9.74 | 12.51 |
| Crowding, mandibular arch (mm) | −2.76 | 3.30 | −8.85 | 7.90 |
| Variable | Frequency (n) | Percentage |
|---|---|---|
| Sex | ||
| Female | 63 | 67.02 |
| Male | 31 | 32.98 |
| Interproximal reduction | ||
| 0 | 74 | 78.72 |
| 1 | 20 | 21.28 |
| Class II | ||
| 0 (no Class II elastics) | 38 | 40.43 |
| 1 (1-120 days) | 10 | 10.64 |
| 2 (>121 days) | 46 | 48.94 |
| Vertical elastics | ||
| 0 | 76 | 80.85 |
| 1 | 18 | 19.15 |
| Days in maxillary slot-filling wire | ||
| No slot-filling wire | 28 | 29.79 |
| 1-180 days | 28 | 29.79 |
| >181 days | 38 | 40.43 |
| Days in mandibular slot-filling wire | ||
| No slot-filling wire | 33 | 35.11 |
| 1-180 days | 30 | 31.91 |
| >181 days | 31 | 32.98 |
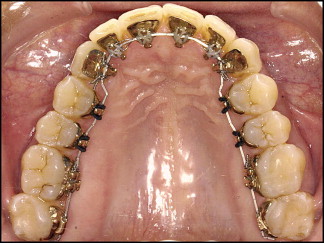
In the Incognito technique, brackets and wires are CAD/CAM customized on a model of the patient’s setup at the beginning of treatment. Laboratory technicians fabricate a setup model according to the orthodontist’s prescription. These models are used as a template to design virtual brackets and wires. Virtual brackets are printed in wax and cast in a gold alloy. Archwires are formed by a wire-bending robot. Dental casts, brackets, and wires are delivered to the orthodontist ( Fig 1 ).
For each patient in the final sample, the following records were collected: pretreatment dental casts (initial), pretreatment setup (setup), posttreatment dental casts (final), pretreatment and posttreatment cephalograms and panoramic radiographs, and pretreatment and posttreatment photos. The following information was also collected: sex, age, ethnicity, days in treatment, archwire sequence, use of intermaxillary elastics, and extractions and/or interproximal reductions.
Dental casts were scanned with an ATOS optical scanner (GOM, Braunschweig, Germany) at a spatial resolution of 20 μm. For each patient and time point, 3 scans or surfaces were created: 1 surface of the maxillary arch, 1 surface of the mandibular arch, and 1 surface (facial aspect) of the models in occlusion.
The maxillary and mandibular arch surfaces were registered to the corresponding portions of the surface of the models in occlusion by using Occlusomatch software (TopService, 3M, Bad Essen, Germany). An automatic registration process selected 2500 points on each surface (search radius of 1 mm reduced to 0.25 mm, factor of 0.50 mm), and iterations were performed until the success threshold was reached at 0.06 mm. Once the occlusal positions of both arches were established, the surface of the models in occlusion was deleted. The variability introduced by this 2-step process was quite small, and its validation is reported elsewhere. This process was used for the initial, setup, and final models, generating 3 pairs of digital models.
Digital models corresponding to the setup and final time points were loaded into Geomagic Studio software (Geomagic U.S., Research Triangle Park, NC), and the surfaces corresponding to the gingival tissue were removed to prevent any influence of the soft-tissue changes on the registration. The remaining surfaces corresponding to the dental arches were simplified to 50,000 points by using the Qslim tool (version 2.0; Dr. Michael Garland, http://mgarland.org/home.html ). Once simplified, the maxillary setup model was registered to the maxillary final model by using emodel software (version 8.05; Geodigm, Chanhassen, Minn) to combine both models in the same coordinate system. The same process was used for the mandibular setup model.
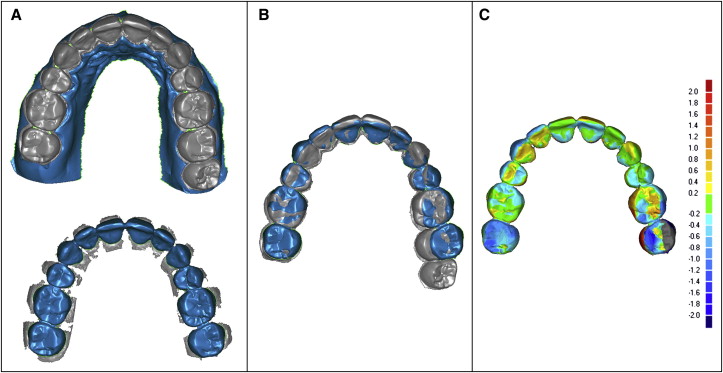
The surface-to-surface registration of the setup dental arch to the final arch was independently performed for both arches. Fifteen hundred points were selected on each surface with a search radius of 0.5 mm, and 30 iterations were automatically performed until the best fit of the surfaces was obtained ( Fig 2 ). As with registration of the models in occlusion, only small and not statistically significant amounts of variability were introduced by this registration process.
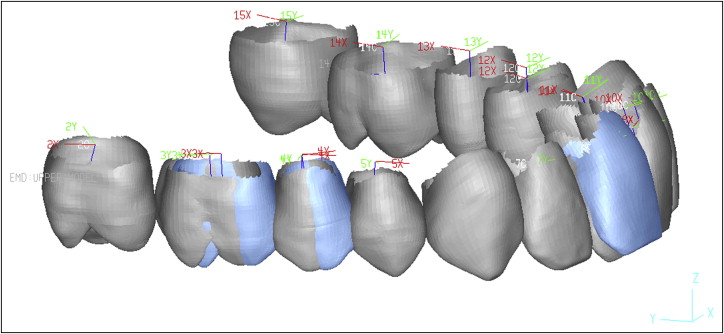
Once the setup and final digital models were combined in the same coordinate system, the individual teeth were segmented with the emodel software. Then both the setup and final digital models were loaded into the emodel Compare software. The long axis of each tooth was located, and a local coordinate system was assigned to each tooth. The rigid transformation matrix (translation and rotation) between teeth at different time points was calculated by means of an iterative closest-point registration of homologous teeth in the setup and final models. The differences in tooth position in all 3 dimensions (mesiodistal, faciolingual, and vertical) were computed by comparing the positions of the center of the coordinates between homologous teeth at the different time points. The differences in rotation (inclination or torque, angulation or tip and long-axial rotation) were computed by projecting the local coordinate systems onto the world coordinate system ( Fig 3 ).
Statistical analysis
The discrepancies in tooth position and rotation were used as the outcome variables. Demographic, initial malocclusion, and treatment variables were considered as the explanatory variables. Linear mixed effects models were constructed for each of the 6 outcome variables. The level of significance was set at 0.05.
Discrepancies for homologous teeth from the right and left sides were aggregated by tooth type. Age was centered on its mean value. Time points in treatment (days) was centered on its mean value and standardized to 120-day intervals. Time in slot-filling wire (0.0182 × 0.0182 in) was categorized into 3 groups: no slot-filling wire, 1 to 180 days in slot-filling wire, and more than 180 days in slot-filling wire.
Results
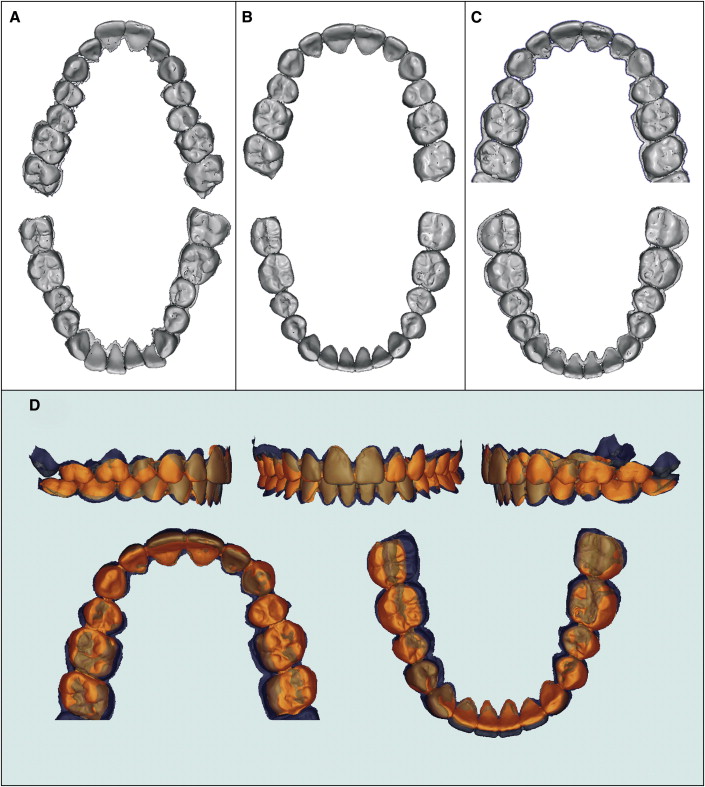
A clinical example is shown in Figure 4 . This patient’s dental Class II malocclusion was corrected by extraction of the maxillary first premolars and retraction of the front teeth into the extraction space. Digital models corresponding to the initial, setup, and final time points are depicted in Figure 4 , A through C . Note the difference in arch form between the initial and final time points. Note also that, when the setup models were registered and superimposed on the final models ( Fig 4 , D ), surfaces corresponding to the setup and end of treatment were similar except for some differences in the molar region.
In all 3 planes of space and for all teeth except the second molars, most teeth were positioned within ±1 mm of their planned positions. Means of position discrepancies were small, with the greatest discrepancy and variability at the maxillary and mandibular second molars ( Tables III and IV ). Mesiodistal discrepancies were greatest at the second molars, with the maxillary second molars usually positioned slightly mesial to their planned positions, and the mandibular second molars positioned slightly distal. A pattern was observed in the faciolingual position discrepancies, with the molars and posterior segments slightly lingual to the planned positions, and the incisors slightly labial. On average, the setup was a little wider than the final model.
| Tooth type | Measurement | |||||
|---|---|---|---|---|---|---|
| Mesiodistal (mm) | Faciolingual (mm) | Vertical (mm) | Inclination (°) | Angulation (°) | Long-axial rotation (°) | |
| Central incisor | 0.30 (−0.23, 0.60) |
0.49 (−0.17, 1.00) |
0.39 (−0.27, 0.72) |
3.35 (−5.79, 4.90) |
1.83 (−3.30, 2.46) |
2.12 (−4.03, 2.33) |
| Lateral incisor | 0.54 (−0.09, 1.01) |
0.41 (−0.68, 0.51) |
0.33 (−0.48, 0.57) |
3.61 (−3.83, 6.30) |
2.59 (−4.63, 2.4) |
3.36 (−6.39, 1.90) |
| Canine | 0.54 (−0.13, 1.03) |
0.49 (−0.95, 0.29) |
0.29 (−0.47, 0.36) |
3.78 (−4.06, 7.28) |
3.15 (−6.14, 3.06) |
3.91 (−7.00, 3.12) |
| First premolar | 0.48 (−0.29, 0.9) |
0.82 (−1.43, 0.21) |
0.24 (−0.35, 0.36) |
4.18 (−4.50, 7.56) |
3.23 (−6.23, 1.76) |
4.00 (−6.56, 4.73) |
| Second premolar | 0.50 (−0.53, 0.96) |
1.03 (−1.92, 0.44) |
0.22 (−0.33, 0.41) |
4.37 (−4.53, 8.93) |
3.00 (−5.20, 3.60) |
3.64 (−6.23, 4.39) |
| First molar | 0.54 (−0.68, 0.86) |
1.24 (−2.35, 0.12) |
0.31 (−0.49, 0.39) |
3.62 (−3.80, 7.77) |
2.59 (−4.20, 3.78) |
4.50 (−8.99, 1.90) |
| Second molar | 0.74 (−0.43, 1.34) |
2.01 (−3.42, −0.41) |
0.73 (−1.58, 0.31) |
5.80 (−1.51, 11.55) |
5.12 (−10.31, 3.72) |
4.01 (−7.53, 4.49) |
| Tooth type | Measurement | |||||
|---|---|---|---|---|---|---|
| Mesiodistal (mm) | Faciolingual (mm) | Vertical (mm) | Inclination (°) | Angulation (°) | Long-axial rotation (°) | |
| Central incisor | 0.34 (−0.46, 0.51) |
0.47 (−0.47, 0.87) |
0.37 (−0.26, 0.83) |
3.83 (−4.60, 7.10) |
2.35 (−3.26, 3.30) |
2.29 (−4.02, 3.10) |
| Lateral incisor | 0.44 (−0.41, 0.84) |
0.41 (−0.5, 0.73) |
0.35 (−0.22, 0.75) |
3.70 (−4.83, 6.36) |
2.76 (−5.03, 2.96) |
2.90 (−5.26, 2.50) |
| Canine | 0.45 (−0.41, 0.84) |
0.39 (−0.59, 0.53) |
0.29 (−0.38, 0.55) |
3.61 (−5.12, 6.30) |
2.85 (−4.03, 4.43) |
4.71 (−8.93, 1.16) |
| First premolar | 0.39 (−0.54, 0.65) |
0.55 (−0.96, 0.72) |
0.30 (−0.34, 0.49) |
4.04 (−8.00, 5.50) |
2.79 (−4.60, 4.10) |
4.13 (−7.80, 3.70) |
| Second premolar | 0.41 (−0.75, 0.52) |
0.62 (−1.18, 0.51) |
0.26 (−0.26, 0.51) |
3.64 (−7.04, 4.10) |
2.39 (−3.00, 4.08) |
3.35 (−6.60, 3.40) |
| First molar | 0.57 (−0.89, 0.35) |
0.82 (−1.59, 0.55) |
0.25 (−0.23, 0.48) |
3.94 (−7.50, 3.58) |
2.48 (−1.82, 4.60) |
3.77 (−7.10, 2.80) |
| Second molar | 0.86 (−1.45, 0.38) |
0.95 (−1.77, 1.09) |
0.81 (−0.10, 1.73) |
7.48 (−14.23, 1.80) |
5.35 (−0.66, 9.90) |
3.94 (−6.19, 5.82) |
Vertical discrepancies were the smallest and the least variable. Once again, the second molars had the greatest discrepancy, with the maxillary second molars in a more apical position and the mandibular second molars in more coronal position than in the setup models.
Rotational discrepancies were small, and their means were close to zero ( Tables III and IV ). It is important to make the distinction between rotational discrepancies, which include inclination, angulation, and long-axial rotation; the latter is defined as rotation around the computed long axis of each tooth.
The mandibular and maxillary teeth except for the second molars were on average within 4° of their planned inclinations. The second molars displayed the greatest and most variable discrepancies in inclination, with the maxillary second molars showing more inclination at their final position than the setup, and the mandibular second molars less. A pattern was seen in the mandibular arch, where the average discrepancy in inclination increased from the posterior to the anterior teeth. Angulation discrepancies were small. The maxillary second molars were slightly distally angulated, and the mandibular second molars were slightly mesially angulated compared with their planned positions. The variability in long-axial rotation was greater than inclination and angulation variability.
All variables were considered in type III mixed-effects models, the level of significance was set at 0.05, and statistically significant cells are indicated in Table V . Note that highly significant differences in all discrepancies except tooth long-axial rotation were found for the maxilla vs the mandible, and in all parameters for tooth type. Sex had no statistically significant relationship to any variable; age was statistically related to increased faciolingual discrepancy and almost reached statistical significance in mesiodistal and vertical positioning and in inclination; however, age influence was so small that it was not clinically significant.


