9
How to Interpret Cone Beam Computed Tomography Scans
Introduction
Cone beam computed tomography (CBCT) scans, as all diagnostic images, are prescribed mainly for three reasons: to assist in diagnosis, to assist in pre-surgical planning, and to assess the results of certain types of treatments or periodic evaluations (McDonald, 2011). The nature and progression of some diseases is such that diagnostic imaging ultimately could facilitate their identification and diagnosis. Diagnostic imaging is used most frequently in order to reveal pathology in areas of the human body that are not visible directly. In addition, diagnostic imaging is used to reveal features of a disease that may not be clear and may be crucial in its identification and progression.
Significant information about the disease in question may be revealed from its radiographic appearance. The analysis of a radiographic image (traditionally named radiographic interpretation) has a dual goal: the detailed review of the appearance of the diseased tissue in order to identify most or all of the features with which the pathological entity presents, and the review of the remainder of the tissues and structures included in the diagnostic image or the imaging volume in volumetric imaging, in order to rule out possible silent and, up to that point, incidental disease (Rege et al., 2012). Although dental professionals strive to meet both goals in all dental diagnostic images, this becomes rather crucial in cone beam imaging due to the novelty of the modality and the overall lack of familiarity with multiplanar imaging in the profession (Angelopoulos, 2008).
The overall excitement in the dental profession about CBCT is illustrated by the numerous publications on this topic in dental literature. This has raised some concerns in the maxillofacial radiology community specifically regarding the ability of diagnosticians to recognize normal and abnormal anatomy accurately and to identify incidental findings (Koong, 2010; Jacobs, 2011; Scarfe et al., 2012). This chapter presents a sequential and logical approach to navigating three-dimensional (3D) volumes in order to distinguish normal from abnormal anatomy and to identify pathologies and incidental findings. Specifically, we provide general principles and protocols to follow in identifying, characterizing, and potentially arriving at differential diagnosis for any given lesion. A detailed site-specific presentation of lesions and pathologies are provided in Chapter 10.
Protocols for Imaging, Quality Assurance, and Image Reconstruction
Before we address CBCT image analysis, it is important to address some factors that may affect one or more of the steps of the analysis process and ultimately the diagnostic outcome.
Selection of the appropriate CBCT imaging protocol
A thorough clinical examination, either intraoral or extraoral or both depending on the diagnostic concern, will dictate the CBCT imaging protocol to be selected. The imaging protocol includes the field of view (FOV) and the voxel resolution of the scan to be acquired. Most of the CBCT scanners currently available in the market provide adjustable FOV that range from an area of exposure as small as 50 × 50 mm, which is adequate for examining two to three teeth and their surrounding structures, to 150 × 150 mm, which is large enough to examine more than two-thirds of the patient’s head (see Chapter 2). Moreover, current CBCT scanners can acquire volumetric data with a voxel size between 0.08 and 0.4 mm, which provide images with an exceptional detail for hard tissue evaluation. The size of the pathological entity under investigation and the extent of the affected region will dictate the FOV to be selected (Scarfe & Farman, 2008). Facial asymmetries, large developmental defects, and facial trauma are some of the conditions that should steer the clinician toward the selection of an extended FOV (large imaging volume). On the contrary, implant site assessment, single tooth impactions, tooth defects, and periapical pathology are evaluated better using smaller FOV. Concomitantly, diagnostic tasks requiring high detail almost always mandate engaging a small voxel resolution to achieve the needed image resolution. Examples of such diagnostic tasks include periapical pathology, external and internal root resorption, ankylosis, and root fractures.
Scans acquired for surgical planning of pathologies or lesions should be limited to the areas of interest determined by the clinical examination and the extent of the affected region. Once more, the desired resolution is determined by the level of detail that is required to meet the objectives of the diagnostic task at hand.
CBCT scans as well as other radiographic procedures often are performed to assess the progression of disease or the outcome of a certain treatment or surgery (follow-up). The frequency of the follow-up examinations should be based on the suspected rate of the disease progression; certain pathological entities admittedly advance faster than others and no set rule exists as to the periodicity of these examinations. Once more, the follow-up clinical examination will determine how frequently these scans should be acquired. Post-surgical follow-up or post-treatment scans are prescribed to assess the progress of treatment or surgery or healing. Osseous tissue healing is slow and these scans may be acquired every 6–12 months; they also may be substituted with other simpler diagnostic images (panoramic or periapical radiographs) if the clinician is satisfied by the progress of the tissue healing. As always, the need for follow-up imaging and the selection of the appropriate type of imaging is determined after a clinical examination indicates that such an evaluation may be helpful. Progress of the treatment rendered is judged by comparing the follow-up radiographic examinations made at different time intervals after treatment or surgery with the initial radiographic examination performed before treatment or surgery.
While the above parameters provide some guidance on imaging procedures, a great deal of flexibility exists in the selection of the proper CBCT imaging protocol. The optimal protocol should be based ultimately on the clinician’s judgment, knowledge, and professional responsibility, with the clinical examination as the deciding factor.
CBCT scan quality assurance
Poor image quality may obscure fine details in a scan, and, as a result, slight or early changes in the region of interest (ROI) may be missed; this, in turn, may compromise diagnosis. In fact, the link between the high image quality and the diagnostic efficiency is well established in the literature (White & Pharoah, 2004). The most common factors affecting image quality in a CBCT scan are patient motion during the scan acquisition and artifacts. Although current CBCT scanners acquire a scan rather fast (between 5 and 30 seconds), patient motion may occur during the scan and may have a detrimental effect in image quality. Strict adherence to the manufacturer’s recommendations on patient positioning and stabilization in the scanner may reduce the likelihood of motion. A thorough review of the entire volumetric data after the scan is acquired—while the patient still is present—should be performed in order to identify signs of patient motion in the scan. If there is evidence of patient motion in the scan such as blurred images or double margins, the scan should be redone.
Artifacts are observed frequently in CBCT scans; they may deteriorate image quality and compromise diagnosis, sometimes rather significantly (Bechara et al., 2012). Metallic restorations are the most frequent cause of artifacts. They present with alternating bright and dark bands or a “sunray” appearance and may make it impossible to evaluate any areas of the scan that may overlap with the pathology or lesion being investigated. In fact, the finer the diagnostic task at hand, the lower the diagnostic contribution of a CBCT scan will be in the presence of metallic artifacts, irrespective of the size or the resolution of the FOV selected. As a result, diagnoses regarding recurrent caries assessment, crown and root fractures, early periodontal defects, and other defects around or in contact with metallic restorations are difficult, if not impossible, to be made. Under such circumstances, the clinician’s knowledge and experience will assist him or her to develop realistic expectations about the diagnostic efficiency of this exciting imaging modality.
Selection of proper reconstructions
Multiplanar imaging was introduced to dentistry with computed tomography (CT); however, the introduction of CBCT has spread its utilization to a large number of diagnostic tasks in dentistry. In simple words, multiplanar imaging or reformatting (MPR) is the ability of the clinician, or any user, to reconstruct any kind of image he or she wishes from an already acquired volumetric dataset or imaging volume. This admittedly was somewhat of a novelty for the dental profession. Dental professionals, with exception of maxillofacial radiologists and maxillofacial surgeons, rarely had any kind of exposure with the kind of diagnostic potential that MPR offers (Angelopoulos, 2008; Angelopoulos & Aghaloo, 2011). As a result, it is not uncommon for the most frequent reconstructions from an imaging volume to be panoramic images and sometimes cross-sectional images (sections perpendicular to a specific structure); these reconstructions target teeth and their surrounding structures almost exclusively. Although such standard reconstructions can contribute considerably to diagnosis, they may not be the answer to all diagnostic issues. Moreover, these select reconstructions may exclude a great deal of important data. Since some MPRs provide more diagnostic information for certain diagnostic tasks than others, it is the clinician’s professional responsibility to be knowledgeable about these options in order to utilize them when needed. Therefore, when reviewing and preparing for image analysis and diagnosis, it is crucial to include all those reconstructions that may contribute to further our understanding of the specific diagnostic question and not to limit these views to some standard images (such as panoramic, cephalometric, or cross-sectional) or other images simply because they are familiar. Thus, for example, some specific indications of images for various purposes include the following: (1) 3D reconstructions are exceptional for the evaluation of gross asymmetry of the maxillofacial region and clefts and fractures in the maxilla mandible or mid-face; (2) paranasal sinuses and their draining sites are assessed best in coronal reconstructions; and (3) the best images to evaluate the airway are axial and sagittal reconstructions of the neck.
Analysis of CBCT Images
Follow a system
The most important rule in reviewing a CBCT scan or other diagnostic images is to apply a systematic approach in order to ensure that no available diagnostic information is missed. An example of such an approach might be dividing the imaging volume in several smaller sections based on anatomical location such as the maxilla and maxillary teeth, mandible and mandibular teeth, nose and paranasal sinuses, temporomandibular joints (TMJs) and the neck, cervical spine, and skull base, and ensuring that all these sections will be reviewed and analyzed for possible clinically significant findings. This requires discipline, and it may take some time and practice to establish a pattern so as to make it almost “second nature” to follow this process, wherein steps of an algorithm are followed sequentially without any exceptions. If needed, a prepared template with these steps or anatomical locations to be reviewed can be used as a prompt and to record the findings. The same template also may be utilized even for limited field scans where no notes are included for the anatomical regions that have been omitted from the scan. In reviewing each of the anatomical regions mentioned above, special attention is paid to the “chief complaint” or the reason for the scan acquisition. Often the review may start from the region of concern, since it is natural to try to identify “what’s wrong” first. This is a common practice in most, if not all, disciplines of medicine and dentistry. This is an acceptable approach, as are modifications to the algorithm described above to fit the clinician’s needs better. However, the instant satisfaction of identifying “what’s wrong” in the region of concern may contribute to omission of one or more steps of the algorithm, which, in turn, may result in overlooking significant diagnostic findings.
Collecting diagnostic information
The review of a CBCT scan is a step-by-step analysis of all abnormal radiographic findings or features with the goal of recognizing and collecting as much information as possible that is available in the various image reconstructions (White & Pharoah, 2004). Analysis of the collected information may lead the clinician to a diagnosis or, more frequently, to a short list of possible diagnoses.
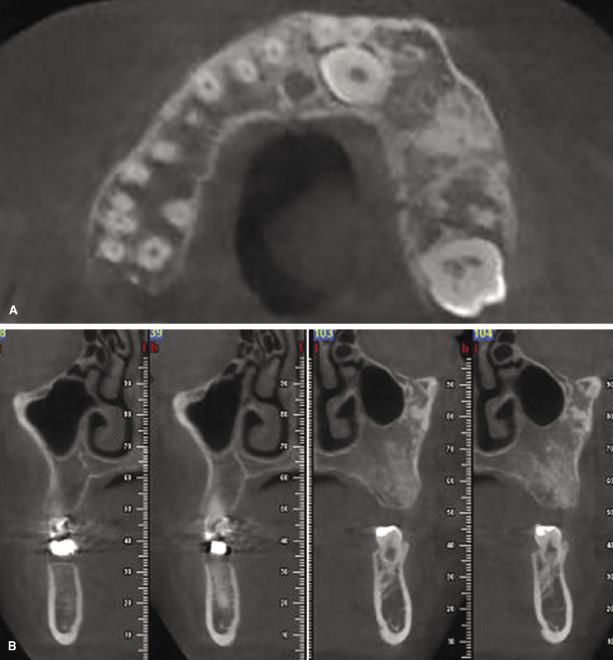
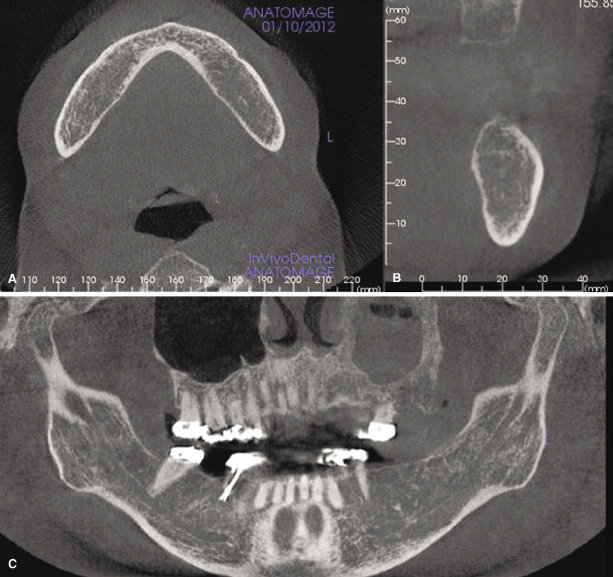
As a first step, the disease or the abnormality has to be identified. For this purpose, the diagnostician should look for irregularities in the appearance of the region that the clinical examination and/or other findings have indicated as the area of concern, including changes in the shape and size or density affecting hard or soft tissue or both at the site. Alterations in the cortical or cancellous bone pattern (Figure 9.1 and Figure 9.2) are a frequent result of disease. Although dentists largely are familiar with normal and abnormal appearance of the osseous tissue in traditional dental diagnostic images, getting acquainted with irregular appearance of tissues in CBCT may require substantial exposure to and experience with these images (Ahmed et al., 2012). With regard to soft tissues, CBCT images show minimal differences in density of various soft tissues (Figure 9.3); their changes in disease processes are almost impossible to identify unless the disease has caused either extensive destruction of the soft tissue involved or has induced the production of dystrophic calcifications (see Chapter 10).
Stay updated, free dental videos. Join our Telegram channel
VIDEdental - Online dental courses


