19
3D Planning and Treatment Outcomes of Bone Anchored Maxillary Protraction
Introduction
Patients with Class III malocclusion account for a small percentage of the population (Proffit et al., 1998) but are among the most difficult to treat. Treatment goals for obtaining positive overjet for these Class III patients are accomplished through a combination of orthopedic correction and dentoalveolar compensation. The current standard for early treatment involves the use of reverse pull headgear (RPHG). This approach has limitations, however, since the forces are applied directly to the teeth, resulting in uncertain skeletal change and often unwanted dentoalveolar effects. Short-term studies on RPHG show limited orthopedic protraction of the maxilla, a clockwise rotation of the mandible, and dentoalveolar compensations, including the proclination of the maxillary incisors and retroclination of the mandibular incisors (Ishii et al., 1987; Baik, 1995; Gallagher et al., 1998; Kim et al., 1999; Macdonald et al., 1999; Kama et al., 2006). In addition, facemask therapy largely has been shown to be successful in the primary or early mixed dentition (Baccetti et al., 2000). Finally, long-term follow-up of maxillary protraction shows that there is an approximate 25–33% chance of relapse to negative overjet once growth is completed (Hagg et al., 2003; Westwood et al., 2003; Baccetti et al., 2004). With the recent increase in use of temporary anchorage devices (TADs) in orthodontic treatment, the concept of maxillary protraction has been revisited and adapted in an attempt to minimize the unwanted dentoalveolar effects while maximizing orthopedic change (Singer et al., 2000; Enacar et al., 2003; Hong et al., 2005; Cornelis et al., 2007; Kircelli & Pektas, 2008). This chapter provides a review of the current status of protocols used for bone anchored maxillary protraction (BAMP) and the treatment outcomes in 3D when using this approach to correct Class III malocclusion.
Two-Dimensional (2D) Analysis of BAMP
Treatment outcomes of the BAMP protocol until recently have been studied using conventional two-dimensional (2D) imaging. De Clerck and coworkers (2010) compared 21 consecutively treated BAMP patients to 18 untreated Class III patients who were matched with the treatment group based on the severity of malocclusion, age, sex, and duration of observation. The study showed that BAMP produced significant orthopedic maxillary protraction as well as mandibular restraint when compared with untreated Class III controls. The authors also reported a decrease in the mandibular plane angle and decompensation of the lower incisor following BAMP treatment. Additionally, the treatment effects of BAMP using thin-plate spline analysis revealed a marked forward displacement of the maxilla with more moderate favorable changes in the mandible and no change in the vertical dimension (Baccetti et al., 2011).
A subsequent study compared the effectiveness of BAMP versus conventional Class III therapy that utilized face mask (FM) combined with rapid maxillary expansion (RME/FM) in treating Class III malocclusion (Cevidanes et al., 2010). The BAMP protocol produced significantly larger maxillary advancement than RME/FM therapy. Vertical changes were controlled better with BAMP than with RME/FM therapy. Finally, relative to the RME/FM treatment, BAMP treatment resulted in no counterclockwise rotation of the mandible, lack of retroclination of the lower incisors, and a greater improvement in the sagittal intermaxillary relationships.
Rationale for Using 3D Imaging in Assessing Treatment Effects
For the last half-century, the lateral cephalometric head film has been the standard radiographic image used to aid in diagnosis and treatment planning of orthodontic malocclusions. Recent advances of three-dimensional (3D) radiographic imaging in dentistry have made it possible to gain substantially greater information than conventional 2D imaging. There is no doubt that accurate images of the craniofacial region are critical for the development of a good diagnosis and treatment plan. However, there are some limitations with standard 2D imaging that particularly impact on the ability to achieve a comprehensive understanding of treatment outcomes. Until recently, diagnosis, treatment planning, and assessment of change over time have been based on the use of 2D landmarks. Angular and linear measurements between landmarks provide useful information about change over time in the anteroposterior and vertical planes of space, but even then, the assessment is based on change that occurred at discrete points placed on a 2D rendering of a 3D object. An inherent limitation in this approach is the inability to assess how entire surfaces, rather than discrete points, changed. Furthermore, the lateral cephalogram provides no information with regard to the transverse plane of space, while the postero-anterior (PA) cephalogram is of only limited value for assessing change in this dimension. It seems clear that the greater amount of information acquired with 3D imaging techniques has the potential to allow for more thorough diagnosis, treatment planning, and assessment of changes in anatomy and position of facial structures over time.
Although the introduction of conventional computed tomography (CT) enhanced the potential to derive high quality, accurate 3D images of any anatomic region, the associated expense and high ionizing radiation has limited its use in dentistry. The recent advances in 3D dental radiographic imaging, including the introduction of cone beam computed tomography (CBCT; Kapila & Farman, 2003; Ludlow et al., 2006), provide a lower cost and lower radiation alternative to view maxillofacial region in 3D via a digital representation of the patient’s anatomy as it exists in nature. This imaging approach represents a definite advantage over traditional 2D views whose caveats include rotational, geometric, and head positioning errors (Lou et al., 2007). These errors may lead to inaccurate representation of anatomic landmarks, poor visualization of some structures, or inaccurate recording of growth and/or treatment changes (Park et al., 2006). In addition, the problem of necessary image calibration for magnification of the 2D projection also is eliminated with CBCT data. Traditional 2D imaging always yields some level of projection error due to the fact that the anatomic area of interest is some distance from the film onto which the image is being projected. CBCT projections are orthogonal, which implies that the X-ray beams are parallel to one another, and the source-to-object distance is small, resulting in little projection error. The small amount of projection error that exists is corrected by the CBCT scanner’s software, resulting in one-to-one data (Mah & Hatcher, 2004). Thus, the use of this imaging modality offers advantages to the detailed study of the effects of BAMP on changes in maxillary and mandibular anatomy and position in correction of Class III malocclusions.
Clinical Methodology and Protocols
In recent years, titanium miniplates (or bone anchors) have been modified for orthodontic use. They offer certain advantages over miniscrews, including increased stability, rigid fixation, and placement at sites away from the roots (Cornelis et al., 2007). At the 2003 European Orthodontic Society meeting, De Clerck presented treated cases that introduced the idea of BAMP as a means to obtain orthopedic correction in young Class III patients as outlined below.
Surgical and Orthopedic Protocol
In the original protocol, four Bollard miniplates were placed in each patient—two in each infrazygomatic crest of the maxilla and two in the anterior mandible between the lateral incisor and canine. Surgical flaps were reflected at these sites and the plates were secured with titanium screws (2.3 mm diameter and length of 5–7 mm; Cornelis et al., 2008). The titanium miniplates were modified to include an extension arm that emerges in attached gingiva at or near the mucogingival junction. In addition, the miniplates contained hooks for the application of interarch elastics (Figure 19.1).
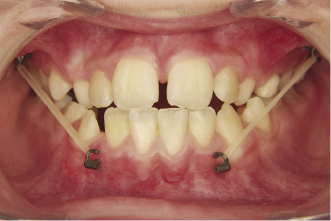
The miniplates were loaded 3 weeks after surgery. Class III vector elastics were applied between the hooks of the miniplates with an initial loading force of approximately 150 g to each side and gradually increased to 250 g (Figure 19.1). Patients were instructed to wear the elastics 24 hours per day with instructions to replace the elastics at least once per day. The duration of treatment was approximately 12 months when adequate positive overjet was achieved (De Clerck et al., 2009). In many of the cases, an ovecorrection of the overjet was achieved.
Imaging Protocol
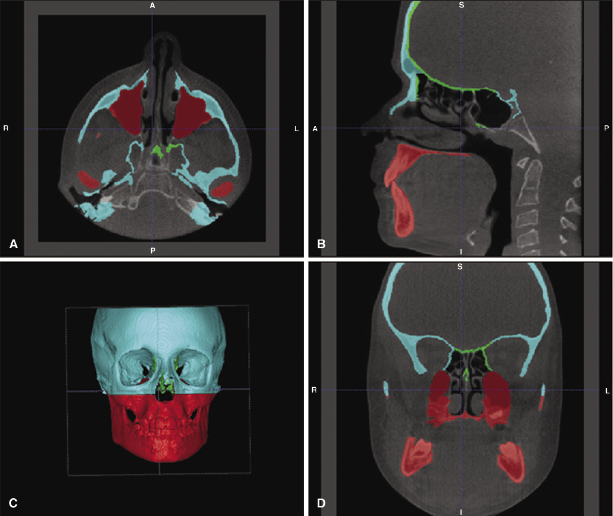
To analyze the treatment changes in 3D, CBCT scans were taken after placement of the miniplates and after approximately 1 year of treatment. The scans were acquired with an iCat machine (Imaging Sciences International, Hatfield, PA) with a 40-second scan and a 16 cm × 22 cm field of view (FOV). Image analysis of each CBCT was processed using the methods described by Cevidanes and colleagues (2009). Briefly, the native Digital Imaging and Communications in Medicine (DICOM) format files were compressed to a 0.5 mm voxel isotropic Guys Image Processing Lab (GIPL) volume file to prepare for the segmentation of the models. Segmentation is the process of outlining the 3D surface of anatomic structures from each cross-sectional slice of the CBCT data (axial, coronal, and sagittal; Figure 19.2). This semi-automatic process is performed using ITK-SNAP (Yushkevich et al., 2006) and employs an algorithm that expands a deformable bubble until it reaches the predefined anatomic border. The borders themselves are set by either threshold intensity or edge surfaces. While the process is fairly accurate for anatomic regions with dense bone or regions where the neighboring borders have distinct differences in grayscale levels, it tends to fail in regions with thin cortical bone such as the glenoid fossa and pterygoid plates or when anatomic borders are not demarcated well (Periago et al., 2008). For these regions, manual segmentation is necessary.
Stay updated, free dental videos. Join our Telegram channel
VIDEdental - Online dental courses


