17
Assessment of Maxillary Transverse Deficiency and Treatment Outcomes by Cone Beam Computed Tomography
Introduction
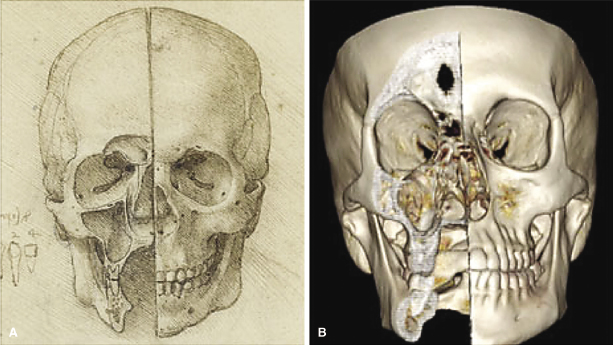
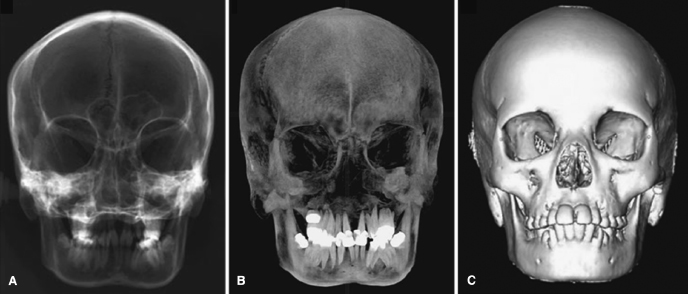
The maxilla is a complex bone that has fascinated anatomists for centuries. Among the earliest recorded dissections of the maxilla is “A Skull Sectioned” by Leonardo da Vinci from 1489. In a remarkable exhibit presented at the Queen’s Gallery at Buckingham Palace in 2012, da Vinci’s dissections were paired with volumetric 3D computed tomography (CT) images taken by Dr. Richard Wellings, who sliced the radiographs to mimic the artwork (Figure 17.1). The validation of da Vinci’s 15th-century depiction of the maxillofacial skeleton using 21st-century radiographic technology should not be dismissed as a non-scientific curiosity suitable for framing. Indeed, Peter Abrahams, professor of clinical anatomy, Warwick University (United Kingdom), considers da Vinci’s work to be 300 years ahead of its time and that 3D radiographs are the only images from the past 524 years that surpass the master’s work (Banerji, 2012). Others consider da Vinci’s attention to detail a valuable lesson for clinicians in training, whose reliance on state-of-the-art diagnostic tools can lead to misdiagnosis if the machines are considered infallible (Gerrits & Veening, 2012).
In this chapter, the evolution of radiography will be discussed as a critical tool for assessing the maxillary transverse dimension accurately, which is one of the most common contributors to malocclusion. Specifically, topics reviewed will include the role of radiographs in detailing transverse maxillary growth and development, midpalatal sutural changes as we age, and evidence-based conclusions regarding maxillary expansion treatment. The terms rapid maxillary expansion (RME) and rapid palatal expansion (RPE) often are used interchangeably, although they technically refer to two different treatments. Expansion of the entire maxilla, which is performed surgically, traditionally is referred to as RME, while RPE is used to describe expansion of the palate “only” using a tooth- or tooth-tissue-borne palatal expander. However, since the distribution of RPE-generated forces indeed do extend to the entire maxilla and are known to contribute to sutural changes at sites distant from the palate, all expansion treatments will be referred to as RME in this chapter.
Accuracy of Maxillary Width Measurements Taken from 2D and 3D Radiographs
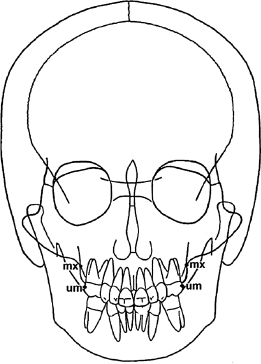
A critical reader of radiology-based craniofacial morphology studies should understand the technical limitations of the research approach used by the authors. The human skull is unrivaled in its structural complexity, which makes radiographic interpretation of craniofacial morphology especially challenging. Conventional lateral and posterior-anterior (PA) cephalographs suffer from the now well-known litany of problems that arise when a 3D object is projected onto a 2D plane: magnification distortion, geometric distortion, superimposed structures, and inconsistent head position during imaging (Pirttiniemi et al., 1996; Malkoc et al., 2005). While lateral and PA cephalographs are prone to these problems equally, because orthodontists use lateral cephalographs more routinely than PA cephalographs, the accuracy of landmark identification is relatively higher on lateral cephalographs (Hägg et al., 1998). Practitioner inexperience is a major contributor to inaccurate landmark identification on PA cephalographs, which compounds the other technical problems that plague these radiographs (Leonardi et al., 2008). For example, placement of the right and left jugale points (“mx” in Figure 17.2) on a PA cephalograph deviated up to 3 mm horizontally and 7 mm vertically among a group of five clinicians (Athanasiou et al., 1999). Even worse, maxillary molar landmark placement (“um” in Figure 17.2) deviated 4 mm horizontally and up to 8 mm vertically (Athanasiou et al., 1999). It is important to keep these data in mind when assessing studies using conventional 2D PA cephalographs because these two landmarks for the maxillary base and maxillary first molars are used widely to report maxillary width measurements on conventional 2D radiographs.
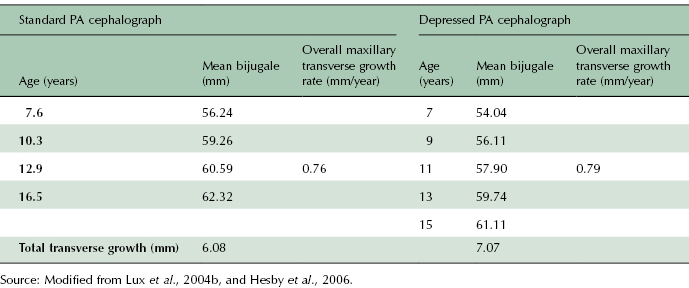
It also must be noted that there are two approaches to taking PA cephalographs. The standard PA cephalograph is taken with the patient looking straight ahead such that Frankfort horizontal is at 0° with the horizontal plane (Figure 17.3A; Lux et al., 2004b). The depressed PA cephalograph is taken with the patient’s head tilted forward such that Frankfort horizontal forms a 35° angle with the horizontal plane (Figure 17.3B). Thus, it is important to recognize that transverse measurements taken from PA cephalographs may be different depending on the imaging technique used. For example, mean maxillary basal widths (bijugale) are larger on standard PA compared with depressed PA cephalographs of children aged 7–16 years (Table 17.1). Yet total transverse growth and overall transverse growth rates are higher on the depressed PA cephalograph relative to the standard PA cephalograph. In this example, it can be argued that the 0.9 mm difference in total transverse growth and the 0.03 mm/year difference in overall growth rate assessed on the different PA projections are not clinically significant, thus making the imaging methodology a moot point. That argument works for comparisons of a small number of studies, but these differences can be magnified if data from a larger number of studies are pooled to perform a meta-analysis. Thus, researchers interested in performing such a large-scale analysis must be cautioned to factor the imaging technique used in each study into their derivations and conclusions.
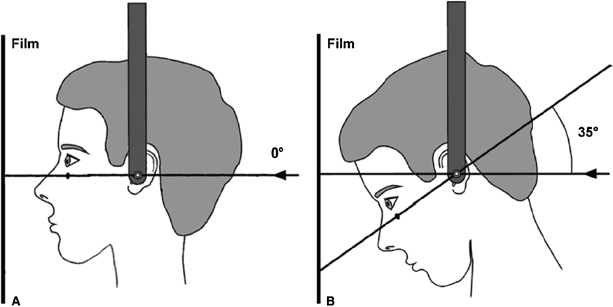
Table 17.1 Comparison of maxillary transverse measurements (mean bijugale) and growth rates determined from standard and depressed PA cephalographs. Data demonstrate a consistently smaller yearly bijugale measurement on depressed PA cephalographs, yet the annual growth rate and total growth are higher on these cephalographs compared with the values calculated from the standard PA cephalograph.
It is clear that landmark placement and measurement accuracies on conventional 2D PA cephalographs suffer from numerous technical problems. In this regard, it is arguable that da Vinci understood maxillary anatomy better than anyone whose primary view of the maxilla comes from conventional 2D radiographs. Fortunately, as demonstrated in Figure 17.1, CT gives today’s clinicians an edge over da Vinci’s since we can obtain accurate 3D images of the maxilla from living people.
There is a sizable literature establishing measurement accuracy including that of maxillary transverse measurements on 3D radiographs (Damstra et al., 2010; Gribel et al., 2011; van Vlijmen et al., 2011). In keeping with the relatively infrequent use of PA cephalographs, it is not surprising that few studies have assessed the accuracy of landmark placement and morphometric measurements specifically on PA (or, more appropriately, coronal) CBCT radiographs (van Vlijmen et al., 2009a, 2009b). In the two latter studies, the investigators radiographed 40 dried human skulls to generate conventional 2D PA cephalographs and constructed CBCT PA radiographs (essentially unsliced coronal CBCT images) and 3D volumetric frontal images of the skulls (Figure 17.4). The reliability of linear and angular measurements was assessed on each image by having the researcher place landmarks and take measurements five times and then calculate the Pearson’s correlation coefficient for the replicate measurements. Not surprisingly, each measurement had a higher reliability rating on the CBCT images compared with the conventional 2D PA cephalographs. For example, the average reliability of angular measurements taken from the right and left jugale points was approximately 40% higher on the constructed 3D PA cephalograph and approximately 60% higher on the 3D volumetric frontal image compared with the conventional 2D PA cephalograph. Taken together, data from these studies suggest that although landmark placement and cephalometric assessment of the maxillary transverse dimension are more accurate on 3D than 2D images, orthodontists who choose to assess maxillary width in their diagnostic workup and who are not conversant with related landmarks should heed extra caution in landmark placement on both 2D and 3D PA cephalographs to optimize measurement accuracy.
Although skin decreases the accuracy of landmark placement and measurements on radiographs, human subject–based accuracy studies that directly compare transverse measurements taken from 2D and 3D PA cephalographs of patients confirm the reliability of these data, similar to that from the dried skull studies. Transverse measurements taken on volumetric and reconstructed PA cephalographs derived from CBCT data of adults had significantly less variation than measurements taken from conventional 2D PA cephalographs (Kim et al., 2012; Nur et al., 2012). Only one of these studies looked specifically at maxillary width and found a 3.03 mm difference in the measurements taken from the 2D and 3D cephalographs, with the 2D measurement being wider (Nur et al., 2012). This is not likely to be significant clinically given that the mean maxillary width measurements in this study had standard deviations of 4.31 mm on the 2D radiographs and 3.99 mm on the 3D radiographs. From a clinical perspective, therefore, it currently does not appear that CBCT radiographs offer increased precision of transverse measurements that is beneficial diagnostically.
Radiographic Assessment of Maxillary Transverse Growth
Prior to the now universally accepted “as low as reasonably achievable” (ALARA) principle for prescribing radiographs, 2D lateral and PA cephalographs were taken annually or semi-annually on growing children at several research institutions around the world. These radiographs, which were taken along with dental casts, are the basis for numerous longitudinal growth studies (Cortella et al., 1997; Lux et al., 2004a, 2004b; Wagner & Chung, 2005; Edwards et al., 2007; Vásquez et al., 2009). More often than not, these studies assess sagittal and vertical growth using lateral cephalographs, although there are some that use PA cephalographs to assess transverse growth. As is well known, technical problems with 2D cephalographs, especially PA cephalographs, limit the research questions that can be asked when using these films. While 3D radiographs are not constrained by the technical limitations common to 2D cephalographs, the inability to take annual or semi-annual 3D radiographs for ethical reasons on the same subjects as they grow imposes its own set of restrictions on the research questions that can be asked regarding craniofacial growth. Clinically useful conclusions can be drawn about craniofacial growth from available 2D and 3D cephalograph-based studies that use different children at each time point, provided it is acknowledged that biases may arise due to several factors, such as the impact of the uniqueness of facial growth in individuals in a small sample size or the lack of untreated controls.
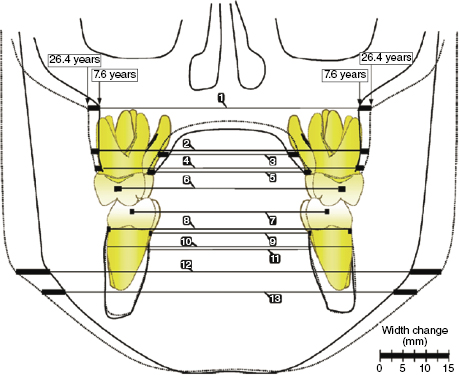
An excellent example of how conventional 2D PA cephalographs could be used to assess normal transverse craniofacial growth was seen in the study by Hesby and colleagues (2006). This group used the Iowa Facial Growth Study PA radiographs to assess transverse maxillary and mandibular growth in untreated Class I subjects aged 7.6–26.4 years (Figure 17.5). Pooled data from 18 girls and 18 boys demonstrated that peak maxillary transverse growth of 0.76 mm/year occurred at 16.5 years. Unlike the maxilla, mandibular transverse growth did not peak during the time course of this study. Instead, mandibular transverse growth increased steadily and rapidly until 16.5 years of age, then increased asymptotically until 26.4 years to give an overall growth rate of 1.24 mm/year. Interestingly, the average transverse growth of the maxillary structures formed an inverted triangle with the greatest transverse growth at the maxillary base (5.37 mm) and the least growth at the maxillary first molars (3.08 mm). Like the maxilla, the mandible also had the greatest transverse growth at its base (14.54 mm), but growth at the alveolar crest and mandibular first molars were nearly identical (1.60 mm and 2.05 mm, respectively). The researchers compared their findings directly with several other longitudinal growth studies and found that the data are consistent across the studies (Hesby et al., 2006, and references therein).
There is generalized clinical agreement that maxillary transverse growth rate in boys and girls peaks early during the pubertal growth spurt and that mandibular transverse growth lags behind maxillary transverse growth (Cortella et al., 1997), not unlike what occurs in maxilla and mandible growth in the sagittal plane. Interestingly, maxillary and mandibular intermolar widths vary little compared with the skeletal base in either jaw, suggesting that transverse occlusal relationships are established and stabilized in early childhood. As will be discussed later, this may contribute to the transverse maxillary patterning that is seen in children with different sagittal and vertical growth patterns.
Related to the timing of the transverse growth spurt, there still is an unresolved controversy regarding when maxillary transverse growth ceases. Some authors conclude that maxillary transverse growth continues asymptotically until adulthood and that the peak transverse growth rate is highest in pre-teens and young teens (13–14 years old; Korn & Baumrind, 1990; Athanasiou et al., 1992; Yavuz et al., 2004; Lux et al., 2004a, 2004b). Conversely, some authors conclude that maxillary transverse growth stops in the early teens (13–14 years) before growth stops in the other planes (Snodell et al., 1993; Wagner & Chung, 2005; Edwards et al., 2007). Resolution of this issue is important because it impacts the related controversy regarding the efficacy of early orthopedic correction of maxillary transverse deficiency (McNamara, 2002). If optimized orthopedic correction is achieved best when treatment begins at the peak growth spurt, then knowing when maxillary transverse growth peaks is critical for developing the appropriate expansion protocol in children with a narrow maxilla.
In addition to providing important insight into craniofacial growth, longitudinal growth studies form the basis for age- and sex-based cephalometric norms used for diagnosing skeletal and dental malocclusions. It is important to note that most of the normative growth studies were performed on Caucasian children with a Class I skeletal relationship. Few PA cephalometric norms for non-Caucasian children are available. In fact, only one study (Al-Azemi & Årtun, 2012) has been published, showing that Kuwaiti adolescents have wider maxillary measurements compared with age-matched Caucasian norms (Ricketts et al., 1982). Interestingly, non-Caucasian adult PA cephalometric norms for Turks (Uysal & Sari, 2005) and Peruvian-Americans (Pérez et al., 2011) do not differ from Ricketts’ adult transverse norms. There is a clear need for non-Caucasian PA cephalometric norms, especially in children, to diagnose transverse skeletal malocclusion better in orthodontics patients.
Another important reason to collect normative lateral and PA cephalometric data across ethnic groups, sexes, and ages is to establish sizable databases for future genetic research on craniofacial patterning in human populations (Liu et al., 2012). One of the greatest frustrations of orthodontists is the inability to predict craniofacial growth in children, which greatly hinders orthodontic diagnosis of skeletal malocclusions, which may benefit from early treatment during childhood or adolescence. Determination of the genetic background of individuals with distinct skeletal discrepancies in each plane of space will help in developing a powerful diagnostic tool for predicting growth discrepancies in young children. An initial step toward integrating craniofacial morphology and genetics recently has been made for European adults (Liu et al., 2012).
Diagnosing Maxillary Transverse Deficiency Using PA Cephalographs
The clinical need for normative data on maxillary transverse growth is to improve the diagnosis of maxillary transverse discrepancy in children. Early diagnosis offers the best opportunity for orthopedic correction with palatal expansion. Interestingly, maxillary constriction is not always obvious clinically. While a posterior crossbite often is diagnostic for a narrow maxilla, a narrow maxillary intermolar without a crossbite also can indicate the need for maxillary expansion (McNamara, 2002). The absence of a crossbite in a patient with a narrow maxilla possibly results from the stability of intermolar width established early and continues to manifest during maxillary and mandibular transverse growth throughout adolescence. In patients with a narrow maxilla but no posterior crossbite, it is common to find dental compensations such as excessive buccal flaring of the maxillary dentition and a deep Curve of Wilson in the lower dentition that mask the maxillary transverse constriction. CBCT images are invaluable for assessing these dental compensations and the alveolar boundary conditions if addressing crown or root torque is being considered as part of the treatment (see Chapters 11 and 14).
Longitudinal growth studies of children with Class II and Class III skeletal malocclusions demonstrate the value of PA cephalographs in diagnosing a narrow maxilla in young patients. Lux and associates (2003) used conventional 2D PA cephalographs and dental casts to examine growth changes in transverse skeletal and dental measurements in children with four malocclusions: (1) ideal Class I occlusion (19 boys, 18 girls); (2) “good” Class I occlusion with mild crowding (18 boys, 8 girls); (3) Class II, Division 1 (8 boys, 9 girls); and (4) Class II, Division 2 (8 boys, 4 girls). The authors found that Class II, Division 1, boys and girls aged 7–15 had consistently less transverse maxillary growth compared with boys with the three other occlusions. Not surprisingly, the boys and girls with Class II, Division 1 malocclusion had the smallest maxillary intermolar distance throughout growth. Equally important to note is the finding that the boys and girls with a Class II, Division 2 malocclusion had the second smallest maxillary base widths throughout growth. Likewise, 2D PA radiographic analysis of maxillary widths among girls with a Class III malocclusion (n = 19) and widths in girls with a Class I occlusion (n = 20; Chen et al., 2008) demonstrates that the interjugal maxillary width and the maxillary intermolar distance both were significantly smaller in the Class III subjects at each time point every year between the ages of 10 and 14 years. In summary, both maxillary and/or dental transversal dimensions in Class II and Class III subjects consistently were found to be smaller than in Class I subjects.
Given the inaccuracies associated with conventional 2D PA cephalographs, it would be helpful to know if CBCT images improve diagnosis of maxillary transverse discrepancies in children with different malocclusions. To date, no such studies have been performed, which most likely reflects the limited use of PA cephalographs in clinical practice in general and, by extension, an inadequate understanding on how to use CBCT imaging for diagnosing maxillary transverse deficiency. In addition, current ethical guidelines preclude longitudinal CBCT imaging of subjects for detailed analyses of transversally deficient cases for extracting potential clinically valuable information. Given the latter constraints, at this time, a conventional 2D PA cephalograph—in the hands of an experienced clinician—can serve as a useful tool to diagnose maxillary transverse deficiency in orthodontics patients. Orthodontists must keep in mind that while a posterior crossbite often indicates a narrow maxilla, patients with a Class II or Class III skeletal malocclusion without a posterior crossbite also may have a transverse maxillary deficiency. The only way to diagnose such transverse deficiencies or disharmonies is to take and analyze PA cephalographs accurately. With additional discoveries using CBCT, it is likely that CBCT rather than PA cephalographs will be increasingly utilized for this diagnostic purpose in the future.
Radiographic Assessment of Midpalatal Suture Ossification
While PA cephalographs are invaluable for diagnosing maxillary transverse deficiency, the choice of maxillary expansion treatment rarely is based on the PA cephalographs. Instead, most orthodontists rely on the maxillary-mandibular intermolar discrepancy and the patient’s age to determine the best approach to gain sufficient maxillary width. Patient age is considered an especially important factor for choosing between nonsurgical or surgical approaches to maxillary expansion due to the widespread belief that the midpalatal suture is patent through our early to mid-teens and ossified or interdigitated heavily in late teens and adulthood. A patent midpalatal suture is considered highly responsive to transverse forces, whereas an ossified or interdigitated suture not only is unresponsive to nonsurgical expansion, but also is expanding under these circumstances, potentially is harmful to the alveolar bone and periodontium, and places teeth in potentially unstable bucco-lingual angulations. Yet there is a surprising lack of consensus on the appropriate approach to maxillary expansion in adults (Handelman, 2011; Northway, 2011). A discussion is needed of how the midpalatal suture changes as we age in order to help clinicians decide which maxillary expansion protocol is suitable for their patients.
Modern anatomists differ from da Vinci primarily in the tools used to perform and analyze their dissections. Where da Vinci was confined to the macroscopic world of organs and tissues, modern anatomists can roam the microscopic world of cells and their subcellular components freely. Modern anatomists studying the maxilla do share one restriction with da Vinci, however: they rely heavily on cadavers for their studies. Fortunately, post-mortem cadavers, if well preserved, are remarkably suitable for performing detailed macroscopic and microscopic anatomical studies and have been used to undertake detailed studies on midpalatal sutures.
Three methods are used to assess midpalatal suture anatomy: histology, 2D radiology, and 3D radiology. Without exception, the most detailed data, hence most accurate, on age-related changes in the midpalatal suture come from histological studies. With improvements in radiographic techniques, it is common to find studies that use both histology and radiology. These studies are valuable especially because they not only provide detailed insights into the sutural growth, but also demonstrate the shortcomings of radiographs as diagnostic tools to assess the degree of sutural ossification in orthodontics patients.
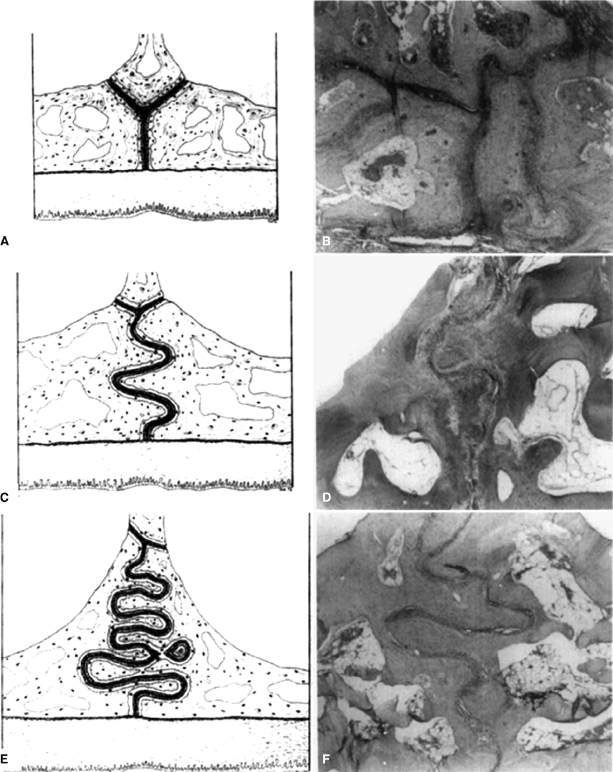
Melsen (1975) pioneered the combined use of detailed histology and microradiology to assess sutural changes in the human palate. Examining post-mortem palates from 33 boys and 27 girls aged 0–18 years, three stages in the midpalatal suture development were described (Figure 17.6). Stage one, the infantile stage, is notable for the wedging of the vomer between the two abutting palatal shelves, which gives the midpalatal suture a Y-shaped configuration when viewed in a coronal section. In stage two, the juvenile stage, the upper portion of the Y flattens out and the vertical portion begins developing curves, effectively increasing the suture’s length. Last, stage three, the adolescent stage, is demarcated by the extensive interdigitation that generally is associated with full maturity. This study did not provide specific ages for each stage of sutural maturation, however. Overall, it demonstrated that the lack of excessive interdigitation in younger children is a major reason orthodontists generally agree that nonsurgical maxillary expansion is performed best in younger patients.
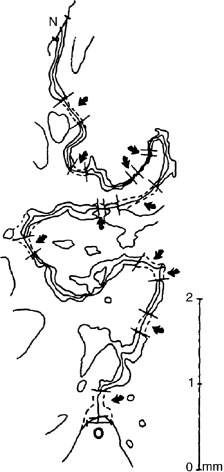
Two follow-up studies to Melsen’s work on children studied sutural closure in young adults. In the first study, Persson & Thilander (1977) developed the “obliteration index” (OI) to quantify the percentage of ossification in the midpalatal suture. Using post-mortem samples collected from 14 males and 10 females aged 15–35 years, the authors first stained coronal midpalatal suture slices with hematoxylin-eosin. Then they took microphotographs, projected them onto paper, and traced the suture (Figure 17.7). In each tracing, the investigators marked the boundaries of bony bridges, which they then measured to give the total amount of ossification in the suture. The total length of the suture was then measured using a “map-measuring instrument.” The OI finally was calculated as the ratio of the total ossification length divided by the total suture length, multiplied by 100. Using this approach, the OI in subjects aged 15–19 years averaged 0.9%. Unfortunately, the mean OI for the older subjects was not calculated. Instead, it was noted that there was a steady increase in OI as the subjects aged. Bony bridges appear most often in the posterior region of the midpalatal suture across the age group studied. Equally important, the findings demonstrated that there is considerable variability in OI between individuals and between different regions of the suture in each individual.
In the second study that followed Melsen’s work, Wehrbein & Yildizhan (2001) used post-mortem samples from young adults aged 18–38. This study more closely resembles Melsen’s because it uses a combination of radiology and histology to assess midpalatal suture closure. Radiographs were performed so as to mimic clinical occlusal radiographs, which allowed visualization of the midpalatal suture along its length. Three 1-mm-long regions of interest (ROIs) were selected from the anterior, middle, and posterior of the suture, and the sutures were graded as either visible or non-visible. Histological sections then were generated from each of the regions, photographed, and evaluated using computerized morphometric software. The mean suture width and OI were different significantly between the groups with visible versus non-visible sutures. Visible sutures generally were oriented vertically in line with the X-ray beam (Figure 17.8A), had a mean suture width of 231 μm, and a mean OI of 0.45%. Seven of the 10 ROIs in the visible group had an OI of 0%. The morphological features of the non-visible sutures were variable. Some were interdigitated highly (Figure 17.8B), as would be expected in this age group. Others, however, were not highly interdigitated and presented instead with a suture that was oriented obliquely such that the X-ray beam was not parallel to the suture (Figure 17.8C) nor did it retain the Y-shaped configuration of an infantile palate (


