13
Quality of Outcome
It is important to quantify change and the outcome of a clinical intervention to determine how effective the intervention process is. Clinicians should be able to measure change at any stage of treatment for a single patient or groups of patients, and the change recorded can be related to the facial and occlusal status at the previous visit or the start of treatment. The differences at each stage of treatment can be judged against a known predicted outcome, best available evidence, or consensus agreement obtained from a panel of professionals and/or laypersons. The assessment of the outcome of treatment can incorporate additional constraints such as perceived benefits, timing, duration, cost, and adverse effects.
The assessment of outcome is complicated by the long duration of most interventions, and these interventions are often undertaken at a time when significant facial growth is observed. Therefore, when assessing the effectiveness of an intervention, the outcome has to quantify the effect of the intervention over and above the predicted or observed growth and developmental changes.
This chapter will provide a brief overview on a range of health technology assessments for determining orthodontic outcomes with regard to
- facial morphology,
- alignment and fit of teeth,
- cost-effectiveness,
- perceived benefits of orthodontic treatment: facial and dental attractiveness, sociopsychological factors, and
- patient satisfaction
Facial Morphology
Facial structures have been captured radiographically for over 70 years, and the plethora of cephalometric analyses suggest that these assessments do not necessarily capture the detail clinicians seek and lack the sensitivity in discriminating the effects of facial growth and orthodontic intervention. Initially, the standardization of image capture was thought to be assured with the patient held in a fixed position with the head aligned to the Frankfurt plane. However, research into positioning errors suggests that the variants on natural head posture may show greater consistency compared with the fixed location using nasal and external auditory meatus positioners (Barbera, Sampson & Townsend 2009; Cuccia & Caradonna 2009). Cephalometric analyses use various facial landmarks as a reference to identify a feature of the anatomy. These facial landmarks fall into four main categories (1) the center of a structure or space (e.g., Sella); (2) juxtaposition (e.g., Nasion); (3) deepest concavity/convexity (e.g., A and B points); and (4) extreme point—most anterior/posterior/superior/inferior (e.g., anterior nasal spine/posterior nasal) spine. There will be significant spatial differences in landmark positioning depending on how the cephalogram is aligned. If the cephalogram is aligned on the Sella-Nasion line, with the Sella as origin, superimposition of sequential radiographs will project the face downward and forward similar to that observed during normal growth. However, superimposition at Nasion would show an inferior and posterior growth rotation. The superimposition on the Sella-Nasion line at Sella is commonly used, although it should be acknowledged that the downward and forward movement may be overestimated due to remodeling of the posterior clinoid process and forward development of Nasion anteriorly and superiorly during the ages of 8 to 18 years.
The reliability in locating landmarks also varies accordingly to the clarity and definition of each landmark as well as male and female characteristics (Gwilliam, Cunningham, & Hutton 2008; Toma et al. 2009). In both 2-D and 3-D growth studies, males exhibit greater changes in facial height and width, with significant increased prominence of the glabella, Nasion, pogonion, and pronasale (Kau & Richmond 2008). It would be ideal to register and compare all facial landmark data on a common reference framework. The use of the Sella-Nasion plane at Sella would not be suitable because, as mentioned previously, the landmarks move as a result of normal developmental growth. Another technique has been proposed, such as Procrustes analyses (Bookstein 1991; McIntyre & Mossey 2003, Bruner & Manzi 2004). Procrustes analyses places all recorded landmarks from two faces into one configuration to highlight changes in the landmarks as a result of growth or clinical intervention. Generalized Procrustes superimposition uses a groupwise method of registration for many faces. The process seeks the best fit of all landmarks relative to the centroid, which may not relate to an anatomical structure that moves least. Therefore, changes will be seen relative to an arbitrary point (centroid) as opposed to a defined structure.
The 3-D imaging capture techniques such as soft tissue surface scanning, cone beam computerized tomography (CBCT), and magnetic resonance imaging (MRI) have the potential to overcome some of the drawbacks of 2-D landmark and structure registration (Richmond, Toma & Zhurov 2009, Kau & Richmond 2010). The techniques of 3-D radiographic imaging techniques are often restricted to major craniofacial anomalies due to the risks associated with radiation exposure. However, magnetic resonance imaging is noninvasive and may be seen as an alternative approach to the capture of anatomical structures. It has been used to assess dimensional vector changes in test and control groups based on 3-D registration on skeletal structures (Cevidanes et al. 2005a, 2005b). However, the size of the apparatus, duration of MRI image capture, and its expense is likely to restrict its use.
The face is categorized according to the horizontal, vertical, and transverse planes defining the face as long, average, short and wide, and average and narrow. Although these are useful overall classifications, they do not incorporate the detail of other facial features such as chin, lips, cheeks, nose, and eyes. In an era of determining a biological basis for morphological features, it is possible to determine genotype-phenotype relationships through genomewide association studies (Allanson et al. 2009; Hall et al. 2009; Hennekam et al. 2009). These studies have been useful in identifying genes associated with cleft lip (Grant et al. 2009), and there are several studies in progress to identify genes that may influence specific facial features.
There has been considerable advancement in evaluating change in facial landmarks using 3-D imaging, and this provides the opportunity in classifying and characterizing detailed facial morphology. The surface detail captured using laser or photogrammetric methods are far superior to that obtained from photographs and radiographic methods in terms of dimensional accuracy and surface image resolution. As in any assessment of change or comparison, the superimposition of sequential facial images is challenging; however, the general principles should be adhered to, that is, alignment on reproducible planes and center on landmarks and structures that move least.
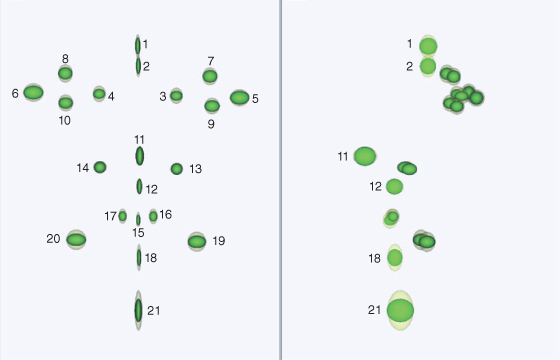
Twenty-one landmarks are shown (Figure 13.1). These landmarks can be used for groupwise Procrustes registration, and if needed certain landmarks can be weighted accordingly to reflect structures that move least. The variation for 21 landmarks for a sample of 350 children aged 15 years is shown using ellipsoids (Figure 13.2). Each ellipsoid represents 2 standard deviations from the mean (95% of the variation). The yellow ellipsoids represent unscaled data and green the scaled data. The scaled data eliminates size, and as a consequence the degree of variation is considerably reduced, particularly in the vertical dimension for landmarks pogonion (21), labiale inferius (18), Nasion and glabella (1) (Richmond, Toma & Zhurov 2009, Kau & Richmond 2010). Assessing both size and shape may be of use in scrutinizing the change resulting from growth and clinical interventions.
Figure 13.1 Twenty-one facial landmarks identified to assess change.
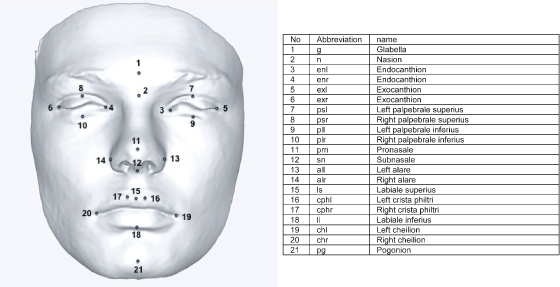
Figure 13.2 The variation of 21 facial landmarks for 350 fifteen-year-old boys and girls. Yellow ellipsoids represent unscaled and green ellipsoids scaled facial landmarks. The data was aligned on the landmarks centroid.
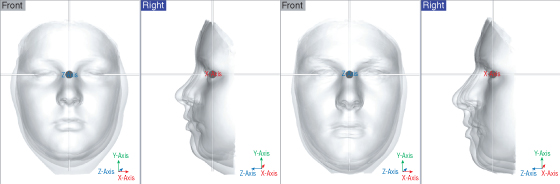
The change in the 21 facial landmarks in a cohort of Cardiff children was followed from the age of 12 to 16 years of age (23 females and 26 males). The data was scaled and aligned to the respective planes, the origin being the mid-intercanthal point (this point moves least during the growth period) (Figure 13.3). To differentiate between males and females and age groups the ellipsoids have been assigned different colors. For the female facial landmarks, the front and profile views at 12 years old are shown in red and at 16 years of age, yellow. For the male facial landmarks, the front and profile views at 12 years old are shown in green and at 16 years old, blue. The combined superimposition highlights the relative change in landmarks for sex and ages (based on the mid-intercanthal point as the origin). There is greater variability in the pogonion, surprisingly more so in girls compared to boys at both 12 and 16 years of age. There is an increase in forward projection, width, and height in the male face compared to the female face at both 12 and 16 years of age.
Figure 13.3 Variation in facial landmarks for a cohort of 23 girls and 26 males 12 and 16 years of age. The small red dot indicates the mid-endocanthion point. Courtesy of Cardiff University. (A) Female facial landmarks (front and profile view 12 years old, red; 16 years old, yellow). (B) Male facial landmarks (front and profile view 12 years old, green; 16 years old, blue). (C) Female and male facial landmarks for 12 and 16 years of age superimposed on a standardized 3-D coordinate system.
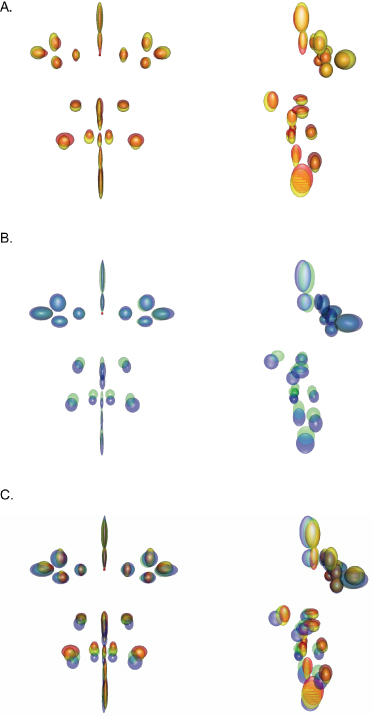
There is greater downward and forward growth in males compared to females. This illustration of sex differences between males and females suggests that male and female data should be assessed separately. Any claims of an effect of an intervention compared with a control group should demonstrate statistically significant differences from normal variation.
So far we have seen the variation in 21 landmarks, and the face exhibits a wide variation in facial morphology; and most 3-D imaging systems capture at least 40,000 points on the facial surface, and facial topography may be more meaningful in terms of facial appearance. We have already seen the benefits of scaling using landmarks, but the importance is emphasized using the whole face. Any group studied will show variation. Acknowledging and managing this variation is important. In a sample of 20 children aged 7 years, there is considerable facial variation highlighted by the facial shells at the extremes (Figure 13.4). When the facial extremes are aligned, the lower lip of the shorter face coincides with the upper lip of the upper face. To reduce this effect of “misalignment” of facial features the faces should be scaled to the mean: the long face scaled down and the small face scaled up. If this is undertaken for all 20 faces, then a more representative average is created preserving the location and morphology of discrete facial features such as the lips. The resulting scaled average is much sharper (greater representation of morphological features, particularly the lower part of the face) than the unscaled average (Zhurov et al. 2010). These techniques provide a visual display of facial variation that should enhance traditional statistical group comparisons. If all study groups were aligned to a common reference framework, then it would be easier to combine, visualize, and evaluate multicenter studies.
Figure 13.4 The different face sizes in a sample of 20 male children will affect the average facial shape derived (bottom left). Scaling the face will preserve the spatial morphological features resulting in a better representation of the average male face for a 7-year-old child (bottom right).
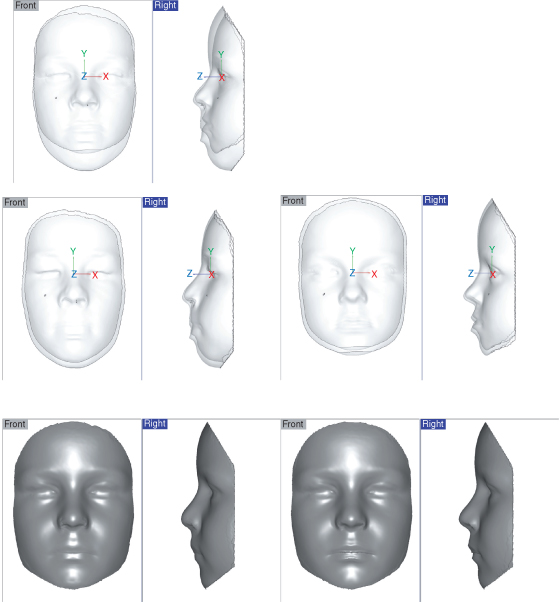
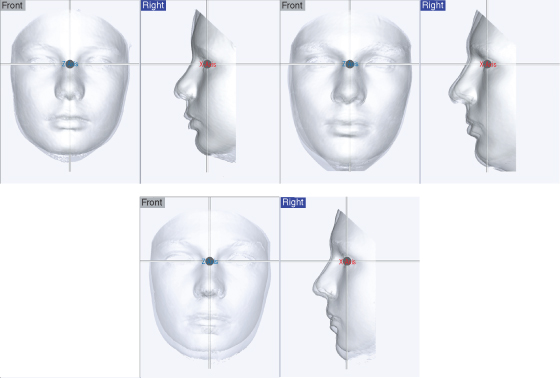
These techniques can be extended to look at groups of individuals. If six male 12-year-old children with differing facial morphologies from the Cardiff cohort are selected and their facial shells are aligned to the mid-sagittal plane, mid-intercanthal point, and average natural head posture at 12 years old, we can see that there is significant facial variation in the middle and lower parts of the faces in both the x–y (frontal) and y–z (mid-sagittal) planes. This variation persists until 17 years of age. The individual facial morphologies remain distinct even though they have increased in size over the 5-year period (Figure 13.5).
Figure 13.5 Superimposition of six faces on a standardized framework (mid-endocanthion as origin) for the ages of 12 (left) and 17 (right) showing significant facial variation and forward projection of the face.
The six faces represent different facial morphologies and are of different sizes. It has been reported that similar facial morphologies may grow in a similar way (Richmond, Toma & Zhurov 2009). Four male subjects with similar facial morphologies were identified from the Cardiff cohort study. The facial shells were registered. The facial shells at 16 years of age were superimposed independently of each other on their respective facial shells at 12 years old. The profiles of the faces show similar outlines at 12 and 16 years of age (Figure 13.6). The average faces at 12 and 16 years of age show essentially an increase in lower face height. The facial variation in this group of four children with matched lower facial morphology is considerably less that the six faces shown in Figure 13.5.
Figure 13.6 Similar growth patterns for similar facial morphologies for four males at ages 12 (top left) and 16 (top right). The average face for the four males at 12 and 16 years of age is shown (bottom).
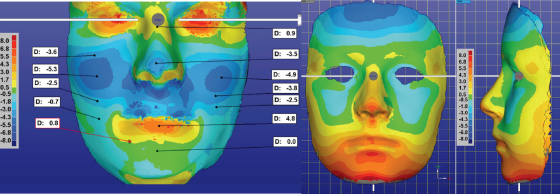
The assessment of outcome with regard to the facial surface can be analyzed by superimposing images from two or more sessions and assessing the deviation using color maps. This is best illustrated using a patient prior to and after orthognathic surgery and mapping the average growth of the face for boys aged 12 and 17 years of age (Figure 13.7). The color maps provide surface detail of the positive and negative changes.
Figure 13.7 The color map shows the changes in the face as a result of a LeFort 1 osteotomy moving the maxilla forward 5 mm (left) and average growth of the face for boys from 12 to 17 years of age (right). The warm colors represent positive changes and the cold colors negative changes. The color scales are shown.
New 3-D imaging techniques have the opportunity to complement traditional radiographic outcome assessments. Further research is required to monitor growth in large populations to determine growth patterns for specific facial morphological features and dental characteristics based on a standardized reference framework.
The Alignment and Fit of Teeth
The simplest method to assess the alignment and fit of teeth would be by visual inspection and evaluating whether a dentition needs treatment or, when treatment has been completed, that the alignment and fit of the teeth is acceptable. Unfortunately, due to the many facets of any orthodontic assessment (e.g., the initial severity and complexity of the alignment and fit of the teeth) and lack of judging criteria, there are significant inconsistencies in the opinions of clinicians in their assessments. Practitioner variation was highlighted in the largest international study undertaken to assess orthodontic treatment need and outcome. To assess treatment need 220 dental casts were judged by 97 orthodontists in nine countries. The proportion of cases that were recommended for treatment ranged from 58% to 92% of the sample (Richmond & Daniels 1998a, 1998b). There was considerable variation not only between countries (58%–92%) but also between orthodontists in the same country (8%–15%). Generally, the least proportion of cases recommended for treatment by orthodontists was in the Netherlands (mean 62%) and the greatest proportion recommended was in the United States (mean 88%). Orthodontists in the United States exhibited the least variation (Figure 13.8).
Figure 13.8 Variation of orthodontic practitioners in recommending orthodontic treatment (left) and determining acceptability of the outcome of orthodontic treatment (right).
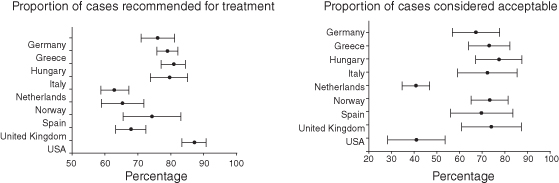
Surprisingly, even greater variation was seen in the assessment of treatment outcome acceptability where the same 97 orthodontists from nine countries made judgments based on 98 sets of start and finish dental casts. The proportion of casts deemed acceptable ranged from 28% in the United States to 90% in Hungary. There is also considerable variation (15%–30%) within countries. The threshold of acceptability was influenced by the payment/remuneration system; the orthodontists working within the state-controlled payment schemes accepted the highest proportion of cases, followed by private contractors, insurance operators, and least-salaried employees. Interestingly, the more experienced the orthodontist the greater the likelihood that the outcome would be considered acceptable. Inconsistencies in the assessment of orthodontic treatment need and acceptability can affect the credibility of the profession, and it would seem appropriate to ensure uniformity by using internationally accepted objective measures to assess outcome. In addition, a reliable and valid measure of orthodontic treatment need and outcome is essential if researchers wish to evaluate one treatment intervention against another.
The same objective assessment should be employed prior to the start of treatment and at any subsequent occasion, for example during the treatment process, completion of the intervention, short-term follow-up (e.g., 1 year), and long-term follow-up (e.g., greater than 5 years) to facilitate an objective assessment.
Before applying any assessment of treatment need/outcome it is important that it follows the appropriate prerequisites (Table 13.1).
Table 13.1 Prerequisites for an objective assessment.
| Clinically valid | The extent to which an assessment measures what it is supposed to measure. |
| Reliable | Concerned with error measurement (random and systematic). |
| Objective | Resistant to personal idiosyncrasy |
| Quick, easy, and meaningful | Should not be complex and time-consuming because no one will use it. The intention of assessment must reflect an objective or outcome. |
| Sensitivity and specificity | Differentiates between various aspects of a measure. The measure should be sensitive to identify and reject issues when they occur or do not occur. |
| Acceptable to public, profession, and health management organizations | Different specific measures may be of use for different aspects of he/> |
Stay updated, free dental videos. Join our Telegram channel
VIDEdental - Online dental courses


