13
Characterization of the Upper Airway Morphology and Its Changes in the Apneic Patient Using Cone Beam Computed Tomography
Introduction
The term “airway” refers to the air’s path from the nose or mouth to the alveoli of the lungs, the conduit for which includes the nose, mouth, trachea, pharynx, bronchi, bronchioles, and lungs. The “upper” airway, which is the most frequently analyzed portion in orthodontics and oral maxillofacial surgery, is divided anatomically into three sections: the area from the nasal turbinate to the hard palate, called the nasopharyix; the retropalatal and retroglottal regions, known as the oropharynx; and the hypopharynx, which is contained between the tongue’s base and the larynx (Schwab, 1998).
Since their discovery in the 1890s, X-rays have been utilized in many medical and dental disciplines for a wide variety of reasons. Since then, technological advances have resulted in an evolution of radiographic and nonradiographic methods for the diagnosis of airway diseases and malfunctions. Diagnostic imaging in orthodontics began in the late 1920s and early 1930s with the invention and widespread use of cephalometry (Broadbent, 1931). The “new technology of cephalometrics” adopted many of the direct anthropometric caliper-based measures performed on cadaveric skulls to radiographic projections of living patients that were obtained under standardized conditions of the lateral and frontal views. Since the end of World War II, cephalometrics has been applied widely and consistently to orthodontic diagnosis and has remained the gold standard for orthodontic imaging (Keim, 2009). Multiple angular and linear measurements are recorded and evaluated routinely for orthodontic diagnosis, treatment planning, assessment of treatment progress, and research purposes (Al-Balkhi, 2003). Although cephalometric images can be obtained in the posterior-anterior (PA) view, the lateral cephalometric view is the more common imaging method used for analyzing craniofacial and airway structures (White & Pae, 2009).
Cephalometric analysis has many limitations: perfect superimposition of bilateral structures is impossible to achieve, which, in turn, reduces the accuracy and validity of these films; magnification, distortion, and patient positioning errors limit traditional analysis (Quintero et al., 1999); and airway analysis can be performed only in the antero-posterior but not in the lateral dimension (Ciscar et al., 2001; Kim et al., 2008). Due to the latter limitation, most cephalometric airway studies examine the hard and soft tissues surrounding the airway, rather than the airway space directly. The reproducibility of airway dimensions and tongue and hyoid positions on lateral cephalometric radiographs has proven to be unreliable (Malkoc et al., 2005). These limitations have spurred the desire to create new imaging tools that represent the patient’s airway anatomy more accurately and in a true three-dimensional (3D) manner.
The purpose of this chapter is to summarize several of the historical methods used to describe the airway, to discuss the limitations of these earlier methods, and to examine how new noninvasive low radiation dose and true 3D images enable the practitioner to better understand airway size, shape, and volume. Several initial investigations that have used this new technology to study the potential effects of clinical interventions on airway dimensional changes also are described.
Technological Evolutions in Airway Assessments and Analyses
In an attempt to overcome the deficiencies of assessing the airway on cephalograms, other nonradiographic methods of measuring upper airway including rhinometry, acoustic reflection, and magnetic resonance imaging (MRI) have been utilized. A rhinomanometer uses pressure transducers and miniaturized technology to provide data on both the nasal airflow and nasal pressures. Using this technology, researchers who have sought to identify whether there is any relationship between malocclusion and upper airway inadequacy have failed to demonstrate any such association (Solow et al., 1984). With the failure of rhinometry to identify an association between compromised airway and malocclusion, investigators again turned to utilizing cephalometrics for studying the airway. A classic primate study performed to examine the effects of obligate mouth breathing induced by creating a nasal obstruction in primates showed inconsistent responses with the experimental animals, demonstrating variable adaptations and no direct correlation between oral or nasal respiration and type of malocclusion (Harvold et al., 1981). This finding has held true for orthodontic patient populations as well. Thus, while practitioners may suspect oral breathing in some facial types such as long faces, vertical maxillary excess, and adenoid faces, the mode of respiration has not been correlated consistently and definitively to facial morphology (Kluemper et al., 1995).
Acoustic reflection, which combines a rhinomanometer for nasal airway and a pharyngometer for upper airway patency determinations, is another nonradiographic method for assessing airway. The two are connected to a monitor that shows both the cross-sectional areas and volumetric data at different sites throughout the airway (El & Palomo, 2011). This method was popular due to the lack of radiation exposure and relative ease of use and is the only method used in multiple studies that have examined the airway of normal, healthy individuals (Brown et al., 1986; Brooks & Strohl, 1992; Martin et al., 2006). Martin and colleagues’ study (1997) examined the effect of age, sex, obesity, and posture on upper airway size in both the upright and supine positions. It concluded that the upper airway decreases in size with increasing age in both men and women and that men have greater airway collapsibility in the supine position than women. While men may have a larger airway (Brooks & Strohl, 1992), this increased susceptibility to airway collapse may explain some of the differences in incidence of obstructive sleep apnea (OSA) between the two sexes. Additional studies show a negative correlation of pharyngeal airway cross-section with age in males and no differences between men and women when accounting for body size (Brown et al., 1986).
Prior to the advent of cone beam computed tomography (CBCT), MRI and computed tomography (CT) were the only 3D imaging tools available. CT, which first emerged in the 1970s, transformed diagnostic radiology but subjected the patients to high radiation exposure levels (Brenner & Hall, 2007). Unfortunately, conventional CT scanners also are large and expensive and have limited resolution in the vertical plane of space (Maki et al., 2003). Since CTs typically are available primarily in hospitals or imaging centers, they are not suitable for routine orthodontic records or airway surveys.
MRI creates both static and dynamic 3D images by using a magnetic field to manipulate hydrogen ions that are present in large quantities in the human body (Patel et al., 2006). Some benefits of MRI include its capacity to convey high tissue contrast and accurate pictures, 3D flexibility, noninvasiveness, and the high sensitivity and specificity of the generated images, especially for soft tissues. An updated approach called volumetric MRI is capable not only of generating 3D images, but also of obtaining the volume of organs or systems. This approach has been demonstrated to be beneficial for the quantitative determination of certain airway risk factors (Schwab et al., 2003). MRI also has some weaknesses, including the scatter produced by metal orthodontic appliances and isolated reports of significant complications such as injury from dislodgement of ferromagnetic materials as well as induced electrical currents and excessive heating (Patel et al., 2006); however, methods for safe imaging have been described (Klocke et al., 2005, 2006).
CBCT scanners enable a single rotation of the unit to generate a scan of the entire head and have significantly lower radiation levels relative to multi-slice CTs (MSCT) that make CBCT a practical choice for dentistry (Maki et al., 2003; see also Chapter 2). By producing sagittal, axial, and coronal images, CBCT provides true 3D anatomically accurate views that are not attainable in traditional two-dimensional (2D) planar radiologic imaging. Using both proprietary and open-source software, the images can be viewed in any possible orientation. As discussed in several chapters of this book, images generated from these views already have proven to be useful in diagnosis and treatment planning of impacted teeth, surgical orthodontic care and temporomandibular joint (TMJ) pathology (Kapila et al., 2011), planning of dental implants, pathological lesion identification, supernumerary teeth location, mixed dentition planning, and airway analysis (Kau et al., 2005).
The limitations of cephalometry in the analyses of airway include the inherent errors in representing a 3D structure in 2D and lack of ability to provide information on cross-sectional area and volume. This has been validated further in the study by Lenza and associates (2010), who concluded that the morphology of the upper airway cannot be depicted accurately using sagittal or transversal linear measurements because these variables have a poor correlation with airway cross-sectional area and volume in CBCTs, findings that are verified further by ours, described below. Moreover, calculating upper airway volume alone does not give accurate information with respect to the most constricted cross-sectional area. Therefore, a complete analysis with linear measurements, area, and volume likely is necessary to assess the complex 3D structure of the upper airway correctly.
Prior to adapting a new technology such as CBCT to examine the airway, its measurement accuracy and reliability must be validated. Both linear and angular measurements from CBCTs have been shown to be highly accurate with a measurement accuracy of up to 0.1 mm, which is insignificant clinically (Lagravère et al., 2008). Furthermore, analysis of the airway using an airway phantom has demonstrated excellent accuracy and reliability of CBCTs in airway area and volume measurements (Aboudara et al., 2009; Schendel & Hatcher, 2010).
A second requirement for application of CBCT imaging to assess airways is establishing normative data on airway dimensions that would be highly valuable to serve as guidelines for diagnostics or therapeutics for airway disorders. Due to the relative inaccessibility of 3D images of the normal adult airway, there currently are no published norms for its dimensions and volume (Osorio et al., 2008). However, because CBCT scans increasingly are being used to evaluate otherwise healthy individuals for various dental treatments, the availability of these scans will enable the determination of population normative values for the airway volume and cross-sectional areas. Thus, the application of CBCT in dental practices and the pooling of these resources likely will provide a good source of data to further our knowledge and to establish and refine normative values for the airways.
Relevance of the Airway to Orthodontics
Relationship of Airway to Skeletal Morphology
The upper airway is surrounded, shaped, and supported by soft tissue and skeletal structures. The soft tissue structures that encompass the upper airway are the nasopharynx superiorly, the maxilla-mandibular complex and the posterior part of the soft palate anteriorly, the spinal column posteriorly, and the epiglottis inferiorly. The skeletal structures that delimit the upper airway include the cranial base superiorly, the vertebral column posteriorly, the nasal septum antero-superiorly, and the posterior aspect of the maxilla and mandible as well as the hyoid bone that partially embraces the oropharynx anteriorly. Therefore, it seems logical that the skeletal patterns should have a role in determining the morphology of the upper airway and vice versa (Solow & Kreiborg, 1977; Harvold et al., 1981; Vig, 1998).
In an attempt to solve part of the controversy on any relationship between 2D and 3D airway dimensions as well as between upper airway morphology and craniofacial parameters, 30 CBCT scans of 14- to 35-year-old non-apneic subjects equally divided between Class I, II, and III were analyzed. An analysis was developed utilizing 41 cephalometric landmarks to describe maxillo-mandibular relationships and airway dimensions. The upper airway morphology was assessed by linear, surface, and volume measurements using a previously described procedure (Lenza et al., 2010). Six sagittal linear measurements as described previously (Linder-Aronson, 1970; Holmberg & Linder-Aronson, 1979) and paired transverse (coronal) dimensions of the upper airway were determined (Figure 13.1A). To calculate the cross-sectional areas, total airway volume, and partial airway volumes, the upper airway was segmented from the CBCT using a semi-manual segmentation, as it has been shown to be more accurate and minimizes the systematic errors in “automated” volume segmentation (El & Palomo, 2010). The airway boundary and partial segmentations were divided into five partial volumes (Figure 13.1B) delineated by the six sagittal cross-sections described above (Figure 13.1A).
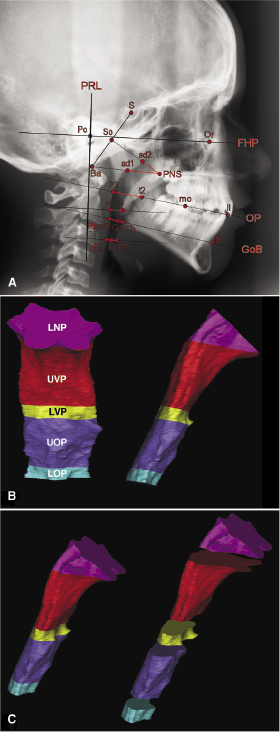
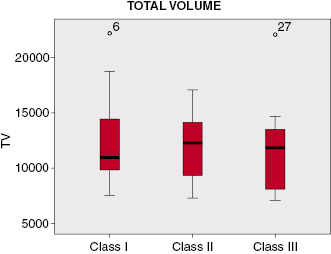
Overall, the 2D sagittal and transverse dimensions were not correlated consistently with the cross-sectional areas of the airway at the six sites measured. The 2D sagittal measurements correlated with the 3D cross-section area only for the two most superior portions of the airway in the area of the nasopharynx. Although the linear transverse measurements at the level of upper velopharynx (UVP), lower velopharynx (LVP), upper oropharynx (UOP), and lower oropharynx (LOP) are fairly reliable, good correlation between sagittal and transverse measurements and the corresponding partial volumes exist only for the lower nasopharynx (LNP). Only a weak correlation between the minimum sagittal linear airway distance and the minimum cross-sectional area of the upper airway was found. This suggests that use of the antero-posterior (AP) linear dimensions alone is insufficient to predict the minimum cross-sectional area accurately. Neither the minimum cross-section nor the total volume of the upper airway correlated with Class I, II, or III skeletal pattern, a finding that may be attributable to the large variation in morphology of the airway (Figure 13.2). For this reason, a series of indices that describe the craniofacial proportions was made to scale the measured airway volume of each subject to the craniofacial proportions and dimensions of the average subject. This adjustment resulted in slight improvement in the correlation between cross-sectional area, airway volume, and skeletal patterns, but still failed to reach statistical significance. The results strongly suggest that the craniofacial pattern on its own is insufficient to describe the morphology of the upper airway and that more sophisticated indices, possibly including other variables such as body mass index (BMI), height, and posture, may be necessary for better understanding the determinants of airway dimensions.
Effects of Rapid Palatal Expansion (RPE) on Airway
Because rapid palatal expansion (RPE) increases palatal width and has been advocated by some clinicians for alleviating OSA, the next logical question to address is whether this treatment modality has any effect on nasal cavity size, airway dimensions, and airway resistance. A study of 38 subjects (Oliviera De Felippe et al., 2008) using 3D imaging and acoustic rhinometry demonstrated a mean short-term reduction in nasal airway resistance concomitant with a mean increase in palatal area, volume, and intermolar distance. In the long term, the mean palatal area and intermolar distances regressed toward pre-treatment values, but the nasal cavity volume and minimal cross-sectional airway increased. It is unclear why the nasal cavity dimensions continued to increase even though the palatal and molar dimensions reverted to pre-treatment levels. However, it is plausible that since the studies were performed in growing patients, the airway increases reflect growth of the nasal cavity, while the decreases in palatal and intermolar dimensions reflect post-expansion relapse. It also is possible that environmental factors such as allergens, allergic rhinitis, or seasonal viruses may have been more prevalent at pre-treatment, leading to an artificially reduced nasal volume. Clearly, additional work remains to be performed to address further the relationship, if any, between RPE and changes in nasal airway dimensions and into its possible therapeutic efficacy in OSA.
Airway Parameters in Healthy and Apneic Subjects
Obstructive Sleep Apnea (OSA)
OSA is one of the most widely studied airway diseases. Individuals with OSA experience recurrent collapse of the airway most often during sleep (Ogawa et al., 2007). An apnea is defined as a breathing cessation of greater than 10 seconds; a hypopnea is a 50% breathing reduction or a significant drop in O2 saturation (Ingman et al., 2004). The clinical signs of OSA include morning headaches, sleepiness during daytime, impotence, lowered libido, mood swings, impaired memory and concentration, intensive snoring, and depression. Patients afflicted with OSA have a high risk of developing coronary artery stenosis, hypertension, and ischemic stroke due to frequent breathing cessation (Ingman et al., 2004).
OSA is much more common in males than in females (Bixler et al., 2001). One theory for this sex difference is that males and females have structurally and functionally different upper airways (Mohsenin, 2001). Another theory is that hormonal differences between men and women could influence the airway. This theory is supported by multiple studies that have demonstrated that post-menopausal women on hormone replacement therapy (HRT) have decreased risk of OSA compared with post-menopausal women not on HRT (Bixler et al., 2001; Kapsimalis & Kryger, 2002). Since obesity is a significant risk factor for OSA (Guilleminault et al., 1988) and animal studies show that ovariectomized rats in the absence of estrogen replacement gain weight (Zoth et al., 2012), the higher risk of OSA in women not on HRT may result due to their greater potential for developing obesity than women undergoing HRT. While studies have been unable to pinpoint the factors contributing to these sex differences for OSA, they nevertheless indicate that these likely arise from variables other than age, BMI, or neck circumference (Dancey et al., 2003).
Although medical and dental practitioners have attempted to describe changes in the airway associated with OSA for decades (Guilleminault et al., 1976; Lowe et al., 1995), research data and opinions continue to vary widely. Furthermore, there currently are inadequate data available to help distinguish normal from abnormal anatomical airway characteristics. One common etiology of this condition is obstruction or occlusion of the upper airway (Ogawa et al., 2007). The fact that this compromised airway patency, as one etiologic factor of OSA, can be treated through orthodontics/orthognathic surgery, together with its high morbidity and mortality, have contributed to substantial interest in this disease among orthodontists and oral and maxillofacial surgeons in OSA (Ingman et al., 2004).
Normal Adult Airway
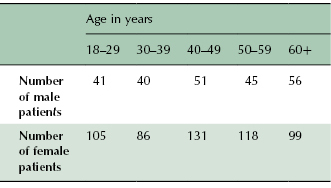
To begin to address whether the airway dimension may be altered locally, regionally, or in its entirety, it is important to establish normative data, preferably that are age- and sex-specific. Toward this goal, a recent cross-sectional retrospective investigation determined airway dimensions of 539 females and 233 males aged between 18 and 69 years that provided an adequate sample size when divided by sex and by decade of life (Table 13.1; Smith et al., 2009). These adult patients had undergone CBCT for either pre-prosthetic purposes, orthodontics, or occasionally to rule out TMJ pathology. Also, routine cephalometric projections of this sample demonstrated that both the males and females represented well-balanced profiles.
Table 13.1 Sample size by sex and age of subjects used to determine normal airway dimensions.
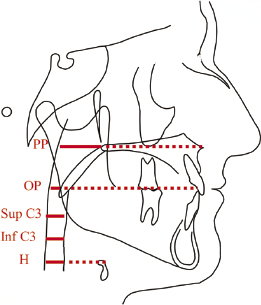
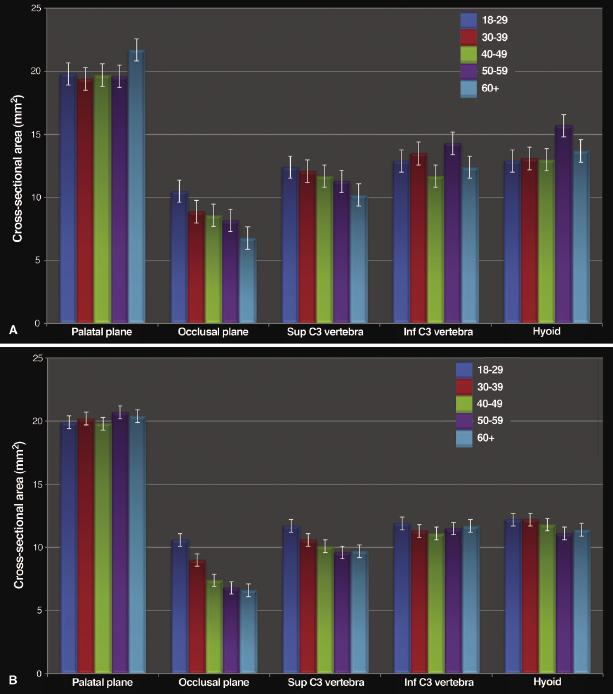
The cross-sectional airway areas were measured at five sites within the pharyngeal airway from posterior nasal spine superiorly to the epiglottis inferiorly (Figure 13.3). The findings showed that while males had slightly larger airway cross-sections than females in the lower pharynx, these differences were minor and not significant statistically (Figure 13.4). The male airway was longer and of a larger volume than the female airway. Few to no age-related changes were observed in airway cross-section at the palatal plane, inferior aspect of C3, and at the hyoid in both males and females. However, there were strong and consistent trends toward decreased airway cross-sections with age at the occlusal plane and superior aspect of C3, in both male and female subjects that, at the occlusal plane, was more marked for females than males. One interesting finding was the location of the minimum airway cross-section that moved more inferiorly in males than in females with age. The possible ramifications of this finding will be discussed in context of the abnormal airway, particularly in the OSA patient, later in this chapter.
This investigation provides valuable new data for age-related norms for the airway. Much like orthodontic cephalometric norms, these 2D and 3D airway normative values potentially can be used as an aid when examining patients with pathologic airway, such as those with OSA. While these normal airway values are important, studies correlating airway data with that from overnight polysomnography (PSG) are required to validate the sensitivity and specificity of CBCT airway imaging in the diagnosis of OSA and support relevance of these norms for diagnostic purposes. />
Stay updated, free dental videos. Join our Telegram channel
VIDEdental - Online dental courses


