Fluids and Minerals Required for Oral Soft Tissues and Salivary Glands
• Describe the process of osmosis.
• Explain how electrolytes affect hydration status.
• List normal fluid requirements and identify factors that may affect these requirements.
• Discuss the roles, imbalances, and sources of water, sodium, potassium, iron, zinc, and iodine.
• Discuss with patients how to decrease dietary sources of sodium and increase potassium intake and state why these are important.
• Identify oral signs and symptoms of fluid and electrolyte imbalances.
• Discuss areas of nutritional concern with patients who have fluid and electrolyte imbalances.
• Determine which diseases and medications may require patients to restrict sodium intake.
• Identify the most prominent oral symptoms or signs of iron, zinc, and iodine deficiency.
Water and several mineral elements are essential for maintenance of healthy oral tissues, including tooth enamel. Visual signs of these nutrient deficiencies in the gingiva, mucous membranes, and salivary glands are less obvious than signs observed with the B-vitamin complex and vitamin C deficiencies discussed in Chapters 9 and 11. Nevertheless, water and several minerals have a significant effect on integrity of the oral cavity and, ultimately, nutritional status. Oral problems associated with hyper states or hypo states of the minerals discussed in this chapter are slow to develop and may not be critical immediately. Chronically decreased salivary flow attributable to inadequate body fluids may lead to rampant tooth decay and eventually loss of teeth.
Fluids
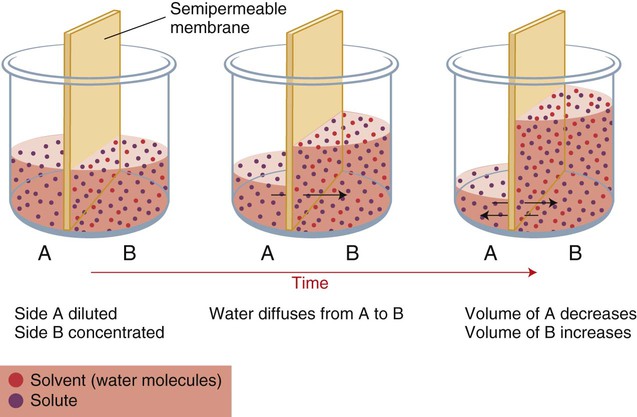
When two compartments are separated by semipermeable membranes, and the movement of some solutes is restricted, osmosis occurs. Osmosis is the movement of water from an area of lower solute concentration to one of a higher solute concentration. Osmotic pressure within the body equalizes the solute concentration of ICFs and ECFs by shifting small amounts of water in the direction of higher concentration of solute, as shown in Chapter 3, Figure 3-6.
Requirements and Regulation
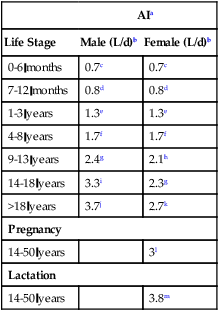
Water requirements are based on experimentally-derived intake levels that are expected to meet nutritional needs of a healthy population. To maintain normal hydration, the Institute of Medicine (IOM) established an adequate intake (AI) for total fluid (beverages, water, and food). As shown in Table 12-1, men require 3.7 L/day (15 to 16 cups), and women require 2.7 L/day (11 to 12 cups). No tolerable upper intake level (UL) is established for water.
Table 12-1
Institute of Medicine recommendations for water
| AIa | ||
| Life Stage | Male (L/d)b | Female (L/d)b |
| 0-6 months | 0.7c | 0.7c |
| 7-12 months | 0.8d | 0.8d |
| 1-3 years | 1.3e | 1.3e |
| 4-8 years | 1.7f | 1.7f |
| 9-13 years | 2.4g | 2.1h |
| 14-18 years | 3.3i | 2.3g |
| >18 years | 3.7j | 2.7k |
| Pregnancy | ||
| 14-50 years | 3l | |
| Lactation | ||
| 14-50 years | 3.8m | |
aAI (adequate intake)—the observed average or experimentally set intake by a defined population or subgroup that seems to sustain a defined nutritional status, such as growth rate, normal circulating nutrient values, or other functional indicators of health. An AI is used if insufficient scientific evidence is available to derive an estimated average requirement. For healthy human milk–fed infants, the AI is the mean intake. The AI is not equivalent to a recommended dietary allowance.
cAssumed to be from human milk.
dAssumed to be from human milk, complementary foods, and beverages. This includes ∼0.6 L (∼3 cups) as total fluid, including formula or human milk, juices, and drinking water.
eTotal water. This includes ∼0.9 L (∼4 cups) as total beverages, including drinking water.
fTotal water. This includes ∼1.7 L (∼5 cups) as total beverages, including drinking water.
gTotal water. This includes ∼1.8 L (∼8 cups) as total beverages, including drinking water.
hTotal water. This includes ∼1.6 L (∼7 cups) as total beverages, including drinking water.
iTotal water. This includes ∼2.6 L (∼11 cups) as total beverages, including drinking water.
jTotal water. This includes ∼3 L (∼13 cups) as total beverages, including drinking water.
kTotal water. This includes ∼2.7 L (∼9 cups) as total beverages, including drinking water.
lTotal water. This includes ∼3 L (∼10 cups) as total beverages, including drinking water.
mTotal water. This includes ∼3.1 L (∼13 cups) as total beverages, including drinking water.
Data from Institute of Medicine (IOM), Food and Nutrition Board: Dietary reference intakes for water, potassium, sodium, chloride, chloride, and sulfate, Washington, DC, 2005, National Academies Press.
Overconsumption and underconsumption of fluids can occur over short periods. However, if adequate amounts of fluids are available, consumption matches physiological needs over an extended period. Loss of 1% of body water is usually compensated within 24 hours.1 Individuals who consume a high-protein or high-fiber diet, have diarrhea or vomiting, or are physically active or exposed to warm or hot weather, require more fluids.
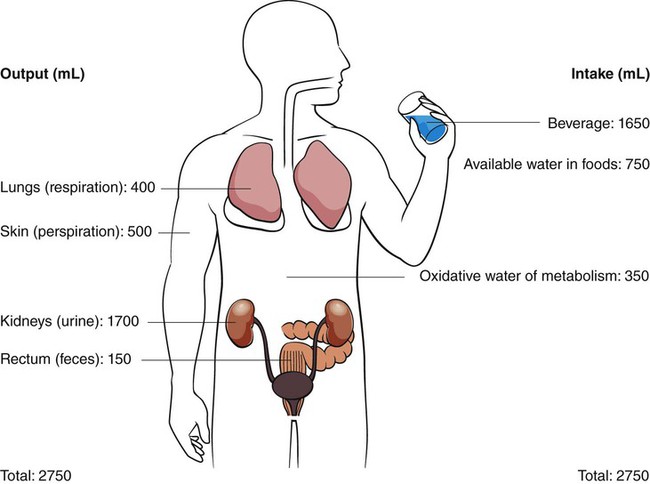
Normal fluid requirements (Fig. 12-1) can be drastically changed in different climatic environments, with various exercise levels, diet, and social activities, and with illnesses resulting in (or are accompanied by) diarrhea or vomiting. The body cannot store water, so the amount lost must be replaced.
In healthy adults, thirst is an early sign of the body’s need for fluids, but is often mistaken for hunger. The ability to regulate water balance is not as precise in infants and older adults. Older patients often have a reduced sensation of thirst. When 2% of body water is lost, osmoreceptors are stimulated, creating a physiological desire to ingest liquids. Osmoreceptors are neurons in the hypothalamus that are sensitive to changes in serum osmolality levels. Stimulation of osmoreceptors not only causes thirst, but also increases release of antidiuretic hormone (ADH) from the pituitary gland (Fig. 12-2). ADH causes the body to retain fluid by decreasing urinary output. Conversely, if there is too much water in the body, ADH secretion is inhibited, and excess water is eliminated.
Sources
Water
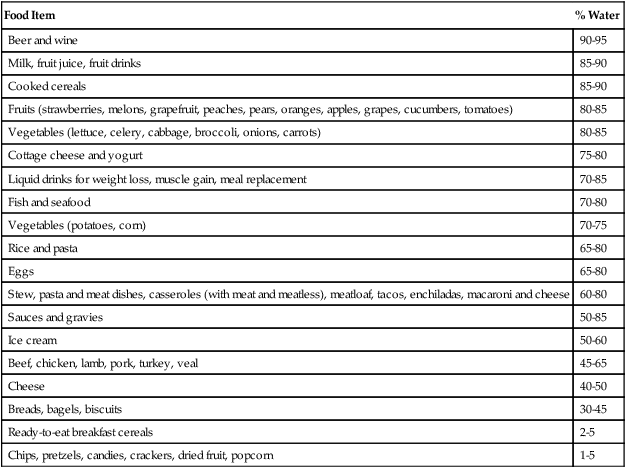
Water is the only liquid nutrient that is essential for body hydration. During the process of metabolism, liquids and solid foods provide water. Some fruits and vegetables have a higher percentage of water than does milk, and meats are more than half water (Table 12-2). Regardless of its source, fluids act the same physiologically. Water liberated in the process of metabolism is also available. Metabolism of fat produces approximately twice as much water as the metabolism of protein or carbohydrate; metabolism of these macronutrients supplies about 300 to 350 mL daily.
Table 12-2
| Food Item | % Water |
| Beer and wine | 90-95 |
| Milk, fruit juice, fruit drinks | 85-90 |
| Cooked cereals | 85-90 |
| Fruits (strawberries, melons, grapefruit, peaches, pears, oranges, apples, grapes, cucumbers, tomatoes) | 80-85 |
| Vegetables (lettuce, celery, cabbage, broccoli, onions, carrots) | 80-85 |
| Cottage cheese and yogurt | 75-80 |
| Liquid drinks for weight loss, muscle gain, meal replacement | 70-85 |
| Fish and seafood | 70-80 |
| Vegetables (potatoes, corn) | 70-75 |
| Rice and pasta | 65-80 |
| Eggs | 65-80 |
| Stew, pasta and meat dishes, casseroles (with meat and meatless), meatloaf, tacos, enchiladas, macaroni and cheese | 60-80 |
| Sauces and gravies | 50-85 |
| Ice cream | 50-60 |
| Beef, chicken, lamb, pork, turkey, veal | 45-65 |
| Cheese | 40-50 |
| Breads, bagels, biscuits | 30-45 |
| Ready-to-eat breakfast cereals | 2-5 |
| Chips, pretzels, candies, crackers, dried fruit, popcorn | 1-5 |
Adapted from Grandjean A, Campbell S: Hydration: fluids for life, Washington, DC, 2004, ILSI North America.
Because of mistrust of the water supply, and a desire for a safer and more convenient form of fluid intake, consumers frequently choose bottled water. The bottled water market has been increasing, with an annual per capita consumption of 11 gallons in 2011.2 However, as a result of environmental concerns (energy required to produce plastic nonbiodegradable plastic bottles, bisphenol A [BPA] content of bottles, cost of marketing and shipping bottles containing water), and the revelation that approximately 75% of reputable bottlers utilize groundwater (same source as the public water supply) or tap water, the rate of increase has declined.3
Bottled water is regulated by the U.S. Food and Drug Administration (FDA). Bottled waters come with many labels: drinking water, sparkling water, mineral water, Artesian water, and purified water (distilled, demineralized, deionized, and reverse osmosis). Bottled water also includes flavored waters and nutrient-added water beverages. In 2009, the FDA mandated that all manufacturers of bottled water test their water source for the presence of coliforms (a bacterial indicator of sanitation, universally present in the feces of animals) on a weekly basis. If further tests prove positive for Escherichia coli, companies must take measures to eliminate the bacteria and retest samples before use. The FDA also established the U.S. Environmental Protection Agency’s maximum levels for contaminants (except for a lower maximum amount of lead) and disinfection by-products (e.g., bromate, chlorite, etc.), and disinfectants (e.g., chlorine) in bottled water.4
Many of these flavored beverages contain additional kilocalories, which are consumed in excessive amounts by most Americans. Kilocalories in drinks are not hidden, and the body does not treat them differently from energy provided in foods. But kilocalories in beverages go down so smoothly, significant amounts can be consumed without realizing how much is being consumed. Studies have produced conflicting results as to whether or not people compensate for kilocaloric intake from sugar-sweetened beverages. Sugar-containing beverages are at least questionable for individuals needing to control their energy intake and weight.5,6
Water has been recommended for weight loss, despite the fact that fluids satisfy thirst and not hunger. Water consumed with a meal does not affect caloric consumption at mealtime, but water incorporated into food (as in soup) increases satiety, ultimately leading to less caloric intake. Basically, foods that incorporate water tend to appear larger; more volume provides greater oral stimulation; and water bound to food slows absorption and increases satiety.7
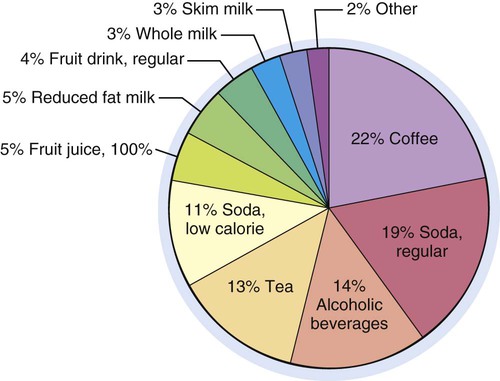
Although water is the only fluid truly needed by the body, many other liquids are acceptable, and some, such as low-fat milk, contribute significant amounts of important nutrients. Figure 12-3 depicts the beverage intake pattern of adults in the United States; beverages in these amounts and proportions represent almost 400 kcal daily. A recommended healthier intake would include at least 100 fl oz total intake with approximately 50% from water, approximately 16 oz of unsweetened tea or coffee, at least 8 oz low fat milk, approximately 24 oz of beverages with some kilocalories and nutrients (fruit juice), and approximately 12 oz of calorically sweetened and diet beverages.
Coffees and Teas
Although research has not yet produced definite answers, a growing body of research suggests that moderate coffee drinkers, compared to nondrinkers, are less likely to have type 2 diabetes;8 Parkinson and Alzheimer disease;9,10 dementia;11 certain cancers (liver and prostate);12 heart failure;13 arrhythmia problems;14 and strokes.15 However, coffee has not been shown to prevent these conditions. A large prospective study found an inverse relationship between coffee consumption and total and cause-specific mortality, but this study was unable to determine whether this was a causal or associative finding.16 Both regular and decaffeinated coffee contain acids that may aggravate heartburn. Because of the addition of caffeine to many new products, the U.S. FDA is investigating the safety of caffeine.
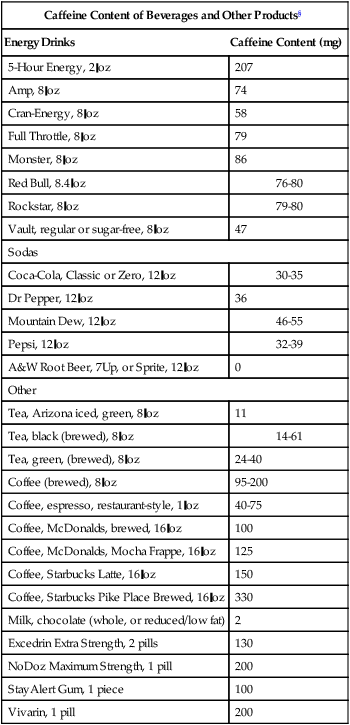
Polyphenols in tea appear to possess health benefits, specifically antioxidant and anti-inflammatory actions as key mechanisms in preventing certain types of cancer, CHD, and diabetes.17–19 Teas also contain multiple flavonoids and have virtually no kilocalories unless sugar or milk are added. It is fairly well established that flavonoids in tea have health benefits, and tea may be a better alternative beverage to coffee, partly because of its lower caffeine content (Box 12-1). Highly processed tea leaves provide less polyphenols or flavonoids: oolong and black teas are oxidized or fermented, resulting in lower concentrations of polyphenols than green tea. Green tea has been more widely studied than other teas.
All green, black, and white teas contain caffeine and theanine (an amino acid used to treat anxiety and high blood pressure and other things). These chemicals affect the brain and appear to heighten mental alertness.20,21 Limited studies support the theories that compounds in tea may help encourage weight loss,22 lower cholesterol, and improve resistance to infections.23 One drawback to tea consumption is its tannin content, which inhibits iron absorption, particularly when tea and iron are consumed at the same time.
Energy Drinks
Energy drinks were introduced in the United States in 1997. Sales of energy drinks and shots have more than doubled in the past 5 years; they are especially appealing to teenagers and young adults, especially young men. Sales in the United States increased to almost $9 billion in 2011.24 Energy drinks are marketed to provide a higher energy level, make a person feel more awake, and boost attention span.
Energy drinks contain ingredients that act as stimulants, such as caffeine, guarana (a seed containing four times as much caffeine as coffee beans), and taurine (an amino acid with antioxidant properties). Coffee-energy drinks blend coffee extract with milk, taurine, and ginseng (allegedly improves concentration and thinking, physical stamina, athletic endurance; causes abdominal pain and headaches). Energy shots (approximately 2 oz) contain the same stimulants as energy drinks but are more concentrated. Decaffeinated energy drinks have eliminated caffeine but are packed with B vitamins and quercetin (bioflavonoid reported to energize muscles). Whereas quercetin improved performance of mice on a treadmill, human studies failed to improve athletic performance.25 One popular liquid shot contains 8333% of the RDA for vitamin B12 and 2000% for vitamin B6, 150% for niacin, and 100% for folic acid.
Several of these energy drinks have been linked to unexpected deaths in apparently healthy adults and children, possibly leading to closer scrutiny and regulation by FDA. Energy drinks have contributed to increases in emergency department visits resulting from excessive caffeine intake especially when these drinks are combined with alcohol.26,27 Many in the medical community are concerned about potential negative problems associated with stimulants in beverages and lack of disclosure about the amount. Use of energy drinks may increase risk for caffeine overdose in caffeine abstainers, as well as habitual consumers of caffeinated coffee, soft drinks, and tea.
Sports Drinks
Most research on sports products has been conducted using highly trained endurance athletes who exercise at high intensity for long periods. Sports nutrition recommendations are sometimes extrapolated to recreational athletes who have very different reasons for exercising, and therefore different nutritional needs. Most endurance athletes can benefit from a sports beverage that contains carbohydrates and electrolytes, and sometimes protein, but for most people engaged in routine physical activity, sports drinks offer little to no advantage over plain water. Sports drinks can be helpful for young athletes engaged in prolonged, vigorous physical activities; they are probably unnecessary during school physical education or in the school lunchroom. Sports drinks containing 6% to 8% carbohydrate are recommended when exercise is longer than 1 hour. These drinks can easily meet carbohydrate and fluid needs as well as sodium and potassium lost in sweat.28
Scientific studies do not support claims about improved performance and recovery for many sports drinks and protein shakes. Rather, researchers feel that it is virtually impossible for the public to make informed choices about the benefits and harms of advertised sports products.29
Sodas
Beverages provide approximately 15% to 21% of Americans’ total daily kilocalories. Approximately 46% of 35- to 54-year olds say they drink at least one glass of soda daily as compared to 56% of 18- to 34-year olds reporting equivalent amounts.30 Approximately 20% of the U.S. population consumed diet sodas during 2009-2010.31 Soda consumption decreased among adolescents and young adults, whereas sports and energy drink consumption tripled among adolescents.32,33 Approximately half of the increase in energy intake occurring over the past 20 years is contributed to sweetened beverages. Most people are unaware of how many kilocalories are in the beverages they drink, but these kilocalories may be a major contributor to the alarming increase in obesity.
Dental Erosion
Most sports and energy drinks have a pH in the acidic range (pH 3 to 4) which is associated with enamel demineralization. The increase in use of sports and energy drinks by children and adolescents causes irreversible damage to teeth because high acidity levels (citric acid) in drinks erode tooth enamel. Damage to tooth enamel is evident after just 5 days of exposure to sports or energy drinks. Energy drinks cause twice as much damage to teeth as sports drinks.34 Calcium added to sports drinks lessens the erosive potential to teeth. Research suggests enamel erosion with various beverages occurs in the following order (from greatest to least): energy drinks, sports drinks, regular soda, and diet soda.35
Hyper States and Hypo States
Fluid Volume Excess
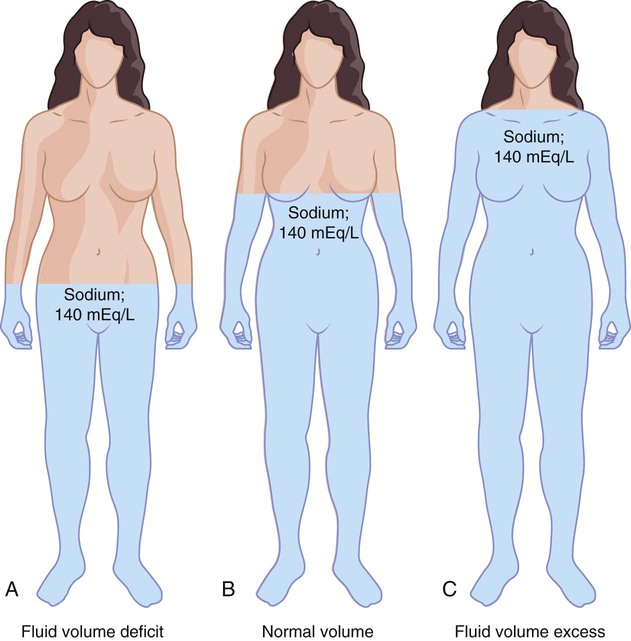
FVE mainly occurs in ECF compartments secondary to an increase in total body sodium content (Fig. 12-4, C). Because water follows sodium, an excess of sodium leads to an increase in total body water. Excess fluid moves into interstitial compartments, located between cells and in body cavities such as joints, pleura, and gastrointestinal tract, causing edema.
Fluid Volume Deficit
In FVD (Fig. 12-4, A), the sodium-to-water ratio remains relatively equal; ADH and aldosterone secretions are not activated. Prolonged inadequate fluid intake can result in FVD. However, FVD is usually associated with excessive loss of fluids from the gastrointestinal tract (vomiting, or diarrhea, drainage tubes), urinary tract (diuretics, polyuria, or excessive urination), or skin (sweating). Fever increases the need for electrolytes, increases fluid losses in dehumidified air (e.g., in an airplane), and causes diaphoresis (excessive sweating).
Dehydration temporarily leads to weight loss, but more importantly, adversely influences cognitive function and motor control.36 Decreased food and fluid intake can result from dementia, anorexia, nausea, or fatigue. Other, less obvious reasons are an inability to (a) obtain water, such as with impaired movement; (b) activate the thirst mechanism, as in hypodipsia (diminished thirst); or (c) swallow, as in neuromuscular problems or unconsciousness. Excessive fluid losses occasionally occur with prolonged exercise.
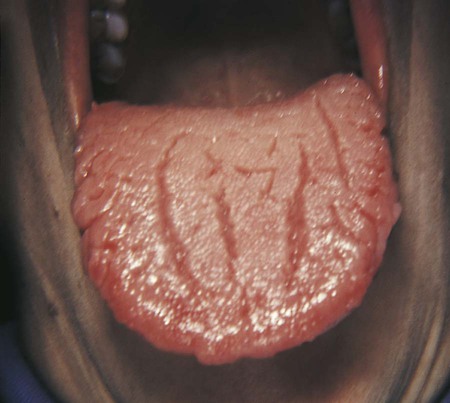
Common characteristics of FVD include weight loss, confusion and fatigue, sunken eyes, hypotension, and orthostatic hypotension. Classic signs are dry tongue with longitudinal fissures (slits or wrinkles that extend lengthwise on the tongue) (Fig. 12-5), xerostomia, shrinkage of oral mucous membranes, decreased skin turgor, dry skin, and decreased urinary output. A diminished salivary flow is associated with inadequate fluid intake. Pale yellow or almost colorless urine indicates adequate hydration. Dark yellow urine with a strong odor, advancing to painful urination, and (eventually) cessation of urine formation are progressive signs of inadequate water intake and dehydration. Treatment involves replacing lost fluid. If FVD is mild, oral fluids are likely to be sufficient. Intravenous solutions are needed with significant FVD.
Sodium
Physiological Roles
Requirements and Regulation
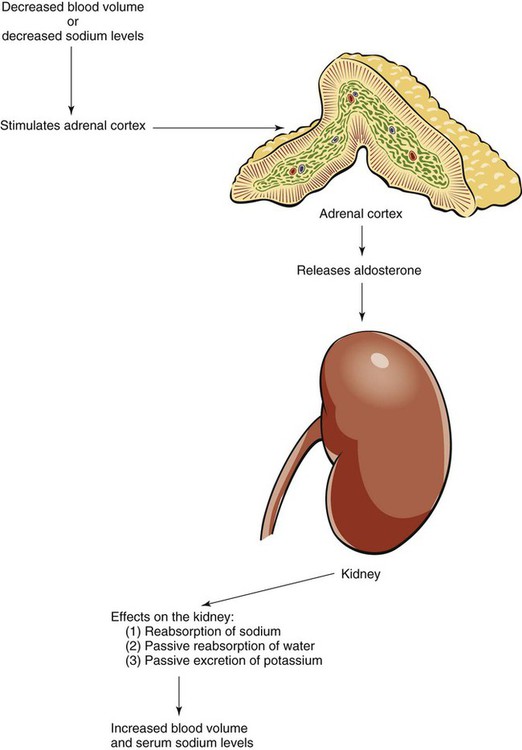
Because sodium is so readily available in foods, no RDA has been established. The IOM estimates a safe minimum intake might be 500 mg/day. This amount is increased in the face of abnormal losses. Sodium regulation involves several mechanisms. To keep the ECF concentration normal, the sodium-potassium pump is constantly moving sodium from the cell to ECF. Aldosterone released by the adrenal cortex results in sodium reabsorption or excretion by the kidneys depending on the body’s need (Fig. 12-6). The kidneys can adjust sodium excretion to match sodium intake despite large variations in intake. If serum sodium is high, aldosterone is inhibited, and sodium is excreted; the opposite is true for depressed serum sodium levels.
For most adults, the AI for sodium is 1500 mg/day with the UL being 2300 mg/day (Table 12-3). This AI does not apply to highly active individuals, such as endurance athletes, who lose large amounts of sodium through sweat.
Table 12-3
Institute of Medicine recommendations for sodium and chloride
Stay updated, free dental videos. Join our Telegram channel

VIDEdental - Online dental courses


