Vitamins Required for Oral Soft Tissues and Salivary Glands
• Educate the patient on oral soft tissue changes that occur in a B-complex deficiency.
• Differentiate between scientifically-based evidence versus food fads concerning vitamins.
• Explain to a patient who is a vegan why vitamin B12 is important and identify appropriate sources.
• Compare and contrast the functions and sources of vitamins and minerals important for healthy oral soft tissues, as well as deficiencies, toxicities, and associated symptoms.
• Identify dental considerations for vitamins closely involved in maintaining healthy oral soft tissues.
• Discuss nutritional directions for vitamins closely involved in maintaining healthy oral soft tissues.
Physiology of Soft Tissues
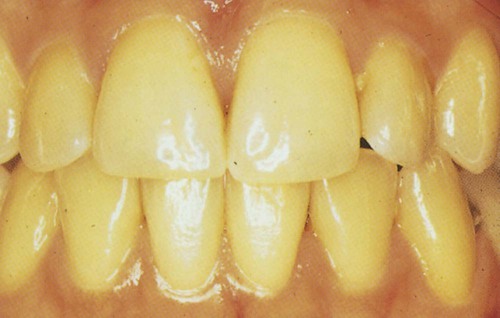
The systemic circulation provides nutrients and removes metabolic waste products from underlying structures and the salivary glands via the blood supply. Figure 11-1 shows healthy gingiva; changes in color, size, shape, texture, and functional integrity of the oral tissues often reflect systemic nutritional disorders. Signs and symptoms in soft oral tissues can be caused by deficiencies of many of the B-complex vitamins, vitamins C and E, iron, and protein (Box 11-1). Nutritional deficiencies result in similar oral signs and symptoms, such as pain, erythema, atrophy of tissues, and infection. Pyogenic (producing pus) and fungating (skin lesions with ulcerations, necrosis, and foul smell) microorganisms cause local infections in cracked epithelial surfaces. Approximately 90% of saliva is produced and secreted by three paired sets of major salivary glands: the parotid, submandibular, and sublingual glands (Fig. 11-2). Additionally, the lips and inner lining of the cheeks are equipped with hundreds of minor salivary glands.

Mucosal cells have a very rapid turnover rate, resulting in complete turnover in 3 to 5 days. Rapid generation of new cells in the oral epithelia provides replacement tissue for trauma resulting from friction of the teeth and mastication. Additionally, hundreds of cells in the filiform papillae and fungiform papillae are in constant transition, from their anabolism until their catabolism (Fig. 11-3). Filiform papillae are smooth, threadlike structures on the dorsum surface of the tongue, whereas fungiform papillae are red, mushroom-shaped structures scattered throughout the filiform papillae.
Thiamin (Vitamin B1)
Physiological Roles
Requirements
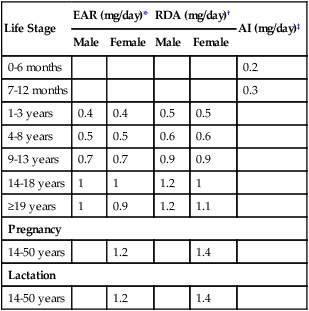
Thiamin is involved in using carbohydrates as kilocalories; the requirement is based on total caloric need. The recommended dietary allowance (RDA) for men (≥14 years old) is 1.2 mg/day and for women (≥19 years old) is 1.1 mg/day (Table 11-1). Participation in rigorous physical activity uses more energy, so more thiamin is required. Also, requirements are increased by pregnancy and lactation, hemodialysis or peritoneal dialysis, fever, hyperthyroidism, cardiac conditions, alcoholism, and the use of loop diuretics. No known adverse effects are evident from excessive thiamin intake, including supplements. Although a tolerable upper intake level (UL) is not established for thiamin, care should be taken when consumption routinely exceeds the RDA.
Table 11-1
Institute of Medicine recommendations for thiamin
| Life Stage | EAR (mg/day)* | RDA (mg/day)† | AI (mg/day)‡ | ||
| Male | Female | Male | Female | ||
| 0-6 months | 0.2 | ||||
| 7-12 months | 0.3 | ||||
| 1-3 years | 0.4 | 0.4 | 0.5 | 0.5 | |
| 4-8 years | 0.5 | 0.5 | 0.6 | 0.6 | |
| 9-13 years | 0.7 | 0.7 | 0.9 | 0.9 | |
| 14-18 years | 1 | 1 | 1.2 | 1 | |
| ≥19 years | 1 | 0.9 | 1.2 | 1.1 | |
| Pregnancy | |||||
| 14-50 years | 1.2 | 1.4 | |||
| Lactation | |||||
| 14-50 years | 1.2 | 1.4 | |||
*EAR (estimated average requirement)—the intake that meets the estimated nutrient needs of half of the individuals in a group.
†RDA (recommended dietary allowance)—the intake that meets the nutrient needs of almost all (97% to 98%) individuals in a group.
‡AI (adequate intake)—the observed average or experimentally set intake by a defined population or subgroup that seems to sustain a defined nutritional status, such as growth rate, normal circulating nutrient values, or other functional indicators of health. An AI is used if insufficient scientific evidence is available to derive an EAR. For healthy human milk–fed infants, the AI is the mean intake. The AI is not equivalent to a RDA.
Data from Institute of Medicine (IOM), Food and Nutrition Board: Dietary reference intakes for thiamin, riboflavin, niacin, vitamin B6, folate, vitamin B12, pantothenic acid, biotin, and choline, Washington, DC, 1998, National Academy Press.
Sources
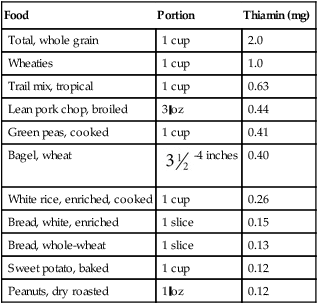
Thiamin is widely distributed in foods, and intake of a variety of foods, including enriched grains or whole grains, can ensure adequate amounts (Table 11-2). Approximately 40% of thiamin intake is provided by enriched breads, cereals, and pasta. (Because of enrichment, enriched breads may contain almost twice as much thiamin as whole grains). In the meat group, pork is an exceptionally good source. Other good sources include nuts and legumes. Following the guidelines for MyPlate and eating a variety of foods ensures adequate intake.
Table 11-2
Thiamin content of selected foods
| Food | Portion | Thiamin (mg) |
| Total, whole grain | 1 cup | 2.0 |
| Wheaties | 1 cup | 1.0 |
| Trail mix, tropical | 1 cup | 0.63 |
| Lean pork chop, broiled | 3 oz | 0.44 |
| Green peas, cooked | 1 cup | 0.41 |
| Bagel, wheat |  -4 inches -4 inches |
0.40 |
| White rice, enriched, cooked | 1 cup | 0.26 |
| Bread, white, enriched | 1 slice | 0.15 |
| Bread, whole-wheat | 1 slice | 0.13 |
| Sweet potato, baked | 1 cup | 0.12 |
| Peanuts, dry roasted | 1 oz | 0.12 |
Data from U.S. Department of Agriculture, Agricultural Research Service. USDA national nutrient database for standard reference, release 26, 2013. Nutrient Data Laboratory Home Page. Accessed August 30, 2013. Available at: http://www.ars.usda.gov/nutrientdata
Hypo States
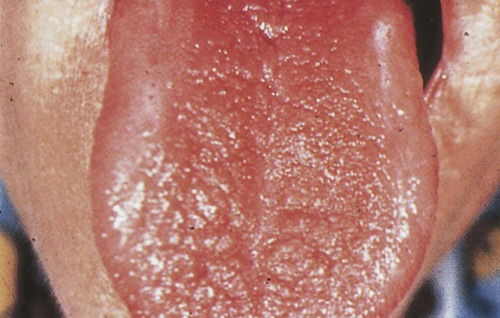
Whether or not a thiamin deficiency is evident in oral tissues is controversial. Some clinicians have associated a flabby, red, and edematous tongue with thiamin deficiency (Fig. 11-4). The fungiform papillae become enlarged and hyperemic (engorged with blood).
Riboflavin (Vitamin B2)
Physiological Roles
Requirements
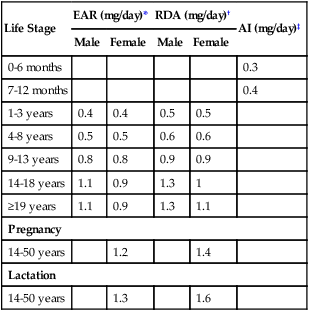
As shown in Table 11-3, the Institute of Medicine (IOM) recommends an intake of 1.3 mg/day for men (14 years old and older) and 1.1 mg/day for women (19 years old and older). This level is influenced by individual energy requirements. Additionally, when nitrogen balance is positive, more riboflavin is retained. No UL has been established.
Table 11-3
Institute of Medicine recommendations for riboflavin
| Life Stage | EAR (mg/day)* | RDA (mg/day)† | AI (mg/day)‡ | ||
| Male | Female | Male | Female | ||
| 0-6 months | 0.3 | ||||
| 7-12 months | 0.4 | ||||
| 1-3 years | 0.4 | 0.4 | 0.5 | 0.5 | |
| 4-8 years | 0.5 | 0.5 | 0.6 | 0.6 | |
| 9-13 years | 0.8 | 0.8 | 0.9 | 0.9 | |
| 14-18 years | 1.1 | 0.9 | 1.3 | 1 | |
| ≥19 years | 1.1 | 0.9 | 1.3 | 1.1 | |
| Pregnancy | |||||
| 14-50 years | 1.2 | 1.4 | |||
| Lactation | |||||
| 14-50 years | 1.3 | 1.6 | |||
*EAR (estimated average requirement)—the intake that meets the estimated nutrient needs of half of the individuals in a group.
†RDA (recommended dietary allowance)—the intake that meets the nutrient needs of almost all (97% to 98%) individuals in a group.
‡AI (adequate intake)—the observed average or experimentally set intake by a defined population or subgroup that seems to sustain a defined nutritional status, such as growth rate, normal circulating nutrient values, or other functional indicators of health. An AI is used if insufficient scientific evidence is available to derive an EAR. For healthy human milk–fed infants, the AI is the mean intake. The AI is not equivalent to a RDA.
Data from Institute of Medicine (IOM), Food and Nutrition Board: Dietary reference intakes for thiamin, riboflavin, niacin, vitamin B6, folate, vitamin B12, pantothenic acid, biotin, and choline, Washington, DC, 1998, National Academy Press.
Sources
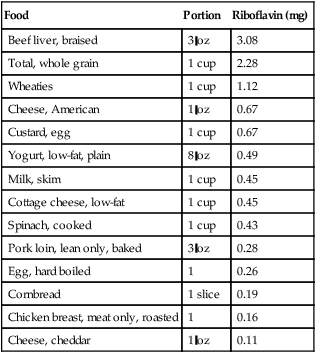
Although milk and milk products are excellent sources of riboflavin, approximately 30% of the dietary intake is furnished by foods in the grain group (Table 11-4). Meat, poultry, and fish also provide about one-fourth of the dietary requirement.
Table 11-4
Riboflavin content of selected foods
| Food | Portion | Riboflavin (mg) |
| Beef liver, braised | 3 oz | 3.08 |
| Total, whole grain | 1 cup | 2.28 |
| Wheaties | 1 cup | 1.12 |
| Cheese, American | 1 oz | 0.67 |
| Custard, egg | 1 cup | 0.67 |
| Yogurt, low-fat, plain | 8 oz | 0.49 |
| Milk, skim | 1 cup | 0.45 |
| Cottage cheese, low-fat | 1 cup | 0.45 |
| Spinach, cooked | 1 cup | 0.43 |
| Pork loin, lean only, baked | 3 oz | 0.28 |
| Egg, hard boiled | 1 | 0.26 |
| Cornbread | 1 slice | 0.19 |
| Chicken breast, meat only, roasted | 1 | 0.16 |
| Cheese, cheddar | 1 oz | 0.11 |
Data from U.S. Department of Agriculture, Agricultural Research Service. USDA national nutrient database for standard reference, release 26, 2013. Nutrient Data Laboratory Home Page. Accessed August 30, 2013: http://www.ars.usda.gov/nutrientdata
Hypo States
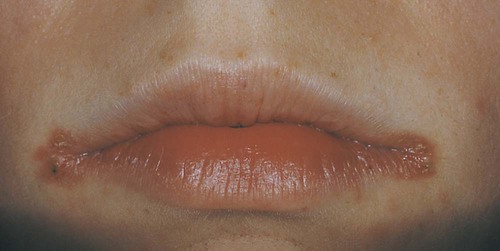
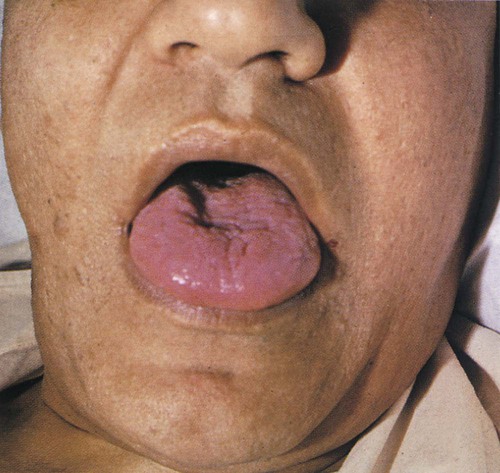
Symptoms associated with riboflavin deficiency, or ariboflavinosis, include angular cheilitis (Fig. 11-5), glossitis (Fig. 11-6), dermatitis, and anemia. With consistently inadequate intake, these symptoms may be observed within 8 weeks. Along with angular cheilosis, the lips may become extremely red and smooth. Fungiform papillae become swollen and slightly flattened and mushroom-shaped during early stages of riboflavin deficiency; the tongue has a pebbly or granular appearance. Severe chronic deficiencies lead to progressive papillary atrophy and patchy, irregular denudation of the tongue. The tongue may become purplish red or magenta in color because of vascular proliferation and decreased circulation. In more advanced cases, the entire tongue may become atrophic and smooth (Fig. 11-6). These symptoms, especially glossitis and dermatitis, may be secondary to vitamin B6 deficiency.
Niacin (Vitamin B3)
Physiological Roles
Requirements
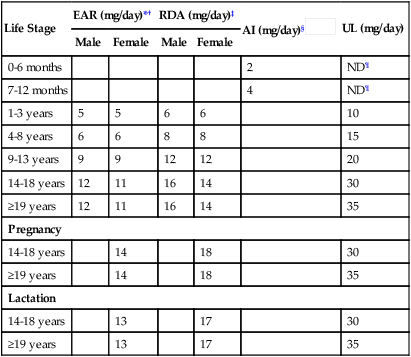
The body obtains niacin not only directly from food, but also indirectly from conversion of an amino acid, tryptophan, and from synthesis by intestinal microorganisms. RDAs are given in terms of niacin equivalents, which include dietary sources of niacin plus its precursor, tryptophan. Approximately 1 mg of niacin may be formed from 60 mg of dietary tryptophan. Niacin requirements are related to caloric intake. The RDA niacin equivalents for adults are 14 to 16 mg daily (Table 11-5). The UL for adults is 35 mg daily. There is no known adverse effect related to naturally-occurring niacin in foods.
Table 11-5
Institute of Medicine recommendations for niacin
| Life Stage | EAR (mg/day)*† | RDA (mg/day)‡ | AI (mg/day)§ |
UL (mg/day) | ||
| Male | Female | Male | Female | |||
| 0-6 months | 2 | ND¶ | ||||
| 7-12 months | 4 | ND¶ | ||||
| 1-3 years | 5 | 5 | 6 | 6 | 10 | |
| 4-8 years | 6 | 6 | 8 | 8 | 15 | |
| 9-13 years | 9 | 9 | 12 | 12 | 20 | |
| 14-18 years | 12 | 11 | 16 | 14 | 30 | |
| ≥19 years | 12 | 11 | 16 | 14 | 35 | |
| Pregnancy | ||||||
| 14-18 years | 14 | 18 | 30 | |||
| ≥19 years | 14 | 18 | 35 | |||
| Lactation | ||||||
| 14-18 years | 13 | 17 | 30 | |||
| ≥19 years | 13 | 17 | 35 | |||
*EAR (estimated average requirement)—the intake that meets the estimated nutrient needs of half of the individuals in a group.
‡RDA (recommended dietary allowance)—the intake that meets the nutrient needs of almost all (97% to 98%) individuals in a group.
§AI (adequate intake)—the observed average or experimentally set intake by a defined population or subgroup that seems to sustain a defined nutritional status, such as growth rate, normal circulating nutrient values, or other functional indicators of health. An AI is used if insufficient scientific evidence is available to derive an EAR. For healthy human milk–fed infants, the AI is the mean intake. The AI is not equivalent to a RDA.
¶ND—not determinable because of lack of data of adverse effects in this age group and concern with regard to lack of ability to handle excess amounts. Source of intake should be from food and formula to prevent high levels of intake.
Data from Institute of Medicine (IOM), Food and Nutrition Board: Dietary reference intakes for thiamin, riboflavin, niacin, vitamin B6, folate, vitamin B12, pantothenic acid, biotin, and choline, Washington, DC, 1998, National Academy Press.
Sources
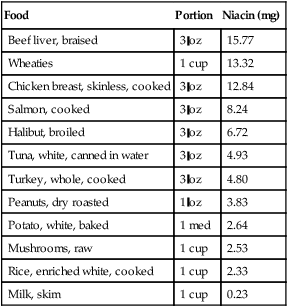
Niacin is widely distributed in plant and animal foods. Good sources include meats, cereals, legumes, seeds, and nuts (Table 11-6). Approximately 65% of the niacin in the U.S. diet is obtained from meat and milk. Tryptophan is found mainly in milk, eggs, and meats. The RDA for niacin equivalents is easily met by consuming foods high in niacin and foods containing tryptophan.
Table 11-6
Niacin content of selected foods
| Food | Portion | Niacin (mg) |
| Beef liver, braised | 3 oz | 15.77 |
| Wheaties | 1 cup | 13.32 |
| Chicken breast, skinless, cooked | 3 oz | 12.84 |
| Salmon, cooked | 3 oz | 8.24 |
| Halibut, broiled | 3 oz | 6.72 |
| Tuna, white, canned in water | 3 oz | 4.93 |
| Turkey, whole, cooked | 3 oz | 4.80 |
| Peanuts, dry roasted | 1 oz | 3.83 |
| Potato, white, baked | 1 med | 2.64 |
| Mushrooms, raw | 1 cup | 2.53 |
| Rice, enriched white, cooked | 1 cup | 2.33 |
| Milk, skim | 1 cup | 0.23 |
Data from U.S. Department of Agriculture, Agricultural Research Service. USDA national nutrient database for standard reference, release 26, 2013. Nutrient Data Laboratory Home Page. Accessed August 30, 2013: http://www.ars.usda.gov/nutrientdata
Hyper States and Hypo States
Supplemental doses of nicotinic acid (3 to 6 g/day) are effective in reducing low-density lipoprotein (LDL) cholesterol and triglycerides, while increasing high-density lipoprotein (HDL) cholesterol. (Nicotinamide does not function in this role.) Despite positive changes in serum lipid levels, a large study funded by National Institutes of Health using a combination of niacin supplements and statin did not reduce risk of CHD (heart attacks and strokes), causing the study to be terminated early.1,2
Niacin deficiency is usually associated with a maize (corn) diet because corn products contain all the essential amino acids except tryptophan. This diet increases the body’s requirements for tryptophan and niacin. A deficiency is also seen in alcoholics but is unlikely in individuals who consume adequate protein. Niacin deficiency results in degeneration of the skin, gastrointestinal tract, and nervous system, a condition known as pellagra. Symptoms of pellagra have been referred to as “the 4 Ds”—dermatitis, diarrhea, depression or dementia, and death. The term pellagra is derived from the Latin word for animal hide; the skin may become rough and resemble goose flesh. The most striking and characteristic sign of pellagra is a reddish skin rash, especially on the face, hands, or feet, which is always bilaterally symmetrical (i.e., appears on both sides of the body at the same time) (Fig. 11-7A). It flares up when skin is exposed to strong sunlight. Neurological symptoms include depression, apathy, headache, fatigue, and loss of memory. If untreated, it may lead to death.

Stay updated, free dental videos. Join our Telegram channel

VIDEdental - Online dental courses


