CHAPTER 1
The World Without Teeth: Demographic Trends
Edentulism, defined as having no teeth, is usually the result of dental caries and periodontal disease. In the case of the latter, the natural course of the disease leads to the loss of all teeth only in a very small percentage of people. The same pattern is probably true with caries, although observational studies are rare. Edentulism cannot be seen, therefore, as the ultimate stage of pathologic processes, but the result of extraction of teeth more or less compromised by diseases. The removal of teeth is related to a series of factors of which the extent of the caries attack or periodontal breakdown may play only a minor role. On many occasions, it is a measure used to prevent future pain, to lower the cost associated with dental treatment, or to avoid anxiety related to dental visits.1 The number of teeth extracted at the time of full clearance has dropped significantly over the last 20 years in industrialized countries, and today most cases involve the removal of about six teeth.2,3 Dentists and patients usually agree when full clearance is the most reasonable choice of treatment; however, in 15% of cases, the demand comes from the patient while the dentist would have preferred to keep at least some of the teeth.2 Among the most frequently cited factors that influence edentulism in a given area are economic wealth, education, the availability and use of professional and preventive services, oral health care systems, third-party payment, dental awareness, and social beliefs. The end result is that edentulism varies widely between countries and also between regions. It also means that edentulism varies over time since the factors themselves evolve over the years.
The gold standard of edentulism evaluation in a given area is to conduct a clinical survey and to identify edentulous people. The survey is the method of choice in less developed countries. The number of people surveyed has to be large enough to be representative and the selection of subjects has to be randomized. An acceptable substitute for clinical observation is simply to ask the question “How many teeth do you have?” The question may be administered in a written questionnaire or by telephone interview; both methods have good validity.4,5 Hence, it seems relatively simple to measure edentulism in countries by conducting surveys and taking a census on a regular basis. Yet, a review of the data available for the rate of edentulism for the period from 1985 to 2000 revealed that only 37 of the 190 countries in the United Nations had carried out a randomized survey. The information was taken from peer-reviewed papers (II countries), publicly accessible databases or reports (Canada, United Kingdom, and United States), and the World Health Organization (WHO) website on oral health (23 countries). Information was deemed relevant when the sample was representative of the country and age class (spanning a maximum of 10 years). Only eight countries (Canada, China, Finland, Iceland, Norway, Sweden, United Kingdom, and United States) have detailed data for various age classes and regions.
Age and Edentulism
Despite popular belief, the loss of teeth cannot be considered part of the healthy aging process; however, since caries and periodontal disease are cumulative in essence, the number of edentulous people increases with age. To illustrate this relationship, edentulism in percentage is plotted against age in Fig 1-1. Each of the 286 dots represents the midpoint of a specific age class. When age class was reported as 75+ or 80+, the corresponding values chosen were 80 and 85, respectively. The data summarize 22 countries and 10 regions. Despite the wide spread of dots due to the differences between countries or regions, the influence of age on the edentulism rate is clear. The 65 to 74 age group (value = 70) is heavily represented, since it is a WHO-recommended age group, and so is value 80, which corresponds to the 75+ age group, a common age category in surveys from industrialized countries. A linear regression line can be fitted to the data to show that, with a 10-year increase in age, edentulism increases by about 4%. However, an exponential model fits the data much better. Both curve-fitting methods are highly significant (P < .001). In the exponential model, edentulism increases rapidly only after 70 years of age. One possible explanation is that the last remaining teeth are extracted in one intervention, thus increasing the number of edentulous people more rapidly. This would be in line with reports showing that a significant proportion of teeth are extracted for “prosthodontic” reasons and that the last six remaining teeth are extracted all at once.2,3
Edentulism Worldwide
Disparity among countries is wide, as can be extrapolated from Fig 1-1. To illustrate more accurately the difference among countries, the data for edentulism per country for the age group 65 to 74 years is listed in Table 1-1. Criteria for inclusion were that the data must be representative of the country and not a region, and that the edentulism rate must be recorded for the 65 to 74 age group between 1985 and 1999. For example, Canada was not listed because the age classes used in the survey were 65 to 69 and 70 to 98. For these two age groups, the rates were 47% and 58%, respectively. It can be argued that in Nigeria and Kenya, life expectancy is short, and thus the edentulism rate in age class 65 to 74 years is artificially low. However, it is remarkable that not one edentulous person was observed despite the large sample size (4,600 and 1,130, respectively) during the surveys. Iceland has the highest level of edentulism, and this problem has been the subject of several papers.4 The decline in edentulism is rapid in this country and is being closely monitored. Some similarities between countries are worth mentioning because they are so different in terms of economic welfare: France and Indonesia have the same rate of edentulism at 16% and the United Kingdom and Sri Lanka both have an edentulism rate of 36% to 37%.
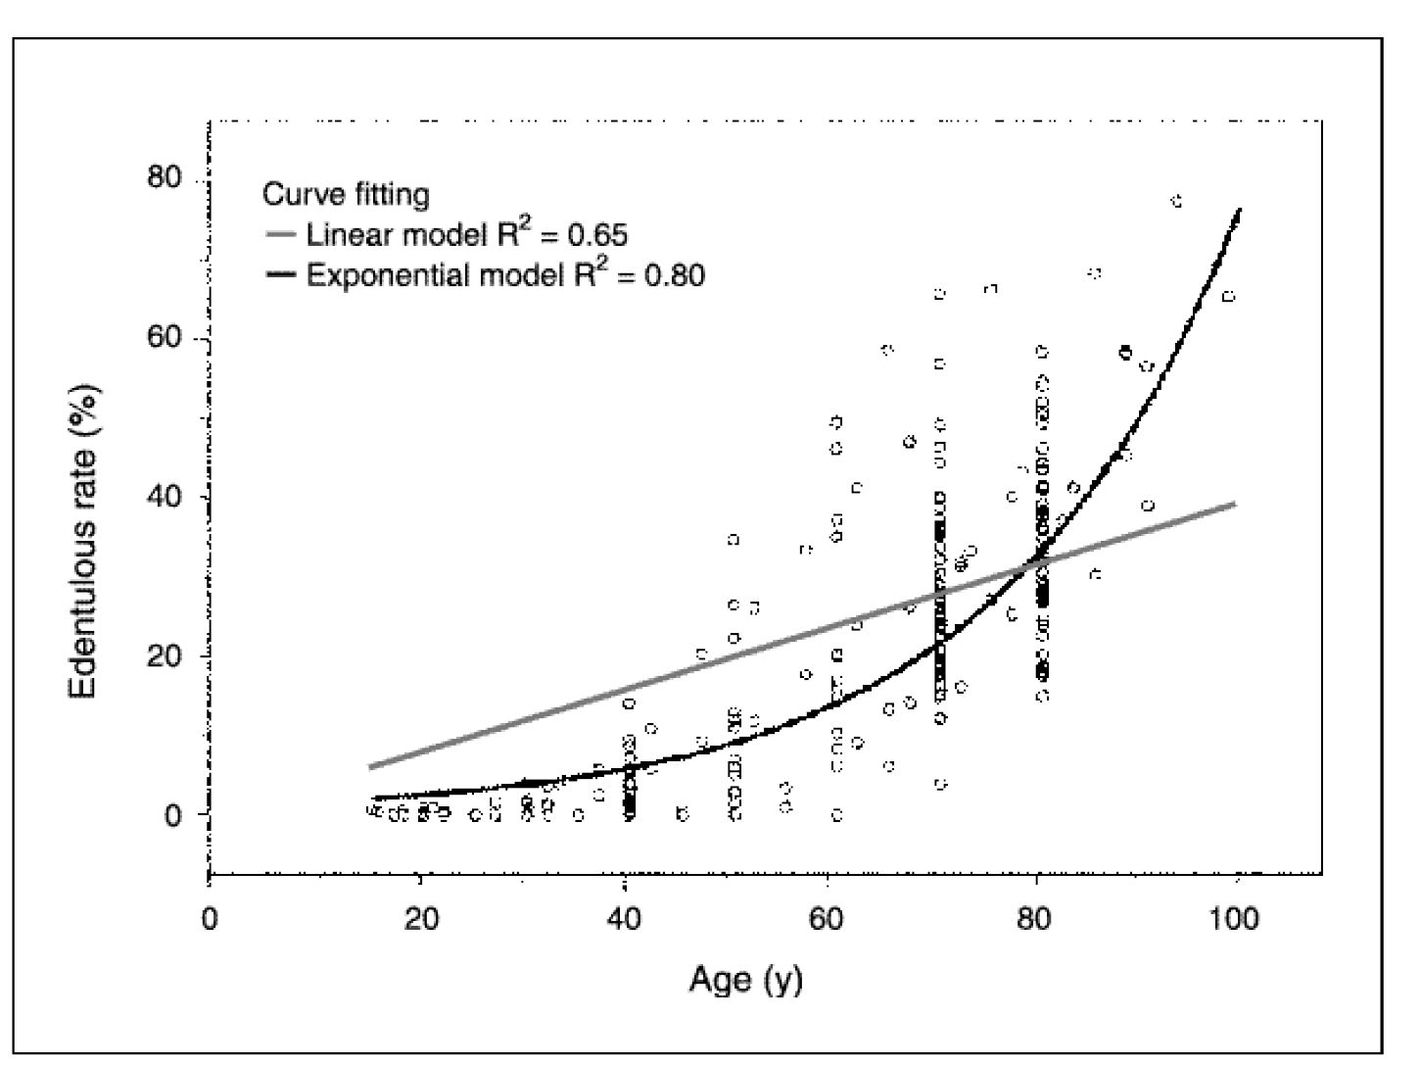
Fig 1-1 Relationship between age and edentulism in selected countries and regions. Countries: Austria, Belarus, Canada, China, Denmark, Egypt, Estonia, Finland, France, Germany, Hong Kong, Hungary, Iceland, Indonesia, Italy, Netherlands, Nigeria, Poland, Sweden, Switzerland, United Kingdom, United States. Regions: British Columbia (Canada), Berlin (Germany), Kitakyushu (Japan), Melbourre (Australia), Navarra (Spain), New England (United States), Ontario (Canada), Quebec (Canada), Rhones-Alps (France), Trondelag (Norway).
Variation Within a Country
In a US nationwide telephone survey, edentulism was estimated in 46 of 50 states for the 65 to 74 age group from 1995 to 1997.6 The lowest rate of edentulism was recorded in Hawaii (12%) and the highest in West Virginia (44%), a ratio of 1:3.7. No fewer than 20 states, including New York, Washington, and Connecticut, fall in the 15% to 25% bracket, but for I I states, the rate was higher than 30%. Such a range could not be found in other countries. In Canada, the Second Health Promotion Survey was conducted by Statistics Canada in 1990 through face-to-face interviews across the country.7 About 14,000 inhabitants answered the questions related to oral health to show that, in the 65+ age group, edentulism varies from 41% in Ontario to 67% in Quebec. In a more recent (1993) and detailed survey in Quebec,8 edentulism was at 58%, ie, a rate similar to that found in the Atlantic Provinces. The edentulism rate in Quebec remains approximately 1.6 times higher than that found in British Columbia.
Table 1-1 Edentulism rate in various countries for the 65 to 74 age group
| Country | Edentulous rate (%) | Year of survey |
|---|---|---|
| Kenya | 0 | 1986 |
| Nigeria | 0 | 1991 |
| Gambia | 5.6 | 1995 |
| China | 10.5 | 1995 |
| Hong Kong | 12 | 1991 |
| Cambodia | 14.6 | 1990 |
| Belarus | 14.7 | 1995 |
| Sweden | 15 | 1997 |
| Slovenia | 16 | 1998 |
| France | 16.3 | 1995 |
| Thailand | 16.3 | 1994 |
| Indonesia | 16.3 | 1995 |
| Egypt | 17.3 | 1991 |
| Switzerland | 17.6 | 1988 |
| Singapore | 17.7 | 1996 |
| Denmark | 18 | 1994 |
| Italy | 18.8 | 1993 |
| Pakistan | 19.6 | 1988 |
| Uzbekistan | 22.2 | 1996 |
| Fiji | 22.6 | 1998 |
| United States | 22.9 | 1997 |
| Hungary | 27.7 | 1991 |
| Spain | 31 | 1999 |
| Lebanon | 35 | 1994 |
| Poland | 35.5 | 1991 |
| United Kingdom | 36 | 1998 |
Stay updated, free dental videos. Join our Telegram channelVIDEdental - Online dental courses
 Get VIDEdental app for watching clinical videos

|