Introduction
The aim of this study was to evaluate whether treatment with full-coverage bonded acrylic splint expanders causes formation of white spot lesions using quantitative light-induced fluorescence.
Methods
The experimental group underwent rapid maxillary expansion (RME) (n = 16; 6 boys, 10 girls; mean age, 14.1 ± 2.2 years), and the control group received no orthodontic treatment (n = 17; 9 men, 8 women; mean age, 20.7 ± 1.1 years). Quantitative light-induced fluorescence images of the RME patients were taken before cementation and after decementation of the appliances. The images of the control group comprised quantitative light-induced fluorescence images taken 3 months apart. Four parameters were calculated for 10 anterior teeth.
Results
Between cementation and decementation, statistically significant differences were found in all 4 parameters in the RME group, whereas no significant changes were found in any parameters in the control group. A comparison of the measured parameters between the RME and control groups showed statistically significant differences.
Conclusions
Patients treated with a full-coverage bonded appliance tended to develop more white spot lesions than did the control subjects.
Highlights
- •
We used bonded full-coverage appliances for rapid maxillary expansion.
- •
We applied glass ionomer cement to bond the appliances.
- •
White spot lesion formation was examined by quantitative light-induced fluorescence.
- •
Full-coverage appliances may cause white spot lesions.
White spot lesion formation is a common side effect of orthodontic treatment. Gorelick et al showed that the prevalence values of white spot lesion formation were 49.6% in patients treated with fixed orthodontic appliances and 24% in an untreated control group. When fixed appliances are placed on the teeth, areas of plaque accumulation are created, and maintenance of adequate oral hygiene becomes a challenge for the patient. Studies have shown that plaque accumulation is increased in patients receiving orthodontic treatment with fixed appliances. Increased plaque accumulation results in increased cariogenic activity and demineralization of the enamel. Since translucency is related to the degree of enamel mineralization, white spot lesions are seen as the first clinical indication of initial enamel demineralization. These lesions form rapidly over a period of about 4 weeks.
When orthodontic treatment is completed and fixed appliances are removed, white spot lesions may either remineralize or persist. Some lesions even progress and produce cavitations that require restoration. Persistent or progressive lesions result in undesirable esthetic manifestations. Thus, white spot lesions should be found as early as possible.
Various types of orthodontic appliances enhance plaque accumulation, despite patients’ efforts to ensure adequate oral hygiene. White spot lesion formation can easily occur in the cariogenic environment adjacent to the irregular surfaces of orthodontic appliances such as brackets, wires, loose bands, orthodontic elastomeric materials, or other frequently used appliances for correction of Class II and Class III malocclusions and rapid maxillary expansion (RME) devices.
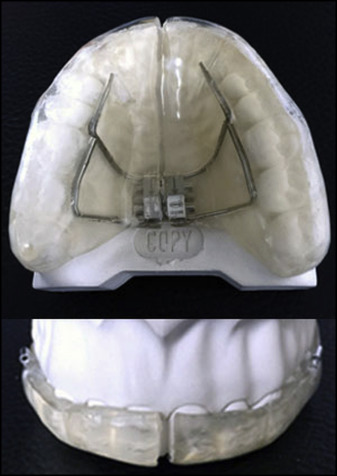
RME is a commonly used procedure for the treatment of a maxillary transverse deficiency because transverse occlusal discrepancies between the maxillary and mandibular arches are relatively frequent, with a prevalence of 8%. The full-coverage bonded acrylic splint expander is an RME device developed over the years to prevent the unwanted effects of conventional appliances. It is both a tooth-borne and a tissue-borne appliance with enhanced anchorage and is favorable because it prevents unwanted tooth tipping and provides vertical control, which can be necessary during maxillary expansion in patients with increased vertical dimensions. Despite its beneficial properties, the bonded appliance can lead to white spot lesion formation through microleakage and increased plaque accumulation.
Quantitative light-induced fluorescence (QLF) is a method of white spot lesion detection that evaluates the fluorescence levels of lesions. It provides measurements of mineralization changes in demineralized and surrounding sound enamel that are directly related to fluorescence levels. To date, various studies have been performed to determine the effect of orthodontic treatment on white spot lesion formation using QLF. However, no studies have been carried out on the effect of full-coverage bonded acrylic splint expander treatment on white spot lesion formation.
Therefore, the aim of our in-vivo study was to evaluate the effect of full-coverage bonded acrylic splint expander treatment on white spot lesion formation with QLF.
Material and methods
The local research ethics committee of the Department of Orthodontics, Faculty of Dentistry, of Erciyes University in Kayseri, Turkey, granted ethical approval for the study. Informed consent was obtained from the patients and the parents of those under 18 years of age before the study. The sample population comprised orthodontic patients treated at the Department of Orthodontics of Erciyes University. The experimental group consisted of 16 patients (6 boys, 10 girls) with a mean age of 14.1 ± 2.2 years, and the control group included 17 patients (9 men, 8 women) with a mean age of 20.7 ± 1.1 years. No patient had deciduous, congenitally missing, or extracted teeth. A power analysis was performed using G*Power software (version 3.0.10; Franz Faul Universitat, Kiel, Germany). Based on a 1:1 ratio between the groups, a sample size of 16 subjects in each group was calculated to give more than 85% power to detect significant differences with an effect size of 0.30 at a significance level of α = 0.05.
The experimental group included patients with a transverse maxillary deficiency in addition to an entire orthodontic malocclusion. The patients underwent RME with a full-coverage bonded acrylic splint expander that contained a hyrax screw (Dentaurum, Pforzheim, Germany), with an activation of 2 turns a day (0.2 mm per turn) for the first week and 1 turn a day after the first week until adequate expansion was reached, as recommended by Zimring and Isaacson. After reaching the final transverse maxillary width, the acrylic splint expander was kept in the mouth as a fixed retainer for 1 month. The appliance was then uncemented. The mean duration that the appliance was attached to the teeth included the phase of expansion until the tips of the palatal cusps of the maxillary first molars contacted the tips of the buccal cusps of the mandibular first molars, with a month of fixed retention (65.10 ± 3.06 days).
The acrylic plate of the expander covered the crowns of all teeth and the palate, leaving only a 1-mm gap between its borders and the gingival margins to facilitate adequate cleaning at the gingival margins by the patient. Glass ionomer luting cement (Ketac Cem radiopaque; 3M ESPE, Neuss, Germany) was used for bonding the appliance to the teeth in accordance with the manufacturer’s instructions. To prevent bond failure, the patients were warned not to drink acidic beverages and not to eat hard food. After cementation of the expander, the patients were shown how to clean their mouth with the expander in place and advised to brush their teeth after each meal. No additional fluoride applications were given.
The control group consisted of subjects who had never received orthodontic treatment. They were educated on proper oral hygiene techniques and, similarly to the experimental group, they were asked to brush their teeth after each meal. Supplemental fluoride applications were not given during the time interval when their QLF images were captured.
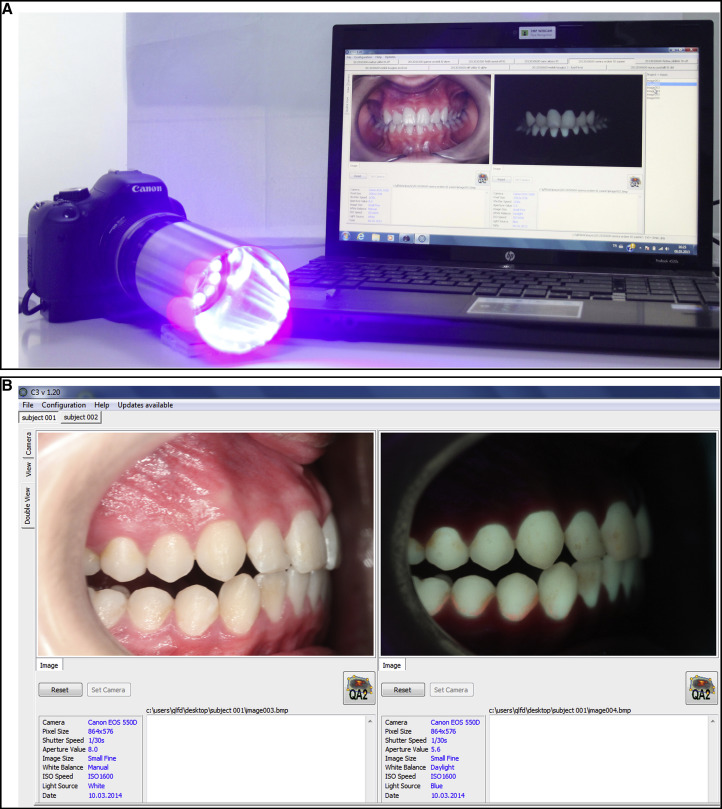
The QLF images of the RME patients were taken before cementation (T0) and after decementation (T1) of the full-coverage bonded acrylic splint expander ( Fig 1 ). The T0 and T1 images of the untreated control group comprised QLF images taken 3 months apart. The QLF images were captured with a QLF-D Biluminator 2-camera system (Inspektor Research Systems, Amsterdam, The Netherlands) and stored automatically on a computer with image-capturing software (C3 v1.20; Inspektor Research Systems) ( Fig 2 ). Images of the tooth surfaces were all captured with the same camera position and angulation. All images were taken in a dark room by the same examiner (Y.N.K.).
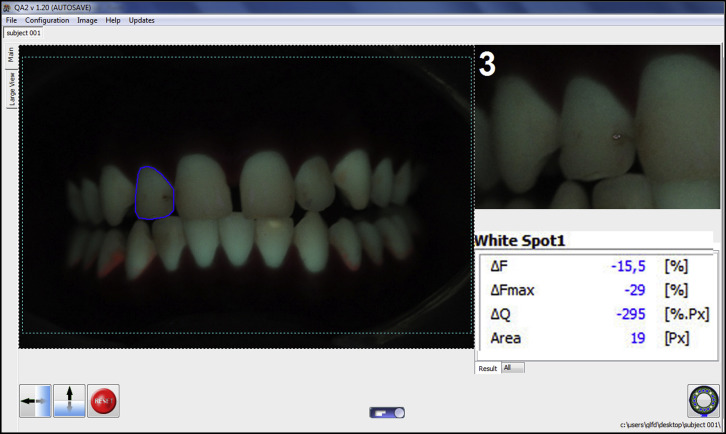
In each subject, the buccal surfaces of 10 anterior teeth (maxillary incisors, canines, and premolars) were assessed for white spot lesions. One investigator (Y.N.K.) who was blinded to the groups evaluated each image using analysis software (QA2 v1.20; Inspektor Research Systems) ( Fig 3 ). Four parameters were calculated for each tooth: percentage of fluorescence loss with respect to the fluorescence of sound tooth tissue (ΔF [%]), maximum loss of fluorescence intensity in the whole lesion (ΔFmax [%]), lesion area with ΔF equal to or smaller than a –5% threshold (A [px 2 ]), and percentage of fluorescence loss with respect to the fluorescence of sound tissue times the area that indicated lesion volume (ΔQ [%px 2 ]). The QLF images were then reanalyzed after a 2-week interval by the same examiner (Y.N.K.). Measurements made with the analysis software showed a high correlation coefficient, with a value of 0.91 for intraobserver reliability. The calculated parameters were used to compare the experimental and control groups.
Statistical analysis
The Wilcoxon signed rank test was used to compare the parameters at the beginning and end of the study for each tooth in both groups. Differences between the measurements at T0 and T1 were calculated for each group, and the Mann-Whitney U test was used for comparison of these differences between the groups. The level of statistical significance was set at P <0.05.
Results
In the RME treatment group, white spot lesion formation was observed in all teeth except the maxillary right and left canines and the right second premolars. The fluorescence levels in the enamel decreased during the study period, indicating mineral loss. From the 16 subjects in the RME group, a total of 160 buccal surfaces were assessed by QLF. Table I demonstrates the means of the ΔF, ΔFmax, A, and ΔQ scores as well as the P values of the 10 maxillary anterior teeth of the patients treated with a full-coverage bonded acrylic splint expander.
| Tooth ∗ | ΔF (%) | ΔF (%) | ΔF (%) | ΔFmax (%) | ΔFmax (%) | ΔFmax (%) | ΔQ (%px 2 ) | ΔQ (%px 2 ) | ΔQ (%px 2 ) | A (px 2 ) | A (px 2 ) | A (px 2 ) |
|---|---|---|---|---|---|---|---|---|---|---|---|---|
| Mean T0 | Mean T1 | P value | Mean T0 | Mean T1 | P value | Mean T0 | Mean T1 | P value | Mean T0 | Mean T1 | P value | |
| 11 | −1.51 ± 2.71 | −4.35 ± 4.37 | 0.004 ‡ | −1.56 ± 2.8 | −5.75 ± 6.11 | 0.004 ‡ | −5.18 ± 10.04 | −50.12 ± 77.94 | 0.004 ‡ | 0.87 ± 1.74 | 6.5 ± 10.62 | 0.02 † |
| 12 | −4.15 ± 4.05 | −6.97 ± 5.55 | 0.004 ‡ | −5.87 ± 6.79 | −13 ± 11.37 | 0.001 ‡ | −177.18 ± 491.09 | −610.25 ± 1146.44 | 0.003 ‡ | 18.12 ± 47.29 | 51.62 ± 91.48 | 0.006 ‡ |
| 13 | −4.07 ± 9.62 | −4.84 ± 10.07 | 0.297 NS | −8.06 ± 22.02 | −9.18 ± 23.17 | 0.469 NS | −479.56 ± 1506.11 | −450.56 ± 1619.5 | 0.469 NS | 21.18 ± 53.75 | 16.25 ± 40.5 | 0.578 NS |
| 14 | −2.53 ± 3.96 | −6.75 ± 3.95 | 0.002 ‡ | −5 ± 8.63 | −11.75 ± 11.23 | 0.01 † | −247.06 ± 518.87 | −315.81 ± 556.72 | 0.11 NS | 27.37 ± 55.25 | 24.43 ± 46.8 | 0.497 NS |
| 15 | −2.51 ± 4.11 | −4.56 ± 5.29 | 0.055 NS | −4.75 ± 9.39 | −7.25 ± 11.18 | 0.164 NS | −311 ± 1096.43 | −335.18 ± 791.25 | 0.129 NS | 27.12 ± 91.79 | 31.62 ± 71.36 | 0.129 NS |
| 21 | −3.13 ± 4.42 | −5.42 ± 5 | 0.002 ‡ | −4.81 ± 7.47 | −9.37 ± 11.75 | 0.002 ‡ | −253.5 ± 634.16 | −1070.5 ± 2963.21 | 0.006 ‡ | 25.87 ± 64.55 | 79.37 ± 200.06 | 0.01 † |
| 22 | −2.2 ± 3.44 | −4.61 ± 4.42 | 0.008 ‡ | −3 ± 4.93 | −7.87 ± 8.95 | 0.004 ‡ | −104.37 ± 349.88 | −197.87 ± 357.92 | 0.03 † | 12.18 ± 38.62 | 22.68 ± 38.96 | 0.164 NS |
| 23 | −2.2 ± 6.05 | −4.23 ± 7.34 | 0.063 NS | −5.12 ± 14.04 | −7.5 ± 14.3 | 0.313 NS | −1060.62 ± 3419.68 | −2360.3 ± 9157.37 | 0.313 NS | 57.37 ± 179.78 | 92.25 ± 342.09 | 0.313 NS |
| 24 | −0.85 ± 2.32 | −3.6 ± 3.84 | 0.02 † | −1.43 ± 4.25 | −4.87 ± 5.73 | 0.03 † | −24.81 ± 97.37 | −73.37 ± 175.25 | 0.008 ‡ | 3.5 ± 13.73 | 8.81 ± 20.58 | 0.008 ‡ |
| 25 | −1.08 ± 3.01 | −5.64 ± 4.63 | <0.001 § | −1.56 ± 4.57 | −8.43 ± 9.14 | <0.001 § | −6.62 ± 23.03 | −187.62 ± 367.43 | <0.001 § | 0.68 ± 2.27 | 17.75 ± 33.45 | <0.001 § |
The scores for each parameter in the control group are given in Table II . The control group had lower scores for all parameters measured. Changes between T0 and T1 were not significant for any parameter. In other words, no parameters were significantly affected in the 170 buccal surfaces assessed in the 17 control subjects, indicating no statistically significant demineralization ( P >0.05).
| Tooth ∗ | ΔF (%) | ΔF (%) | ΔF (%) | ΔFmax (%) | ΔFmax (%) | ΔFmax (%) | ΔQ (%px 2 ) | ΔQ (%px 2 ) | ΔQ (%px 2 ) | A (px 2 ) | A (px 2 ) | A (px 2 ) |
|---|---|---|---|---|---|---|---|---|---|---|---|---|
| Mean T0 | Mean T1 | P value | Mean T0 | Mean T1 | P value | Mean T0 | Mean T1 | P value | Mean T0 | Mean T1 | P value | |
| 11 | −1.81 ± 3.42 | −2.44 ± 3.56 | 0.313 NS | −2.76 ± 5.67 | −3.94 ± 7.32 | 0.125 NS | −26.58 ± 63.58 | −95.05 ± 293.23 | 0.156 NS | 3.23 ± 7.08 | 10.41 ± 28.91 | 0.156 NS |
| 12 | 0 ± 0 | −0.99 ± 2.23 | 0.25 NS | 0 ± 0 | −1 ± 2.26 | 0.25 NS | 0 ± 0 | −2.29 ± 5.21 | 0.25 NS | 0 ± 0 | 0.41 ± 0.93 | 0.25 NS |
| 13 | −0.37 ± 1.55 | −0.99 ± 2.21 | 0.5 NS | −0.35 ± 1.45 | −1.23 ± 2.77 | 0.25 NS | −0.35 ± 1.45 | −11.76 ± 34.67 | 0.25 NS | 0.05 ± 0.24 | 2.05 ± 6.06 | 0.25 NS |
| 14 | −0.92 ± 2.77 | −0.77 ± 2.17 | 1.00 NS | −1.35 ± 4.28 | −1 ± 2.87 | 1.00 NS | −22.47 ± 83.59 | −6.76 ± 24.96 | 0.5 NS | 2.35 ± 8.07 | 1 ± 3.64 | 0.5 NS |
| 15 | −0.41 ± 1.72 | −0.84 ± 2.41 | 0.5 NS | −0.47 ± 1.94 | −1.58 ± 5.03 | 0.5 NS | −2.05 ± 8.48 | −37.17 ± 145.97 | 0.5 NS | 0.29 ± 1.21 | 4.52 ± 17.42 | 0.5 NS |
| 21 | −1.82 ± 2.94 | −2.8 ± 3.1 | 0.156 NS | −2.29 ± 3.82 | −3.47 ± 3.97 | 0.109 NS | −22.52 ± 75.1 | −44.52 ± 99.75 | 0.148 NS | 3.23 ± 10.35 | 6.58 ± 13.16 | 0.148 NS |
| 22 | −1.51 ± 2.82 | −1.86 ± 3 | 0.438 NS | −1.82 ± 3.46 | −2.47 ± 4.15 | 0.313 NS | −5.58 ± 12.89 | −40.76 ± 103.47 | 0.125 NS | 0.82 ± 1.84 | 6.11 ± 14.96 | 0.125 NS |
| 23 | −0.29 ± 1.21 | −0.32 ± 1.35 | 1.00 NS | −0.29 ± 1.21 | −0.35 ± 1.45 | 1.00 NS | −0.58 ± 2.42 | −1.29 ± 5.33 | 1.00 NS | 0.11 ± 0.48 | 0.23 ± 0.97 | 1.00 NS |
| 24 | −1.69 ± 6.98 | −1.9 ± 7.85 | 1.00 NS | −4.35 ± 17.94 | −4.64 ± 19.16 | 1.00 NS | −957.88 ± 3949.45 | −1075.82 ± 4435.73 | 1.00 NS | 33.29 ± 137.27 | 33.17 ± 136.79 | 1.00 NS |
| 25 | −1.37 ± 4.5 | −1.88 ± 3.08 | 0.625 NS | −2.58 ± 9.46 | −2.29 ± 3.94 | 0.625 NS | −73.35 ± 295.8 | −22.58 ± 52.73 | 0.625 NS | 4.23 ± 16.21 | 3.41 ± 8.19 | 0.625 NS |
Stay updated, free dental videos. Join our Telegram channel
VIDEdental - Online dental courses


