Introduction
The purpose of this study was to assess differences between articles published in the American Journal of Orthodontics and Dentofacial Orthopedics (AJO-DO), the Angle Orthodontist (AO), the European Journal of Orthodontics (EJO), and the Journal of Orthodontics (JO) from 1999 to 2008.
Methods
All journals were hand-searched and 4301 eligible articles were identified. A random sample of 425 articles was obtained to provide 80% power to detect a 100% increase in the number of randomized controlled trials (RCTs) at the 5% level of significance. Each article was classified according to predetermined criteria. Variations between journals were assessed using the χ 2 test or odds ratio (OR) and 95% confidence intervals (95% CI).
Results
The AJO-DO published 45.6% of the articles in the final sample, 27.7% were from the AO, 17.4% were from the EJO, and 9.2% were from the JO. Statistically significant differences were found between the type ( P <0.001), subject ( P <0.001), setting ( P <0.03), and method ( P <0.001) of articles published in the 4 journals. The increase in the proportion of RCTs published between 1999 and 2003 and 2004 to 2008 was not statistically significant (OR 0.64; 95% CI, 0.29, 1.43).
Conclusions
Statistically significant differences were found in the publication profiles of the 4 orthodontic journals examined, but the increase in RCTs was lower than anticipated.
In the current climate of evidence-based care, it is hoped that clinical decisions about health care are becoming supported by scientific evidence more frequently, and this includes the practice of orthodontics. Evidence-based clinical practice is an approach to decision making in which the clinician uses the best available current evidence, in consultation with the patient, to decide on which treatment suits the patient best. Evidence-based practice, as described by Rosenberg and Donald, involves systematically finding, appraising, and using this contemporaneous research as a basis for clinical decision making. Nevertheless, Sackett et al highlight the fact that evidence-based practice should incorporate both individual clinical expertise and the best available external evidence and that either alone is not enough.
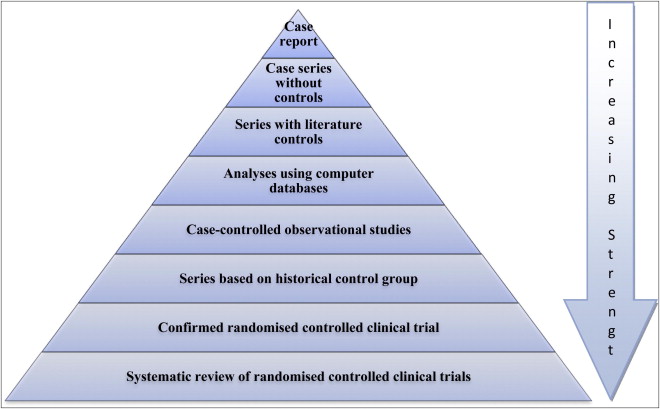
Unfortunately, a large proportion of published medical research lacks either relevance or sufficient methodological rigor to be reliable enough for answering clinical questions. Systematic reviews were added to Green and Byar’s hierarchy for the strength of evidence, which is based on the validity or degree to which they are not susceptible to bias ( Fig 1 ). However, with the development of systematic reviews it must be remembered that well coordinated and prospective randomized controlled trials (RCTs), with rigorous methodology and sufficient power, are required to yield strong inferences.
Deeks et al identified the problems associated with relying on nonrandomized studies to provide evidence of the effectiveness of health care interventions. They conclude that our inability to compensate for selection bias or identify nonrandomized studies that are free from selection bias indicates that nonrandomized studies should be undertaken only when RCTs are not feasible or are unethical. Nonrandomized studies may give seriously misleading results when treated and control groups appear similar in key prognostic factors, and residual confounding may be high even when good prognostic data are available.
In an editorial, Burden advocated the process of selectivity in reading so that there was sufficient time to read the truly important articles. Other authors have addressed the issue of being able to identify high-quality articles and publications. Lee et al in 2002 investigated the association of journal quality indicators with methodological quality of clinical research articles. They concluded that high citation rates and impact factors (IFs), and low manuscript acceptance rates appear to be predictive of higher methodological quality scores of journal articles. In a previous study, Harrison et al revealed that there were significant differences in the content of the British Journal of Orthodontics (now called the Journal of Orthodontics [JO]) and the European Journal of Orthodontics (EJO) when viewed with regard to type, setting, and subject of articles published. This suggests that different journals may be better reference points for different aspects of the speciality. An understanding about the publication trends in different journals may provide the daunted clinician with a means of identifying journals that are more appropriate to meet their individual requirements.
An assessment of the research design of papers published in a variety of general and specialist journals illustrates the relatively low levels of RCTs published. Relatively little information relating to an assessment of the methodological quality exists within the orthodontic literature; however, previously there has been an impression that evidence about the effectiveness of orthodontic treatment has been derived from retrospective evaluations of success. Work by Tulloch et al and Harrison et al into the publication profile of the orthodontic literature revealed a small proportion of published clinical evidence derived from RCTs.
This study is a retrospective, observational study that aims to classify objectively a representative sample of articles published in the 4 main orthodontic journals, over a 10-year period, to assess differences in article type, setting, subject, direction, research method, and control used. It will also assess whether there has been a significant increase in the number of RCTs published.
Material and methods
Identification of papers
A hand search of all the articles published in the American Journal of Orthodontics and Dentofacial Orthopedics (AJO-DO), Angle Orthodontist (AO), EJO, and JO between 1999 and 2008 was performed by one of the authors (R.G.). Articles were included if they were full articles or case reports, including updates, and excluded if they described reviews, for example, of books or abstracts, commentaries, litigation, legislation and ethics, or editorials.
Classification system
The classification system used was adapted from Harrison et al, which was itself a modified compilation of Fletcher and Fletcher, Bailar et al, and Tulloch et al. The classification system was designed to assess the kind of articles published and made no attempt to assess the quality of the studies.
Reliability
The robustness of the classification system was assessed in a pilot study involving a 10% random sample from the articles published in the 4 journals in 2003. The articles were classified by 2 examiners (R.G. and J.E.H.) and intra- and interexaminer reliability was assessed using percentage agreement and kappa statistic. When the initial data were analyzed, it became apparent that there were some weaknesses in the classification system that were resulting in ambiguity in assignment and an associated drop in reliability. Therefore, the definitions within the classification system were revised to clarify certain aspects. Specific attention was paid to the definitions within the research method and control sections, as these 2 categories were the least reliable. Also, an additional group was developed for laboratory-based RCTs within the research methods section so that they could be differentiated from clinically conducted trials. The same papers were then reassessed 1 month later by both examiners until good levels of agreement and reliability were obtained.
Main Study
For the main study, a sample size calculation, using data from Harrison in Pocock’s formula, revealed that 400 articles were required to give 80% power, at the 5% level, to detect a 100% rise in the proportion of RCTs published during the study period. Four thousand three hundred one articles were eligible and therefore a 10% random sample ( Fig 2 ) was produced by one of us (J.E.H.) using GraphicPad Software (GraphPad, LaJolla, Calif).
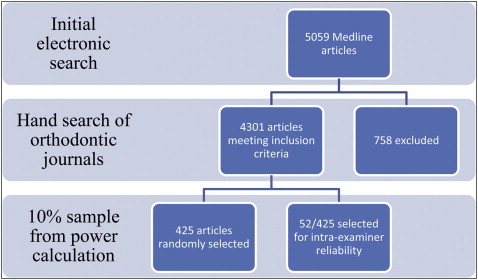
The type, setting, subject, direction, research method, control, and country of origin of each paper included were classified by 1 examiner (R.G.) ( Appendix 1 ) and recorded in coded form. A 10% random sample of the papers was reanalysed 1 month into the main investigation to reassess the intraexaminer reliability. To prevent errors due to examiner fatigue, no more than 10 articles were assessed at any 1 time. Variations between the journals, in terms of articles published and changes over time, were assessed using the χ 2 test or odds ratio (OR) and 95% confidence intervals (95% CI) as appropriate.
Results
Reliability
The initial mean percentage agreement for interexaminer reliability for all the groups was 74.4%, with mean κ statistic of 0.64, which suggested overall substantial agreement and reliability. After modifications to the classification system, the mean percentage agreement for interexaminer reliability was 93.7% and the κ statistic was 0.87, suggesting almost perfect reliability and agreement.
For the main study, the overall percentage agreement of the classification system was 95.3%. The actual percentage agreement between subgroups varied between 88% and 100%. The intraexaminer agreement was formally tested using the κ statistic, revealing a mean value of 0.93, which suggested that the intraexaminer agreement was almost perfect ( Table I ).
| Category | Percentage agreement | Kappa | Strength of agreement |
|---|---|---|---|
| Type | 100 | 1 | Almost perfect |
| Setting | 100 | 1 | Almost perfect |
| Subject | 100 | 1 | Almost perfect |
| Direction | 93 | 0.87 | Almost perfect |
| Research method | 88 | 0.86 | Almost perfect |
| Control | 91 | 0.83 | Almost perfect |
Main study
A random sample of 425 papers was selected from the 4301 eligible papers, of which 194 (45.6%) were from the AJO-DO, 118 (27.8%) were from the AO, 74 (17.4%) were from the EJO, and 39 were from (9.2%) the JO.
Comparison between journals
Type of paper
Three quarters of the papers published reported the results of studies (76.9%), but significant differences existed between the types of papers published between journals (χ 2 = 64.2, df = 12, P <0.001). Case reports and literature reviews made up a fifth each of the JO’s content; the EJO did not publish any case reports and the AO no opinion based material ( Table II ).
| 1999-2003 | 2004-2008 | 1999-2008 | |||||
|---|---|---|---|---|---|---|---|
| Journal | Type of paper | Number | % | Number | % | Number | % |
| AJO-DO | Case report | 18.0 | 21.4 | 12.0 | 10.9 | 30.0 | 15.5 |
| Literature review | 3.0 | 3.6 | 3.0 | 2.7 | 6.0 | 3.1 | |
| Opinion | 6.0 | 7.1 | 7.0 | 6.4 | 13.0 | 6.7 | |
| Study | 54.0 | 64.3 | 85.0 | 77.3 | 139.0 | 71.6 | |
| Update | 3.0 | 3.6 | 3.0 | 2.7 | 6.0 | 3.1 | |
| Total | 84.0 | 100.0 | 110.0 | 100.0 | 194.0 | 100.0 | |
| AO | Case report | 7.0 | 17.5 | 4.0 | 5.1 | 11.0 | 9.3 |
| Literature review | 1.0 | 2.5 | 2.0 | 2.6 | 3.0 | 2.5 | |
| Opinion | 0.0 | 0.0 | 0.0 | 0.0 | 0.0 | 0.0 | |
| Study | 29.0 | 72.5 | 70.0 | 89.7 | 99.0 | 83.9 | |
| Update | 3.0 | 7.5 | 2.0 | 2.6 | 5.0 | 4.2 | |
| Total | 40.0 | 100.0 | 78.0 | 100.0 | 118.0 | 100.0 | |
| EJO | Case report | 0.0 | 0.0 | 0.0 | 0.0 | 0.0 | 0.0 |
| Literature review | 2.0 | 6.5 | 0.0 | 0.0 | 2.0 | 2.7 | |
| Opinion | 0.0 | 0.0 | 1.0 | 2.3 | 1.0 | 1.4 | |
| Study | 29.0 | 93.5 | 42.0 | 97.7 | 71.0 | 95.9 | |
| Update | 0.0 | 0.0 | 0.0 | 0.0 | 0.0 | 0.0 | |
| Total | 31.0 | 100.0 | 43.0 | 100.0 | 74.0 | 100.0 | |
| JO | Case report | 3.0 | 14.3 | 6.0 | 33.3 | 9.0 | 23.1 |
| Literature review | 4.0 | 19.0 | 4.0 | 22.2 | 8.0 | 20.5 | |
| Opinion | 2.0 | 9.5 | 1.0 | 5.6 | 3.0 | 7.7 | |
| Study | 11.0 | 52.4 | 7.0 | 38.9 | 18.0 | 46.2 | |
| Update | 1.0 | 4.8 | 0.0 | 0.0 | 1.0 | 2.6 | |
| Total | 21.0 | 100.0 | 18.0 | 100.0 | 39.0 | 100.0 | |
| All | Case report | 28.0 | 15.9 | 22.0 | 8.8 | 50.0 | 11.8 |
| Literature review | 10.0 | 5.7 | 9.0 | 3.6 | 19.0 | 4.5 | |
| Opinion | 8.0 | 4.5 | 9.0 | 3.6 | 17.0 | 4.0 | |
| Study | 123.0 | 69.9 | 204.0 | 81.9 | 327.0 | 76.9 | |
| Update | 7.0 | 4.0 | 5.0 | 2.0 | 12.0 | 2.8 | |
| Total | 176.0 | 100.0 | 249.0 | 100.0 | 425.0 | 100.0 | |
Subject
Papers reporting on the development, diagnosis and treatment of human subjects comprised almost three quarters (72.2%) of all the published papers. However, there were significant differences in the subject of the papers in the different journals (χ 2 = 60.6, df = 21, P <0.001) with the JO publishing a third of the number of development papers compared with the other journals ( Table III ). The AO published twice as many materials based papers and the EJO had twice as many publications on animal experiments as the other journals. The proportion of papers reporting treatment of human subjects was approximately half for the AJODO and the JO but only a third for the AO and EJO.
| 1999-2003 | 2004-2008 | 1999-2008 | |||||
|---|---|---|---|---|---|---|---|
| Journal | Subject | Number | % | Number | % | Number | % |
| AJO-DO | Animal | 3.0 | 3.6 | 4.0 | 3.6 | 7.0 | 3.6 |
| Development | 12.0 | 14.3 | 28.0 | 25.5 | 40.0 | 20.6 | |
| Diagnostic | 3.0 | 3.6 | 8.0 | 7.3 | 11.0 | 5.7 | |
| Education | 0.0 | 0.0 | 3.0 | 2.7 | 3.0 | 1.5 | |
| Materials | 9.0 | 10.7 | 11.0 | 10.0 | 20.0 | 10.3 | |
| Not clear | 0.0 | 0.0 | 3.0 | 2.7 | 3.0 | 1.5 | |
| Services | 6.0 | 7.1 | 1.0 | 0.9 | 7.0 | 3.6 | |
| Treatment | 51.0 | 60.7 | 52.0 | 47.3 | 103.0 | 53.1 | |
| Total | 84.0 | 100.0 | 110.0 | 100.0 | 194.0 | 100.0 | |
| AO | Animal | 3.0 | 7.5 | 3.0 | 3.8 | 6.0 | 5.1 |
| Development | 12.0 | 30.0 | 19.0 | 24.4 | 31.0 | 26.3 | |
| Diagnostic | 0.0 | 0.0 | 3.0 | 3.8 | 3.0 | 2.5 | |
| Education | 0.0 | 0.0 | 0.0 | 0.0 | 0.0 | 0.0 | |
| Materials | 7.0 | 17.5 | 27.0 | 34.6 | 34.0 | 28.8 | |
| Not clear | 2.0 | 5.0 | 2.0 | 2.6 | 4.0 | 3.4 | |
| Services | 0.0 | 0.0 | 0.0 | 0.0 | 0.0 | 0.0 | |
| Treatment | 16.0 | 40.0 | 24.0 | 30.8 | 40.0 | 33.9 | |
| Total | 40.0 | 100.0 | 78.0 | 100.0 | 118.0 | 100.0 | |
| EJO | Animal | 4.0 | 12.9 | 3.0 | 7.0 | 7.0 | 9.5 |
| Development | 4.0 | 12.9 | 11.0 | 25.6 | 15.0 | 20.3 | |
| Diagnostic | 6.0 | 19.4 | 2.0 | 4.7 | 8.0 | 10.8 | |
| Education | 0.0 | 0.0 | 0.0 | 0.0 | 0.0 | 0.0 | |
| Materials | 5.0 | 16.1 | 9.0 | 20.9 | 14.0 | 18.9 | |
| Not clear | 1.0 | 3.2 | 0.0 | 0.0 | 1.0 | 1.4 | |
| Services | 0.0 | 0.0 | 0.0 | 0.0 | 0.0 | 0.0 | |
| Treatment | 11.0 | 35.5 | 18.0 | 41.9 | 29.0 | 39.2 | |
| Total | 31.0 | 100.0 | 43.0 | 100.0 | 74.0 | 100.0 | |
| JO | Animal | 0.0 | 0.0 | 1.0 | 5.6 | 1.0 | 2.6 |
| Development | 2.0 | 9.5 | 1.0 | 5.6 | 3.0 | 7.7 | |
| Diagnostic | 4.0 | 19.0 | 2.0 | 11.1 | 6.0 | 15.4 | |
| Education | 2.0 | 9.5 | 0.0 | 0.0 | 2.0 | 5.1 | |
| Materials | 2.0 | 9.5 | 3.0 | 16.7 | 5.0 | 12.8 | |
| Not clear | 2.0 | 9.5 | 1.0 | 5.6 | 3.0 | 7.7 | |
| Services | 1.0 | 4.8 | 0.0 | 0.0 | 1.0 | 2.6 | |
| Treatment | 8.0 | 38.1 | 10.0 | 55.6 | 18.0 | 46.2 | |
| Total | 21.0 | 100.0 | 18.0 | 100.0 | 39.0 | 100.0 | |
| All | Animal | 10.0 | 5.7 | 11.0 | 4.4 | 21.0 | 4.9 |
| Development | 30.0 | 17.0 | 59.0 | 23.7 | 89.0 | 20.9 | |
| Diagnostic | 13.0 | 7.4 | 15.0 | 6.0 | 28.0 | 6.6 | |
| Education | 2.0 | 1.1 | 3.0 | 1.2 | 5.0 | 1.2 | |
| Materials | 23.0 | 13.1 | 50.0 | 20.1 | 73.0 | 17.2 | |
| Not clear | 5.0 | 2.8 | 6.0 | 2.4 | 11.0 | 2.6 | |
| Services | 7.0 | 4.0 | 1.0 | 0.4 | 8.0 | 1.9 | |
| Treatment | 86.0 | 48.9 | 104.0 | 41.8 | 190.0 | 44.7 | |
| Total | 176.0 | 100.0 | 249.0 | 100.0 | 425.0 | 100.0 | |
Setting
Over two thirds of the papers were classified as being clinical (70.2%) and reporting on the development, diagnosis and treatment of human subjects. Significant differences were seen between journals (χ 2 = 18, df = 9, P <0.035) at the 5% level, with the AO and EJO publishing twice as many laboratory-based studies and the JO 3 times as many measurement-based papers ( Table IV ).
| 1999-2003 | 2004-2008 | 1999-2008 | |||||
|---|---|---|---|---|---|---|---|
| Journal | Setting | Number | % | Number | % | Number | % |
| AJO-DO | Clinical | 62.0 | 77.5 | 79.0 | 75.2 | 141.0 | 76.2 |
| Computer | 4.0 | 5.0 | 5.0 | 4.8 | 9.0 | 4.9 | |
| Laboratory | 11.0 | 13.8 | 18.0 | 17.1 | 29.0 | 15.7 | |
| Measurement | 3.0 | 3.8 | 3.0 | 2.9 | 6.0 | 3.2 | |
| Not clear | 0 | 0 | 0 | 0 | 0 | 0 | |
| Total | 80.0 | 100.0 | 105.0 | 100.0 | 185.0 | 100.0 | |
| AO | Clinical | 27.0 | 71.1 | 44.0 | 57.9 | 71.0 | 62.3 |
| Computer | 1.0 | 2.6 | 2.0 | 2.6 | 3.0 | 2.6 | |
| Laboratory | 9.0 | 23.7 | 28.0 | 36.8 | 37.0 | 32.5 | |
| Measurement | 1.0 | 2.6 | 2.0 | 2.6 | 3.0 | 2.6 | |
| Not clear | 0 | 0 | 0 | 0 | 0 | 0 | |
| Total | 38.0 | 100.0 | 76.0 | 100.0 | 114.0 | 100.0 | |
| EJO | Clinical | 18.0 | 60.0 | 29.0 | 69.0 | 47.0 | 65.3 |
| Computer | 1.0 | 3.3 | 1.0 | 2.4 | 2.0 | 2.8 | |
| Laboratory | 9.0 | 30.0 | 11.0 | 26.2 | 20.0 | 27.8 | |
| Measurement | 2.0 | 6.7 | 1.0 | 2.4 | 3.0 | 4.2 | |
| Not clear | 0 | 0 | 0 | 0 | 0 | 0 | |
| Total | 30.0 | 100.0 | 42.0 | 100.0 | 72.0 | 100.0 | |
| JO | Clinical | 12.0 | 80.0 | 12.0 | 70.6 | 24.0 | 75.0 |
| Computer | 1.0 | 6.7 | 0.0 | 0.0 | 1.0 | 3.1 | |
| Laboratory | 2.0 | 13.3 | 2.0 | 11.8 | 4.0 | 12.5 | |
| Measurement | 0.0 | 0.0 | 3.0 | 17.6 | 3.0 | 9.4 | |
| Not clear | 0 | 0 | 0 | 0 | 0 | 0 | |
| Total | 15.0 | 100.0 | 17.0 | 100.0 | 32.0 | 100.0 | |
| All | Clinical | 119.0 | 73.0 | 164.0 | 68.3 | 283.0 | 70.2 |
| Computer | 7.0 | 4.3 | 8.0 | 3.3 | 15.0 | 3.7 | |
| Laboratory | 31.0 | 19.0 | 59.0 | 24.6 | 90.0 | 22.3 | |
| Measurement | 6.0 | 3.7 | 9.0 | 3.8 | 15.0 | 3.7 | |
| Not clear | 0 | 0 | 0 | 0 | 0 | 0 | |
| Total | 163.0 | 100.0 | 240.0 | 100.0 | 403.0 | 100.0 | |
Method
More than a third of the papers were carried out retrospectively, and 40% were conducted prospectively. There were significant differences between journals (χ 2 = 39.5, df = 9, P <0.001), with the EJO publishing twice as many prospective papers compared with the JO and AJO-DO ( Table V ).
| 1999-2003 | 2004-2008 | 1999-2008 | |||||
|---|---|---|---|---|---|---|---|
| Journal | Method/Direction | Number | % | Number | % | Number | % |
| AJO-DO | Not clear | 2.0 | 2.4 | 2.0 | 1.8 | 4.0 | 2.1 |
| Prospective | 26.0 | 31.0 | 41.0 | 37.3 | 67.0 | 34.5 | |
| Retrospective | 42.0 | 50.0 | 36.0 | 32.7 | 78.0 | 40.2 | |
| Survey | 14.0 | 16.7 | 31.0 | 28.2 | 45.0 | 23.2 | |
| Total | 84.0 | 100.0 | 110.0 | 100.0 | 194.0 | 100.0 | |
| AO | Not clear | 2.0 | 5.0 | 3.0 | 3.8 | 5.0 | 4.2 |
| Prospective | 14.0 | 35.0 | 39.0 | 50.0 | 53.0 | 44.9 | |
| Retrospective | 15.0 | 37.5 | 16.0 | 20.5 | 31.0 | 26.3 | |
| Survey | 9.0 | 22.5 | 20.0 | 25.6 | 29.0 | 24.6 | |
| Total | 40.0 | 100.0 | 78.0 | 100.0 | 118.0 | 100.0 | |
| EJO | Not clear | 1.0 | 3.2 | 2.0 | 4.7 | 3.0 | 4.1 |
| Prospective | 20.0 | 64.5 | 27.0 | 62.8 | 47.0 | 63.5 | |
| Retrospective | 6.0 | 19.4 | 8.0 | 18.6 | 14.0 | 18.9 | |
| Survey | 4.0 | 12.9 | 6.0 | 14.0 | 10.0 | 13.5 | |
| Total | 31.0 | 100.0 | 43.0 | 100.0 | 74.0 | 100.0 | |
| JO | Not clear | 5.0 | 23.8 | 1.0 | 5.6 | 6.0 | 15.4 |
| Prospective | 5.0 | 23.8 | 5.0 | 27.8 | 10.0 | 25.6 | |
| Retrospective | 4.0 | 19.0 | 10.0 | 55.6 | 14.0 | 35.9 | |
| Survey | 7.0 | 33.3 | 2.0 | 11.1 | 9.0 | 23.1 | |
| Total | 21.0 | 100.0 | 18.0 | 100.0 | 39.0 | 100.0 | |
| All | Not clear | 10.0 | 5.7 | 8.0 | 3.2 | 18.0 | 4.2 |
| Prospective | 65.0 | 36.9 | 112.0 | 45.0 | 177.0 | 41.6 | |
| Retrospective | 67.0 | 38.1 | 70.0 | 28.1 | 137.0 | 32.2 | |
| Survey | 34.0 | 19.3 | 59.0 | 23.7 | 93.0 | 21.9 | |
| Total | 176.0 | 100.0 | 249.0 | 100.0 | 425.0 | 100.0 | |
Comparison of clinical studies
Of the 425 articles, 277 were in a clinical setting. Case report series made up one third of the total of clinical-based research. One tenth of the total sample was composed of RCTs. Significant differences were noticed in the research methods used for clinical studies (χ 2 = 34.2, df = 15, P <0.003) between journals, with more than two thirds of the papers in the JO, AJO-DO, and AO being made up of case reports, case series, or surveys ( Table VI ).
| 1999-2003 | 2004-2008 | 1999-2008 | |||||
|---|---|---|---|---|---|---|---|
| Journal | Clinical research method | Number | % | Number | % | Number | % |
| AJODO | Case control | 0.0 | 0.0 | 1.0 | 1.4 | 1.0 | 0.8 |
| Case report/series | 27.0 | 45.8 | 18.0 | 24.3 | 45.0 | 33.8 | |
| Cohort | 11.0 | 18.6 | 9.0 | 12.2 | 20.0 | 15.0 | |
| Controlled clinical trial | 2.0 | 3.4 | 8.0 | 10.8 | 10.0 | 7.5 | |
| Survey | 14.0 | 23.7 | 31.0 | 41.9 | 45.0 | 33.8 | |
| Randomized controlled trial | 5.0 | 8.5 | 7.0 | 9.5 | 12.0 | 9.0 | |
| Total | 59.0 | 100.0 | 74.0 | 100.0 | 133.0 | 100.0 | |
| AO | Case control | 1.0 | 3.7 | 0.0 | 0.0 | 1.0 | 1.4 |
| Case report/series | 11.0 | 40.7 | 8.0 | 18.2 | 19.0 | 26.8 | |
| Cohort | 1.0 | 3.7 | 9.0 | 20.5 | 10.0 | 14.1 | |
| Controlled clinical trial | 3.0 | 11.1 | 0.0 | 0.0 | 3.0 | 4.2 | |
| Survey | 9.0 | 33.3 | 21.0 | 47.7 | 30.0 | 42.3 | |
| Randomized controlled trial | 2.0 | 7.4 | 6.0 | 13.6 | 8.0 | 11.3 | |
| Total | 27.0 | 100.0 | 44.0 | 100.0 | 71.0 | 100.0 | |
| EJO | Case control | 2.0 | 10.0 | 5.0 | 16.7 | 7.0 | 14.0 |
| Case report/series | 4.0 | 20.0 | 9.0 | 30.0 | 13.0 | 26.0 | |
| Cohort | 5.0 | 25.0 | 4.0 | 13.3 | 9.0 | 18.0 | |
| Controlled clinical trial | 3.0 | 15.0 | 1.0 | 3.3 | 4.0 | 8.0 | |
| Survey | 4.0 | 20.0 | 6.0 | 20.0 | 10.0 | 20.0 | |
| Randomized controlled trial | 2.0 | 10.0 | 5.0 | 16.7 | 7.0 | 14.0 | |
| Total | 20.0 | 100.0 | 30.0 | 100.0 | 50.0 | 100.0 | |
| JO | Case control | 0.0 | 0.0 | 0.0 | 0.0 | 0.0 | 0.0 |
| Case report/series | 4.0 | 33.3 | 6.0 | 54.5 | 10.0 | 43.5 | |
| Cohort | 0.0 | 0.0 | 1.0 | 9.1 | 1.0 | 4.3 | |
| Controlled clinical trial | 0.0 | 0.0 | 0.0 | 0.0 | 0.0 | 0.0 | |
| Survey | 7.0 | 58.3 | 2.0 | 18.2 | 9.0 | 39.1 | |
| Randomized controlled trial | 1.0 | 8.3 | 2.0 | 18.2 | 3.0 | 13.0 | |
| Total | 12.0 | 100.0 | 11.0 | 100.0 | 23.0 | 100.0 | |
| All | Case control | 3.0 | 2.5 | 6.0 | 3.8 | 9.0 | 3.2 |
| Case report/series | 46.0 | 39.0 | 41.0 | 25.8 | 87.0 | 31.4 | |
| Cohort | 17.0 | 14.4 | 23.0 | 14.5 | 40.0 | 14.4 | |
| Controlled clinical trial | 8.0 | 6.8 | 9.0 | 5.7 | 17.0 | 6.1 | |
| Survey | 34.0 | 28.8 | 60.0 | 37.7 | 94.0 | 33.9 | |
| Randomized controlled trial | 10.0 | 8.5 | 20.0 | 12.6 | 30.0 | 10.8 | |
| Total | 118.0 | 100.0 | 159.0 | 100.0 | 277.0 | 100.0 | |
Stay updated, free dental videos. Join our Telegram channel
VIDEdental - Online dental courses


