Introduction
The objectives of this study were to determine the validity, reliability, and reproducibility of the iOC intraoral scanner (Cadent, Carlstadt, NJ) and its associated OrthoCAD software (Cadent) in measuring tooth widths and deriving Bolton ratios.
Methods
Thirty subjects had impressions taken of their teeth and rendered as stone casts. In addition, their mouths were scanned with the iOC and the scans were converted into digital models. Tooth widths were measured with a digital caliper from the physical models and with the OrthoCAD software from the virtual models. Bolton ratios were derived using the data from each method. Validity was assessed with a paired t test, reliability with the Pearson correlation coefficient, and reproducibility with the intraclass correlation coefficient.
Results
Although there were statistically significant differences between mean tooth widths ( P = 0.0083) and Bolton ratios ( P = 0.0354 and P <0.0001) with the 2 methods, the discrepancies were deemed to be clinically insignificant. The Pearson r for tooth-width replications was 0.99 for both techniques, and all intraclass correlation coefficient values exceeded 87%.
Conclusions
The iOC/OrthoCAD system can be used to measure tooth widths and calculate Bolton ratios with clinically acceptable accuracy and excellent reliability and reproducibility. It appears to be a sound orthodontic aid.
Successful orthodontic treatment requires detailed planning and model analysis. It has been recommended that tooth widths should be measured and a Bolton analysis performed for every orthodontic patient. Doing so will allow the clinician to identify any tooth-size discrepancies that can be factored into achieving an optimal occlusal finish. Traditionally, orthodontists took alginate impressions of the patient’s teeth and cast these into stone models. Tooth widths would be measured using calipers and a Bolton analysis performed manually. Various studies have demonstrated that calipers are accurate and reliable. Therefore, they have widely been regarded as the gold standard for tooth-width measurements.
Keeping stone models presents difficulties. Casts are subject to fracture, inefficient retrieval, and loss, and they require storage space. In recent years, new digital alternatives have been introduced. An example is DigiModel (OrthoProof, Nieuwegein, The Netherlands). Alginate impressions are taken and sent to a laboratory where they are scanned using computed tomography and converted into virtual models. Naidu et al found that measurements made on DigiModels are both accurate and reliable. The latest innovation is the direct generation of 3-dimensional models with an intraoral scanner. This is a chairside unit that allows the orthodontist to scan the patient’s dentition directly using a hand-held camera. The system offers various advantages, most notably elimination of the need for impressions. A review of the literature showed that only 2 studies have tested the accuracy of intraoral scanners in orthodontics. The main finding was that digital models generated from intraoral scanners are valid and reproducible platforms from which to measure dental dimensions. However, these articles only evaluated the Lava Chairside Oral Scanner (3M ESPE, St Paul, Minn). To our knowledge, no study has assessed the iOC (Cadent, Carlstadt, NJ), which was released in 2009. The iOC uses parallel confocal imaging through a combination of laser and optical scanning to capture the dental anatomy and generate a 3-dimensional digital model. These models are then analyzed with the OrthoCAD (Cadent) software.
The aim of this study was to determine the validity, reliability, and reproducibility of tooth-width measurements and Bolton ratios made with the latter system.
Material and methods
Ethical clearance for this study was granted by the Dental Sciences Research Ethics Committee of the School of Dentistry at the University of Queensland in Australia. A power analysis estimated that the total sample size should be 30 with α = 0.05 and a power of 95%. Thirty subjects at the School of Dentistry of the University of Queensland were selected for participation; all provided informed consent.
The inclusion criteria were (1) a full complement of permanent teeth from first molar to contralateral first molar in both jaws, (2) no missing or heavily restored teeth, and (3) no teeth with large carious lesions or enamel defects that would affect the mesiodistal morphology of the crown. Models were collected using 2 methods. First, maxillary and mandibular alginate impressions were taken and poured in orthodontic stone. Casting was done within 24 hours to minimize any dimensional change of the impression material. Second, the patient’s dentition was scanned with the iOC scanner. After scanning, the electronic files were transmitted to Cadent for processing into iCAST digital models. The digital models were downloaded from the company’s Web site onto a personal computer.
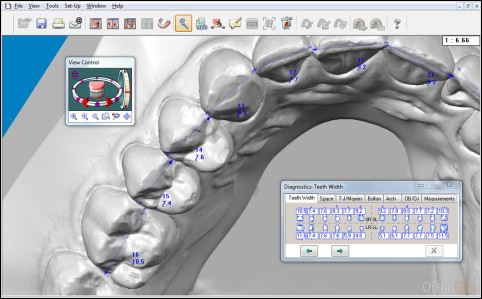
For the first method of measurement, a digital caliper (Mitutoyo, Tokyo, Japan), was used to record tooth widths from the stone models. The tips of the caliper were sharpened to allow accurate placement into the interproximal embrasures. The second method of measurement involved using OrthoCAD (version 3.5). Digital images were opened in the software, and tooth widths were measured using the “Diagnostics” tool ( Fig 1 ). To allow proper visualization of each tooth, the program’s zoom, rotation, and panning features were fully utilized. Fourteen-inch computer screens with a resolution of 1366 × 768 pixels and 32-bit color along with a standard computer mouse were used to manipulate the models and mark points. Tooth widths were measured by selecting the maximum mesiodistal diameter of each crown. This was defined as the distance between the anatomic contact areas when the teeth were correctly aligned. In addition, measurements were made parallel to the occlusal and labial/buccal surfaces. The Federation Dentaire Internationale system was used for tooth numbering. All recordings were made to the nearest 0.1 mm. An anterior Bolton ratio and an overall Bolton ratio were then calculated for each patient from these data.
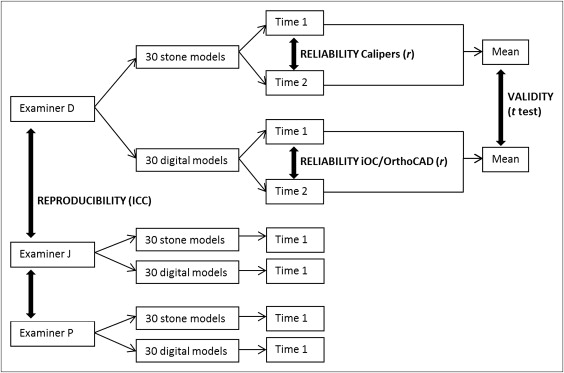
Three senior orthodontic residents from the University of Queensland participated as examiners in the study. The primary examiner (D.N.) measured all the models twice using both measurement methods. Replications were separated by 2 weeks to eliminate any recall bias. The 2 secondary examiners (Examiners J and P) measured all the models once using both measurement methods. All examiners were blinded to the identity of the models by assigning them a new random number for each measurement series.
Validity is defined as the extent to which a measurement represents the object of interest. The term accuracy is often used to describe this. In this study, validity was considered to be the extent to which the measurements from the digital system agreed with the caliper measurements. Measurements made with the caliper were taken to be the true values. Accuracy was judged as the closeness of the digital values to the caliper measurements. Reliability was considered to be the extent to which the measurements were repeatable under identical conditions. It refers to the ability of a device to produce consistent results and was gauged by the concordance between replications. Reproducibility was the closeness of agreement between independent results obtained with the same method on identical test material but under different conditions. It refers to the ability of a measurement technique to be accurately reproduced by another examiner.
Statistical analysis
All measurements were recorded in Excel (version 2010; Microsoft, Redmond, Wash). The data were analyzed using a statistical software package (version 12.1; StataCorp, College Station, Tex). To remove nonnormality within the data, each tooth-width measurement was subtracted from its mean value (ie, a patient’s tooth 16 measurement was subtracted from the mean tooth 16 measurement). A histogram of mean-centered tooth widths showed a normal distribution.
Figure 2 provides an overview of the data analysis. Measurements from the primary examiner were used to investigate validity and reliability. Validity was assessed using a 2-tailed paired t test between recordings from the digital method and the caliper. This was done for each tooth width, the mean tooth width, the overall Bolton ratio, and the anterior Bolton ratio. As with the Bonferroni adjustment, the level of significance was set at both P ≤0.05 and P ≤0.005 because of the multiple testing in our analysis. Reliability was assessed with the Pearson correlation coefficient. A Pearson r was derived to determine the association between the replicate measurements. This was done for both the manual and the digital replicates.
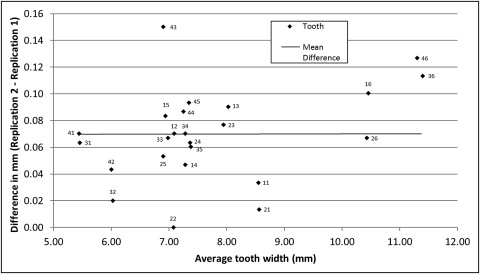
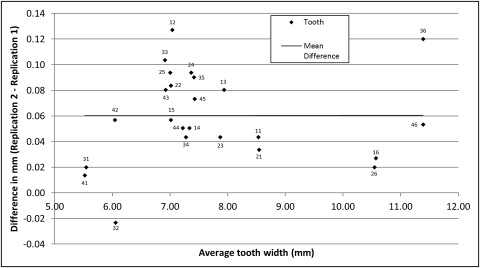
A Bland-Altman analysis was also used to investigate agreement and repeatability in further detail. According to the Bland-Altman approach, corrected standard deviations were used to account for the 2 replications in the data. The mean difference between methods, the standard deviations of differences, and the limits of agreement (defined as 2 SD on either side of the mean difference that serves to provide a practical guide of the comparability of methods) were examined.
Measurements from all 3 examiners were used to investigate reproducibility of the 2 measurement methods. Reproducibility was tested with the intraclass correlation coefficient (ICC) using a 2-way random-effects model with absolute agreement.
Results
There was a statistically significant difference between the mean tooth widths obtained with the digital and caliper methods ( P = 0.0083) for validity. Teeth measured using the digital method were, on average, 0.024 mm larger than those measured with the caliper (95% confidence interval, 0.006-0.041). Table I shows the systematic errors between the 2 methods. Statistically significant differences ( P <0.005) were found for approximately one third of the teeth. The largest mean difference was 0.117 mm at the maxillary left first molar, and the smallest mean difference was −0.003 mm at the mandibular left first molar. The variances were greatest for the maxillary first molar measurements (SD, 0.251 mm for tooth 16; SD, 0.223 mm for tooth 26) and smallest for the maxillary central incisor measurements (SD, 0.109 mm for tooth 11; SD, 0.129 for tooth 21). Of the total of 1440 differences in tooth widths between the 2 methods, only 26 values reached or surpassed 0.5 mm, an equivalent of 1.806% of the data.
| Tooth | iOC/OrthoCAD | |||||
|---|---|---|---|---|---|---|
| Caliper | Difference | SD | P value | |||
| Mean | Mean | Lower limit | Upper limit | |||
| 16 | 10.46 | 0.113 | 0.023 | 0.203 | 0.251 | 0.2917 |
| 15 | 6.95 | 0.077 | 0.02 | 0.134 | 0.159 | 0.2349 |
| 14 | 7.28 | 0.058 | 0.001 | 0.115 | 0.16 | 0.0062 ∗ |
| 13 | 8.03 | −0.085 | −0.14 | −0.03 | 0.154 | 0.0007 † |
| 12 | 7.09 | −0.045 | −0.092 | 0.002 | 0.13 | 0.7665 |
| 11 | 8.55 | −0.015 | −0.054 | 0.024 | 0.109 | <0.0001 † |
| 21 | 8.57 | −0.02 | −0.066 | 0.026 | 0.129 | 0.0002 † |
| 22 | 7.07 | −0.055 | −0.109 | −0.001 | 0.15 | 0.8723 |
| 23 | 7.95 | −0.07 | −0.124 | −0.016 | 0.151 | 0.0272 ∗ |
| 24 | 7.37 | 0.005 | −0.041 | 0.051 | 0.13 | 0.7257 |
| 25 | 6.9 | 0.11 | 0.052 | 0.168 | 0.161 | 0.0042 † |
| 26 | 10.43 | 0.117 | 0.037 | 0.197 | 0.223 | 0.1662 |
| 36 | 11.39 | −0.003 | −0.061 | 0.054 | 0.16 | 0.0002 † |
| 35 | 7.38 | 0.045 | −0.01 | 0.1 | 0.154 | <0.0001 † |
| 34 | 7.29 | −0.007 | −0.059 | 0.046 | 0.147 | 0.0063 ∗ |
| 33 | 6.98 | −0.068 | −0.132 | −0.005 | 0.178 | 0.2226 |
| 32 | 6.03 | 0.032 | −0.031 | 0.094 | 0.175 | 0.2671 |
| 31 | 5.47 | 0.082 | 0.025 | 0.139 | 0.159 | 0.0002 † |
| 41 | 5.44 | 0.078 | 0.033 | 0.123 | 0.126 | 0.0004 † |
| 42 | 6 | 0.047 | 0.001 | 0.092 | 0.128 | 0.2917 |
| 43 | 6.91 | 0.028 | −0.035 | 0.092 | 0.178 | 0.2349 |
| 44 | 7.25 | −0.022 | −0.075 | 0.032 | 0.15 | 0.0062 ∗ |
| 45 | 7.35 | 0.087 | 0.027 | 0.146 | 0.167 | 0.0007 † |
| 46 | 11.3 | 0.083 | 0.022 | 0.144 | 0.17 | 0.7665 |
| Mean difference | 0.024 | |||||
| SD (corrected) | 0.068 | |||||
| P value | 0.0083 ∗ | |||||
| Limits of agreement | −0.109-0.156 | |||||
There were statistically significant differences between Bolton ratios from the 2 methods ( P = 0.0354 and P <0.0001). The overall Bolton ratios and anterior Bolton ratios calculated from data gathered with the digital method were, on average, 0.217% and 0.911% greater, respectively, than the caliper ratios ( Table II ).
| iOC/OrthoCAD | ||||||
|---|---|---|---|---|---|---|
| Caliper | Difference | SD | P value | |||
| Mean | Mean | Lower limit | Upper limit | |||
| OBR | 91.896 | 0.217 | −0.563 | 0.997 | 0.78 | 0.0354 ∗ |
| ABR | 77.953 | 0.911 | −0.211 | 2.032 | 1.263 | <0.0001 ∗ |
The Pearson correlation between tooth-width replications showed reliability values of 0.99 for both measurement techniques. Scatter plots of the differences between replicates ( Figs 3 and 4 ) show a mean overestimation of tooth widths at the second measurement by 0.069 mm (range, 0.000-0.150 mm) when using the caliper and 0.060 mm (range, −0.023-0.127 mm) when using the digital method. Table III shows the P values for the measurement errors between replications. Approximately one third of the teeth had statistically significant differences ( P <0.005). The standard deviations of the differences were 0.035 mm for the caliper and 0.036 mm for the digital method. The correlation coefficients for repeated overall Bolton ratios were 0.93 and 0.96, and 0.93 and 0.97 for repeated anterior Bolton ratios, with the caliper and digital methods, respectively.