Introduction
The dilemma of extraction vs nonextraction treatment, along with the uncertain potential of orthodontic treatment to control vertical dimensions, still remains among the most controversial issues in orthodontics. The aim of this study was to evaluate 2 contradictory treatment protocols for hyperdivergent Class II Division 1 malocclusion regarding their effectiveness in controlling vertical dimensions.
Methods
The subjects were retrospectively selected from 2 orthodontic offices that used contrasting treatment protocols. The patients had similar hyperdivergent skeletal patterns, malocclusion patterns, skeletal ages, and sexes. Group A (29 patients) was treated with 4 first premolar extractions and “intrusive” mechanics (eg, high-pull headgear), whereas group B (28 patients) was treated nonextraction with no regard to vertical control (eg, cervical headgear, Class II elastics). Twenty-seven landmarks were digitized on lateral cephalometric radiographs before and after treatment, and 14 measurements were assessed. Geometric morphometric methods were also implemented to evaluate size and shape differences.
Results
As expected, the maxillary and mandibular molars translated mesially and the mandibular incisors uprighted in group A but remained approximately unchanged in group B. The vertical positions of the molars and the incisors were similar between groups before and after treatment, although they were altered by treatment or growth. No significant differences were observed in the posttreatment skeletal measurements between the 2 groups, including vertical variables, which remained unaltered. Permutation tests on Procrustes distances between skeletal shapes confirmed these results.
Conclusions
This study demonstrated the limitations of conventional orthodontics to significantly alter skeletal vertical dimensions. More important factors are probably responsible for the development and establishment of the vertical skeletal pattern, such as neuromuscular balance and function.
Control of vertical dimensions during orthodontic treatment is of major importance in hyperdivergent patients. Despite the many studies that have addressed this issue from various perspectives, the factors that affect vertical dimensions have not been clearly determined. Several strategies concerning treatment plan considerations or treatment mechanics have been proposed to control vertical dimensions or guide growth in hyperdivergent patients. These include extraction treatment to move molars forward and reduce the “wedge-type effect,” high-pull headgear (instead of low-pull headgear), Nance appliance, palatal bar, posterior bite-block or posterior magnet to control vertical molar movement or even intrude molars. In contrast, treatment approaches in low-angle patients might include nonextraction treatment, low-pull headgear, and extensive use of Class II elastics, which are believed to favor vertical development.
Recent research has disputed whether conventional orthodontics can significantly influence vertical dimensions by demonstrating that some of the considered “extrusive” treatment plans or mechanics are not contraindicated in hyperdivergent patients, since they produce similar results compared with the controls or with “intrusive” protocols. However, these retrospective studies examined the effect of either 1 protocol that was not always compared with controls or 2 protocols differentiated by only 1 specific part of the treatment plan.
The purpose of this retrospective cohort study was to evaluate the effect of 2 contrasting treatment strategies on the vertical dimensions of hyperdivergent Class II Division 1 patients with similar pretreatment skeletal patterns, malocclusions, skeletal maturities, and sex distributions. The null hypothesis was that there is no difference in posttreatment skeletal characteristics of hyperdivergent Class II Division 1 patients treated with 4 first premolar extractions and conventional “intrusive” mechanics compared with patients treated nonextraction, with mechanics that are considered “extrusive.”
Material and methods
The files of 2 orthodontic offices, each operated by 1 clinician, were searched to identify appropriate subjects. Both orthodontists had more than 15 years of practice experience and similar educational backgrounds, including certification from accredited orthodontic specialty programs in the United States. These clinicians were selected because they applied different, contrasting treatment protocols to treat a Class II hyperdivergent skeletal pattern regarding the management of the vertical dimensions.
The inclusion criteria were (1) white patients who finished treatment between 1998 and 2008; (2) hyperdivergent Class II Division 1 skeletal pattern (GoGn-SN, >32°; ANB, >3.5°; overjet, >4 mm); (3) dental Class II, defined as more than a half-cusp molar discrepancy on both sides and more than 4 mm of overjet; (4) mild to moderate pretreatment crowding (<6 mm in each arch); (5) late mixed or permanent dentition; (6) adequate growth potential at the start of treatment (skeletal maturation stage CS1 to CS4, as determined by the cervical vertebral maturation [CVM] method ); and (7) 1-phase treatment with fixed appliances.
No other inclusion criteria, such as cooperation or outcome of treatment, were used. However, all subjects were successfully treated (Class I molar and canine relationship, normal overbite and overjet). Two patients who discontinued treatment and 1 patient with incomplete records were not included in the study.
Exclusion criteria consisted of (1) patients with missing teeth, congenital malformations, systemic diseases, or syndromic conditions; and (2) when siblings who fulfilled the inclusion criteria were identified (2 cases), only 1 was randomly selected.
A total of 57 Class II Division 1 young adolescent patients with hyperdivergent facial type were identified. Group A, from the first orthodontic office, was composed of 29 patients treated with 4 first premolar extractions and “intrusive” mechanics. Group B, from the second office, was composed of 28 patients treated without extractions and “extrusive” mechanics ( Table I ).
| Group A (n = 29) | Group B (n = 28) | t test P value | |||
|---|---|---|---|---|---|
| Mean (SD) | Range | Mean (SD) | Range | ||
| Age at T1 (y) | 11.8 (0.9) | 10.2–13.0 | 11.0 (1.1) | 9.5–13.0 | 0.002 ∗ |
| Age at T2 (y) | 15.0 (1.3) | 12.7–16.8 | 13.4 (1.1) | 11.4–15.1 | 0.000 ∗ |
| Treatment time (y) | 3.2 (0.6) | 2.1–4.4 | 2.4 (0.8) | 1.5–3.9 | 0.000 ∗ |
The different treatment protocols applied by the 2 clinicians reflected 2 contradictory therapeutic philosophies regarding the potential of conventional orthodontic treatment to control or alter vertical dimensions. The decision for extractions was primarily based on the idea of better control or reduction of the vertical dimension by mesial molar movement: the wedge-effect concept. Furthermore, group A was treated without extrusive mechanics, such as Class II elastics, low-pull headgear, or anterior biteplates. Contrarily, Nance and Goshgarian palatal arches were extensively used. On the other hand, group B was treated as a normodivergent group, with low-pull headgear for every patient, anterior biteplates, and Class II elastics or posterior crossbite elastics, when necessary. No intrusive mechanics such as posterior bite-blocks or additional measures to control molar extrusion, such as Nance and Goshgarian palatal arches, were used in this group. Interproximal reduction of the mandibular incisors was used when needed to prevent flaring of these teeth during correction of crowding. All patients were treated with full preadjusted edgewise appliances, including the second molars (Roth prescription). No patient received skeletal anchorage devices.
Lateral cephalometric radiographs, obtained routinely within 1 month before treatment (T1) and immediately after removal of the appliances (T2), were scanned at 150 dpi, and 28 landmarks ( Fig 1 ) that represented skeletal and dental tissue structures were digitized on screen by using Viewbox 4 software (dHAL Software, Kifissia, Greece). All radiographs were of good quality and were taken in centric occlusion, with lips in the resting position. Also, they included a reference ruler and were corrected for the magnification factor.
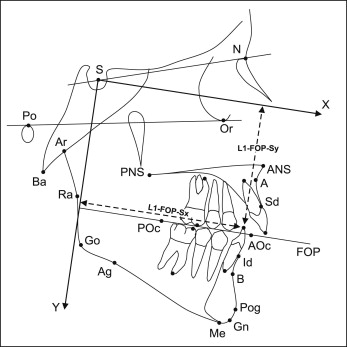
Three reference lines and 14 cephalometric measurements representing skeletal tissues and dental components were chosen for the cephalometric analysis ( Fig 1 ). The position of the teeth was evaluated according to a reference system starting from sella, with the x-axis parallel and the y-axis perpendicular to the functional occlusal plane. This system was chosen as the most appropriate for testing the wedge-effect concept and the influence of molar position on lower facial height. Alternatively, another reference system, also starting from sella, but with the x-axis parallel and the y-axis perpendicular to the Frankfort horizontal (FH), was used. The results from the second system are not presented, since they were similar to those obtained from the first system.
Kolmogorov-Smirnov tests showed that the cephalometric measurements did not depart from a normal distribution, so parametric tests were used. Pretreatment and posttreatment conditions, and treatment changes were determined for the samples; paired or unpaired 2-sample t tests were used to determine significant differences between groups and to evaluate changes caused by treatment or growth (StatsDirect, StatsDirect, Cheshire, United Kingdom). Differences in pretreatment and posttreatment CVM stages were assessed by the nonparametric Mann-Whitney U test (PAST software ). Furthermore, 2-dimensional geometric morphometric methods including Procrustes superimposition were implemented to identify and visualize shape differences between the groups. The geometric morphometric approach treats the whole landmark configuration as a single unit and describes its shape comprehensively, overcoming some limitations of traditional cephalometry. Also, Procrustes superimposition removes the parameters of size, position, and orientation and is thus different from conventional cephalometric measurements or superimpositions. Therefore, comparisons with cephalometric measurements presented in the tables must be done in this context. Shape differences were tested for significance by permutation tests on Procrustes distances between group means (Viewbox 4). They were assessed for the whole shape (skeletal and dental landmarks) and for skeletal landmarks only. Size differences between groups were assessed by unpaired t tests on the logarithm of centroid size of skeletal configurations only (Viewbox 4). Because linear cephalometric measurements are affected by size differences, the measurements related to tooth position and the ANS-Me distance were adjusted according to centroid size to perform valid comparisons between groups A and B at T1 and T2. Differences between the groups in the amount of growth from T1 to T2 were assessed by evaluating centroid size changes with unpaired t tests (StatsDirect).
To estimate the error of the method, 20 cephalometric radiographs (5 from each group) were selected randomly and were redigitized and reanalyzed 30 days later by the same examiner (N.G.). Random error was evaluated with Dahlberg’s formula. Systematic errors were evaluated by paired t tests applied to the cephalometric measurements and to the x and y coordinates of all points. Because of the large number of t tests needed, the Bonferroni adjustment was applied to prevent type I error. Finally, to estimate the error of the CVM method, all radiographs were reevaluated 30 days later by the same examiner (N.G.). Random intraobserver error was evaluated by the weighted kappa statistic regarding all subjects. Systematic error of the CVM method was estimated by using the Wilcoxon signed rank test between repeated measurements (StatsDirect).
Results
The average random error of the x and y point coordinates was 0.32 mm (range, 0.17–0.46 mm). Concerning cephalometric measurements, the average random errors were 0.40 mm (range, 0.32–0.57 mm) for linear measurements and 0.25° (range, 0.10°–0.52°) for angular measurements. Regarding the CVM method, random intraobserver error was estimated by the weighted kappa statistic and showed almost perfect agreement between the 2 evaluations (κ = 0.92). No systematic error at P = 0.01 was detected for any point coordinate or cephalometric measurement and at P = 0.05 for the assessment of skeletal maturation stage.
The 2 groups included balanced numbers of male and female patients (group A, 13 boys, 16 girls; group B, 14 boys, 14 girls). Skeletal age at the initiation of treatment was similar between the 2 groups ( Table II ), but chronologic age and treatment duration were slightly different ( Table I ). Although extraction treatment lasted 9 months longer compared with nonextraction treatment ( Table I ), differences in skeletal age at the end of treatment were marginally nonsignificant ( Table II ). Differences in size between groups were marginally significant ( P = 0.08) at T1 and clearly significant ( P = 0.02) at T2, with group A larger in both cases. However, the amount of growth in the groups from T1 to T2 was similar ( P = 0.18) ( Table III ).
| Group A (n = 29) | Group B (n = 28) | Mann-Whitney U-test | |||
|---|---|---|---|---|---|
| Median | Range | Median | Range | P value | |
| CVM stage at T1 | 2 | 1–4 | 2 | 1–4 | 0.460 |
| CVM stage at T2 | 5 | 3–6 | 4 | 2–6 | 0.062 |
| Group A (n = 29) | Group B (n = 28) | Difference | P value | |
|---|---|---|---|---|
| Mean (SD) | Mean (SD) | |||
| Centroid size at T1 (mm) | 181.6 (8.6) | 177.8 (7.8) | 2.14% | 0.083 |
| Centroid size at T2 (mm) | 192.2 (10.9) | 186.5 (7.0) | 3.06% | 0.024 ∗ |
| Centroid size T2–T1 (mm) | 10.6 (6.0) | 8.8 (3.9) | 20.45% | 0.179 |
The hyperdivergent pattern of the whole sample was confirmed by GoGn-SN (mean, 38.8°; SD, 3.8°) and FMA (mean, 31.5°; SD, 4.1°) and was corroborated by ANS-Me (mean, 64.4 mm; SD 4.9 mm) measurements. The pretreatment ratio of lower anterior facial height to total facial height was not considerably increased (mean, 55.5%; SD, 2.2%) because of the orientation of the jaw complex, which was rotated clockwise relative to the FH. Thus, the value of lower anterior facial height appeared to be decreased when measured by tangent projections of landmarks N, ANS, and Me on a line perpendicular to FH. The cephalometric data and intergroup comparisons at T1 are shown in Table IV . No skeletal variable differed significantly at T1. After size adjustment of group B to the same centroid size as group A, statistically significant differences were identified for the 2 dental parameters related to the anteroposterior position of the molars. There was marginally significant difference ( P = 0.058) in the horizontal position of the mandibular incisors. These teeth were approximately 2 mm more forwardly positioned in group A. The horizontal position of the maxillary incisors and the vertical positions of the incisors and the molars were similar between the groups.
| Measurement | Group A | Group B | P value | P value, size-adjusted † | |
|---|---|---|---|---|---|
| Mean (SD) | Mean (SD) | Mean (SD), size-adjusted † | |||
| Skeletal | |||||
| GoGn-SN (°) | 38.4 (3.8) | 39.1 (3.8) | – | 0.451 | – |
| Lower/total facial height (%) | 55.5 (2.2) | 55.5 (2.1) | – | 0.894 | – |
| FMA (°) | 31.3 (4.2) | 31.6 (4.0) | – | 0.779 | – |
| ANB (°) | 5.8 (1.8) | 6.0 (1.8) | – | 0.728 | – |
| ANS-Me (mm) | 64.7 (4.9) | 64.0 (4.9) | 65.3 (4.9) | 0.588 | 0.615 |
| Dental | |||||
| IMPA (°) | 95.1 (7.5) | 93.0 (7.1) | – | 0.291 | – |
| L1-FOP-Sx (mm) | 78.1 (3.6) | 74.2 (5.0) | 75.8 (5.16) | 0.002 ∗ | 0.058 |
| L1-FOP-Sy (mm) | 45.2 (6.6) | 44.7 (3.9) | 45.7 (4.0) | 0.763 | 0.720 |
| L6-FOP-Sx (mm) | 50.6 (3.3) | 47.2 (4.6) | 48.2 (4.7) | 0.002 ∗ | 0.030 ∗ |
| L6-FOP-Sy (mm) | 48.1 (6.1) | 47.5 (3.5) | 48.5 (3.6) | 0.651 | 0.758 |
| U1-FOP-Sx (mm) | 84.8 (3.6) | 82.0 (4.9) | 83.8 (5.0) | 0.0197 ∗ | 0.402 |
| U1-FOP-Sy (mm) | 47.0 (6.7) | 47.0 (4.2) | 48.0 (4.3) | 0.963 | 0.535 |
| U6-FOP-Sx (mm) | 51.2 (3.2) | 47.9 (4.5) | 48.9 (4.6) | 0.002 ∗ | 0.030 ∗ |
| U6-FOP-Sy (mm) | 48.6 (6.1) | 48.1 (3.4) | 49.1 (3.5) | 0.707 | 0.690 |
† Linear measurements of group B were scaled to a centroid size equal to that of group A.
Descriptive analyses and statistics used for assessing the differences in the T2 cephalometric measurements are given in Table V . IMPA and the anteroposterior position of the molars differed significantly at T2.
| Measurement | Group A | Group B | P value | P value, size-adjusted † | |
|---|---|---|---|---|---|
| Mean (SD) | Mean (SD) | Mean (SD), size- adjusted † | |||
| Skeletal | |||||
| GoGn-SN (°) | 38.2 (4.1) | 39.3 (4.5) | – | 0.369 | – |
| Lower/total facial height (%) | 55.6 (2.3) | 55.6 (2.0) | – | 0.996 | – |
| FMA (°) | 31.1 (4.7) | 31.7 (4.3) | – | 0.644 | – |
| ANB (°) | 4.7 (1.9) | 4.0 (1.9) | – | 0.200 | – |
| ANS-Me (mm) | 68.7 (5.5) | 67.3 (4.9) | 69.3 (5.1) | 0.315 | 0.643 |
| Dental | |||||
| IMPA (°) | 90.0 (6.3) | 93.9 (6.7) | – | 0.028 ∗ | – |
| L1-FOP-Sx (mm) | 76.6 (4.3) | 75.9 (5.6) | 78.2 (5.8) | 0.614 | 0.228 |
| L1-FOP-Sy (mm) | 53.6 (6.1) | 52.7 (3.8) | 54.3 (3.9) | 0.525 | 0.588 |
| L6-FOP-Sx (mm) | 55.4 (3.9) | 48.9 (5.3) | 50.4 (5.4) | 0.000 ∗ | 0.000 ∗ |
| L6-FOP-Sy (mm) | 55.0 (6.0) | 53.6 (3.6) | 55.3 (3.7) | 0.292 | 0.853 |
| U1-FOP-Sx (mm) | 79.8 (4.4) | 78.9 (5.5) | 81.3 (5.6) | 0.528 | 0.240 |
| U1-FOP–Sy (mm) | 55.9 (6.1) | 54.3 (3.7) | 56.0 (3.9) | 0.257 | 0.936 |
| U6-FOP-Sx (mm) | 53.7 (4.0) | 47.0 (5.3) | 48.4 (5.5) | 0.000 ∗ | 0.000 ∗ |
| U6-FOP-Sy (mm) | 55.6 (6.0) | 54.2 (3.6) | 55.8 (3.7) | 0.282 | 0.866 |
† Linear measurements of group B were scaled to a centroid size equal to that of group A.
The changes in linear and angular measurements brought about by treatment or growth (T2–T1) and the relevant statistics are presented in Table VI . Comparisons within each group showed that no skeletal parameters, except ANB and ANS-Me, were significantly altered by treatment or growth. In contrast, almost all dental parameters were significantly different at T2 compared with the T1 values.
| Measurement | Group A: T2–T1 | Group B: T2–T1 | t test | ||||
|---|---|---|---|---|---|---|---|
| Mean | SD | P value | Mean | SD | P value | P value | |
| Skeletal | |||||||
| GoGn-SN (°) | −0.15 | 2.50 | 0.749 | 0.14 | 1.74 | 0.675 | 0.616 |
| Lower/total facial height (%) | 0.10 | 0.89 | 0.545 | 0.17 | 1.49 | 0.541 | 0.822 |
| FMA (°) | −0.19 | 2.53 | 0.685 | 0.06 | 2.45 | 0.906 | 0.709 |
| ANB (°) | −1.13 | 1.56 | 0.000 ∗ | −1.96 | 1.60 | 0.000 ∗ | 0.052 |
| ANS-Me (mm) | 4.04 | 4.47 | 0.000 ∗ | 3.35 | 3.19 | 0.000 ∗ | 0.506 |
| Dental | |||||||
| IMPA (°) | −5.05 | 5.24 | 0.000 ∗ | 0.89 | 7.56 | 0.539 | 0.001 ∗ |
| L1-FOP-Sx (mm) | −1.47 | 2.68 | 0.006 ∗ | 1.72 | 2.67 | 0.002 ∗ | 0.000 ∗ |
| L1–FOP-Sy (mm) | 8.45 | 5.94 | 0.000 ∗ | 8.02 | 4.26 | 0.000 ∗ | 0.754 |
| L6-FOP-Sx (mm) | 4.87 | 3.25 | 0.000 ∗ | 1.76 | 2.64 | 0.001 ∗ | 0.000 ∗ |
| L6-FOP-Sy (mm) | 6.92 | 4.83 | 0.000 ∗ | 6.13 | 3.45 | 0.000 ∗ | 0.481 |
| U1-FOP-Sx (mm) | −5.01 | 3.05 | 0.000 ∗ | −3.12 | 3.12 | 0.000 ∗ | 0.024 ∗ |
| U1-FOP-Sy (mm) | 8.87 | 5.32 | 0.000 ∗ | 7.39 | 4.19 | 0.000 ∗ | 0.248 |
| U6-FOP-Sx (mm) | 2.46 | 3.24 | 0.000 ∗ | −0.86 | 3.26 | 0.172 | 0.000 ∗ |
| U6-FOP-Sy (mm) | 6.97 | 4.89 | 0.000 ∗ | 6.04 | 3.49 | 0.000 ∗ | 0.412 |
Stay updated, free dental videos. Join our Telegram channel
VIDEdental - Online dental courses


