Introduction
The aim of this study was to distinguish between orthodontic patients with skeletal Class III malocclusions requiring surgery and those not requiring surgery by conducting a receiver operating characteristic analysis of cephalometric variables.
Methods
We used lateral cephalometric radiographs of 80 subjects (40 nonsurgical and 40 surgical patients) with Class III malocclusions and obtain 25 cephalometric measurements using computerized cephalometry. Of these, 14 measurements showed statistically significant differences between the 2 groups. Receiver operating characteristic analysis was used to determine the ability of the 14 cephalometric measurements in distinguishing between the 2 groups. Six statistically validated and clinically relevant measurements were used to obtain the optimum discriminant effectiveness.
Results
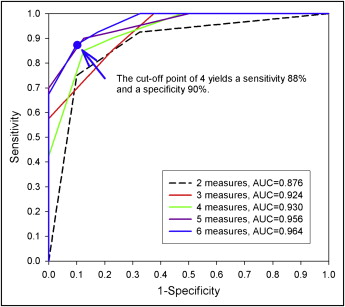
For a Class III malocclusion patient with any 4 of these 6 measurement criteria, the sensitivity was 88% and the specificity was 90% in determining the need for surgical treatment: overjet, ≤–4.73 mm; Wits appraisal, ≤–11.18 mm; L1-MP angle, ≤80.8°; Mx/Mn ratio, ≤65.9%; overbite, ≤–0.18 mm; and gonial angle, ≥120.8°.
Conclusions
We selected 6 cephalometric measurements as the minimum number of discriminators required to obtain the optimum discriminant effectiveness of diagnosis between surgical and nonsurgical treatment of skeletal Class III malocclusions.
A Class III malocclusion is a difficult anomaly to correct, especially with only orthodontic means. This class of malocclusion is a common clinical problem in orthodontic patients of Asian or Mongoloid descent. A Class III malocclusion is largely a skeletal type of occlusal variation (63%-81%). These skeletal abnormalities result from growth disharmony between the maxilla and the mandible, and thus produce a concave facial profile. Patients with skeletal Class III malocclusions exhibit maxillary retrusion, mandibular protrusion, or a combination of both.
There are 3 main treatment options for skeletal Class III malocclusions: growth modification, orthodontic therapy, and orthognathic surgery combined with orthodontic treatment. Maxillofacial growth modification with dentofacial orthopedic appliances is an effective method for resolving skeletal Class III jaw discrepancies in children. Correcting this problem in adults requires orthognathic surgery in conjunction with orthodontic treatment.
Receiver operating characteristic (ROC) analysis is an excellent method for evaluating and comparing the performance of diagnostic tests. Wardlaw et al used ROC analysis to evaluate the relationships between several cephalometric measurements and anterior open bite. They found that the overbite depth indicator had the highest diagnostic value in discriminating between patients with and without open bite.
Not all adult Class III patients are candidates for surgical correction. Patient assessment and selection are the main issues in diagnosis and treatment planning. The purpose of this study was to distinguish between surgery candidates (surgical group) and nonsurgery candidates (nonsurgical group) with skeletal Class III malocclusions by using ROC analysis of cephalometric variables.
Material and methods
The subjects included 40 men and 40 women with Class III malocclusions, whose mean age before treatment was 23 years (range, 18-34 years). The criteria for inclusion in the study were a Class III molar relationship, a negative overjet, an ANB angle less than 0°, and a Wits appraisal less than –1 mm. Consecutive patients were selected and divided into 2 groups, each with 20 men and 20 women. Those who had received orthodontic therapy alone made up the nonsurgical group; those who had required orthognathic surgery of mandibular setback combined with orthodontic treatment comprised the surgical group. Some patients were excluded from the study because complete records were lacking. We also excluded subjects with craniofacial syndromes, cleft lip or palate, and trauma history.
The goals of orthodontic treatment, with or without orthognathic surgery, are to achieve harmonious facial esthetics and a functional occlusion, but soft-tissue changes also play an important role in evaluating treatment effects. The Taiwan Board of Orthodontics introduced an objective grading system for assessing posttreatment dental casts and panoramic radiographs similar to that of the American Board of Orthodontics and supplemented by lateral cephalographs. The Taiwan Board of Orthodontics objective grading system evaluates 20 criteria. In this retrospective study with this grading system, we evaluated orthodontic and orthognathic surgical patients who were consecutively completed in 2006 to 2009. The mean scores for orthodontic patients were 78%. There were 1 patient in the “slightly improved” category and no patients in the “worse” or “no improvement” categories. The mean scores for orthognathic surgical patients were 74%. There were no patients in the “worse,” “no improvement,” or “slightly improved” categories. A mean score of more than 70% represents a high standard of treatment in the “greatly improved” category. The mean scores of this study indicate excellent-to-good treatment results for both groups.
In this study, we used lateral cephalometric radiographs obtained before treatment. A correction of 10% was made for the magnification of the linear measurements from each cephalogram. Thirty cephalometric landmarks on the craniofacial complex were identified and digitized ( Fig 1 ). A computerized cephalometric system, Winceph (version 8.0, Rise, Sendai, Japan), was used to obtain 25 cephalometric measurements, including 12 angular, 9 linear, and 4 ratio variables ( Table I ). Descriptive statistics, including means, standard deviations, and Student t tests results, were computed for each measurement ( Table II ). We selected 25 cephalometric measurements that were used in previous studies. The Bonferroni adjustment with an alpha level of 0.002 (0.05/25) was applied as a multiple-comparison correction when several statistical tests were performed simultaneously. The most suitable measurements were statistically validated and clinically relevant. Measurements that were statistically different between the 2 groups with the 2-sample t test and the Bonferroni adjustment were further analyzed by the ROC curve analysis.
| Linear variables (mm) | Angular variables (°) | Ratio variables (%) |
|---|---|---|
| S-N | SNA | PFH/AFH |
| A–Nv | SNB | Mx/Mn ratio |
| B–Nv | ANB | G-Sn/Sn-Me |
| Pg–Nv | NAPg | Sn-Stoms/Stomi-Me’ |
| Symphysis width | SN-MP | |
| Wits appraisal | PP-MP | |
| Overjet | Gonial angle | |
| Overbite | U1-PP | |
| Si–(Li–Pg’) | L1-MP | |
| U1–L1 | ||
| G–Sn–Pg’ | ||
| H–angle |
| Variable | Nonsurgical group | Surgical group | Mean | t test |
|---|---|---|---|---|
| Mean ± SD | Mean ± SD | Difference | P value | |
| S-N (mm) | 66.06 ± 4.17 | 65.17 ± 3.74 | −0.89 | 0.3167 |
| SNA (°) | 81.57 ± 3.44 | 82.57 ± 4.03 | 1.00 | 0.2349 |
| SNB (°) | 85.44 ± 3.96 | 87.65 ± 3.78 | 2.21 | 0.0126 |
| ANB (°) | −3.87 ± 2.18 | −5.29 ± 3.05 | −1.43 | 0.0185 |
| NAPg (°) | −7.91 ± 4.88 | −11.05 ± 6.43 | −3.14 | 0.0162 |
| Mx/Mn ratio (%) | 68.70 ± 3.33 | 64.03 ± 3.15 | −4.67 | <0.0001 |
| A–Nv (mm) | −0.56 ± 3.88 | −0.10 ± 3.41 | 0.47 | 0.5643 |
| B–Nv (mm) | 5.21 ± 5.77 | 9.25 ± 6.27 | 4.03 | 0.0037 |
| Pg–Nv (mm) | 6.05 ± 5.94 | 11.10 ± 7.47 | 5.50 | 0.0012 |
| Symphysis width (mm) | 7.50 ± 1.46 | 6.05 ± 1.17 | −1.45 | <0.0001 |
| SN–MP (°) | 30.91 ± 6.38 | 35.92 ± 6.03 | 5.01 | 0.0005 |
| PP–MP (°) | 21.37 ± 5.91 | 27.38 ± 5.42 | 6.01 | <0.0001 |
| Gonial angle (°) | 119.55 ± 7.39 | 127.67 ± 6.11 | 8.13 | <0.0001 |
| PFH/AFH (%) | 68.24 ± 5.26 | 64.14 ± 4.81 | −4.10 | 0.0005 |
| U1–PP (°) | 122.58 ± 6.11 | 121.61 ± 7.33 | −0.97 | 0.5245 |
| L1–MP (°) | 86.94 ± 6.82 | 77.07 ± 7.07 | −9.87 | <0.0001 |
| U1–L1 (°) | 129.30 ± 7.87 | 134.12 ± 11.44 | 4.82 | 0.0313 |
| Wits appraisal (mm) | −9.67 ± 2.76 | −15.27 ± 4.25 | −5.06 | <0.0001 |
| Overjet (mm) | −3.55 ± 1.20 | −7.02 ± 2.45 | −3.47 | <0.0001 |
| Overbite (mm) | 2.95 ± 2.09 | 0.37 ± 2.70 | −2.58 | <0.0001 |
| G–Sn–Pg’ (°) | −4.03 ± 2.96 | −6.05 ± 4.07 | −2.03 | 0.0130 |
| G–Sn/Sn–Me’ (%) | 101.20 ± 9.08 | 92.89 ± 7.98 | −8.31 | <0.0001 |
| Sn–Stoms/Stomi–Me’ (%) | 44.55 ± 5.57 | 41.30 ± 4.22 | −3.25 | 0.0042 |
| Si–(Li–Pg’) (mm) | 3.28 ± 0.81 | 2.26 ± 1.04 | −1.03 | <0.0001 |
| H–angle (°) | 11.26 ± 3.06 | 7.69 ± 4.13 | −3.57 | <0.0001 |
Systematic measurement errors were estimated by means of paired Student t tests, and the random method error ( ME ) was quantified with Dahlberg’s formula, ME = √Σd2/2n, where d is the difference between duplicate measurements and n is the number of double measurements.
We study used the ROC analysis and the area under the curve (AUC) to determine the set of cephalometric measurements for the best discrimination between orthodontic therapy and orthognathic surgery. The ROC curve is a plot of sensitivity (true positive rate) on the y-axis and 1–specificity (false positive rate) on the x-axis. The different points on the curve correspond to different cutoff points used to designate the surgery group. The AUC is generally considered a reasonable summary of the overall diagnostic accuracy of the continuous variables. In general, for 2 variables, the variable with higher AUC is considered a better indicator for the surgery group. For each ROC curve, a cutoff point that yields the best combination of sensitivity and specificity can be identified to provide a recommendation for surgery. All data analyses were performed by using SAS software (version 9, SAS Institute, Cary, NC).
Results
To assess errors in the cephalometric digitizing, 1 investigator (C.Y.L.) digitized 20 randomly selected lateral cephalographs. The same investigator redigitized the same cephalographs after an interval of 2 weeks. The method errors between the double measurements were analyzed. No significant differences appeared between the 2 sets of repeated measurements. The method errors were between 0.16 and 0.29 mm for linear measurements, between 0.26° and 0.60° for angular measurements, and between 0.14% and 0.30% for ratios. The intraclass correlation coefficients were from 0.973 to 0.990. The reliability was high for all values. Table II shows the means and standard deviations of the 25 cephalometric measurements of both groups. Of these, 14 measurements were significantly different between the surgical and nonsurgical groups (overjet, Wits appraisal, L1-MP, Mx/Mn ratio (Cd-A/Cd-Gn), gonial angle, overbite, Si-(Li-Pg’), PP-MP, G-Sn/Sn-Me’, symphysis width, H-angle, PFH/AFH, SN-MP, Pg-Nv) ( P <0.002 [0.05/25]), based on the Bonferroni multiple-comparisons procedure. Table III shows the results of further computing the AUCs based on these 14 original measurements (range, 0.694-0.908). Their corresponding cutoff points, which yielded the highest values of sensitivity + specificity, were determined. The 14 cephalometric measurements were dichotomized into 2 parts based on the cutoff points. Depending on the clinical criteria, the part with a tendency to surgery was given a score of 1 and the other was given a score of 0. For example, in the overjet measurement, participants with a measure of less than or equal to –4.73 mm were considered to have a tendency for surgery and were given a score of 1. Hence, each of the 14 measurements was transferred into a new score of 1 and 0. The next step was to determine the optimal number of dichotomized measurements for inclusion in the final scoring system. The 14 dichotomized measurements were added 1 by 1 from the measurements with highest to lowest AUC values. Table IV shows the score systems with measurements 2 through 14 with their corresponding AUC values. Although higher AUCs would have better diagnostic accuracy, the AUCs after 6 dichotomized measurements were not greatly changed (0.96 to 0.97). Hence, a scoring system based on 6 dichotomized measurements (overjet, Wits appraisal, L1-MP, Mx/Mn ratio, overbite, and gonial angle) provided an acceptable AUC (0.96) and a feasible number (6) of measurements for the scoring system. For the scoring system of 6 dichotomized measurements, the possible scores of 0 to 6 corresponded to 0 to 6 measurements with values within the part of score 1 (tendency for surgery) in Table III .
| Variable | AUC | Cutoff point | Score 1 | Score 0 | Sensitivity | Specificity |
|---|---|---|---|---|---|---|
| Overjet (mm) | 0.908 | −4.73 mm | ≤−4.73 mm | >−4.73 mm | 0.825 | 0.850 |
| Wits appraisal | 0.857 | −11.18 mm | ≤−11.18 mm | >−11.18 mm | 0.850 | 0.725 |
| L1-MP | 0.848 | 80.80° | ≤80.80° | >80.80° | 0.750 | 0.825 |
| Mx/Mn ratio | 0.840 | 65.90% | ≤65.90% | >65.90% | 0.750 | 0.775 |
| Overbite | 0.799 | −0.18 mm | ≤−0.18 mm | >−0.18 mm | 0.600 | 0.975 |
| Gonial angle | 0.791 | 120.80° | ≥120.80° | <120.80° | 0.925 | 0.600 |
| Si-(Li-Pg’) | 0.776 | −2.73 mm | ≤−2.73 mm | >−2.73 mm | 0.675 | 0.725 |
| G-Sn/Sn-Me’ | 0.772 | 97.50% | ≤97.50% | >97.50% | 0.800 | 0.675 |
| Symphysis width | 0.771 | 6.55 mm | ≤6.55 mm | >6.55 mm | 0.675 | 0.750 |
| PP-MP | 0.769 | 25.70° | ≥25.70° | <25.70° | 0.700 | 0.750 |
| H–angle | 0.746 | 7.60° | ≤7.60° | >7.60° | 0.525 | 0.875 |
| PFH/AFH | 0.710 | 66.00% | ≤66.00% | >66.00% | 0.675 | 0.650 |
| Pg-Nv | 0.696 | 10.09 mm | ≥10.09 mm | <10.09 mm | 0.600 | 0.800 |
| SN-MP | 0.694 | 30.90° | ≥30.90° | <30.90° | 0.875 | 0.525 |
| Number of cumulated top–ranked cephalometric measurements | Measurements | AUC |
|---|---|---|
| 2 | Overjet and Wits appraisal | 0.876 |
| 3 | Above measurements plus L1–MP | 0.924 |
| 4 | Above measurements plus Mx/Mn ratio | 0.930 |
| 5 | Above measurements plus overbite | 0.956 |
| 6 | Above measurements plus gonial angle | 0.964 |
| 7 | Above measurements plus Si–(Li–Pg’) | 0.964 |
| 8 | Above measurements plus PP–MP | 0.968 |
| 9 | Above measurements plus G–Sn/Sn–Me’ | 0.968 |
| 10 | Above measurements plus symphysis width | 0.963 |
| 11 | Above measurements plus H–angle | 0.976 |
| 12 | Above measurements plus PFH/AFH | 0.972 |
| 13 | Above measurements plus Pg-Nv | 0.977 |
| 14 | Above measurements plus SN-MP | 0.973 |
Using the cutoff points in Table III to dichotomize each of the 14 cephalometric measurements, the optimal combination of sensitivities and specificities is shown in Table III . Since no single measurement can have satisfactory classification performance, a scoring system that combined cephalometric measurements was then compared and analyzed ( Table IV and Fig 2 ). Table V shows the sensitivity and specificity of scores 0 to 6. A score of 4 with the highest value of sensitivity + specificity appeared to be the cutoff point, indicating the best combination of sensitivity (88%) and specificity (90%), of the requirement for surgical treatment ( Fig 2 ).