Introduction
The purpose of this study was to compare the skeletal and dental effects of 2 intrusion systems involving mini-implants and the Connecticut intrusion arch in patients with deepbites.
Methods
The study sample consisted of 45 adults (26 women, 19 men) with deepbites. They were divided into 3 groups: 2 treatment groups and 1 untreated control group (15 subjects in each group). The Connecticut intrusion arch and the implant groups underwent maxillary incisor intrusion with Connecticut intrusion arches and a mini-implant system, respectively. During the 7-month study period, no other treatment was performed with the exception of maxillary incisor intrusion.
Results
The mean amounts of genuine intrusion were 2.20 mm (0.31 mm per month) in the Connecticut intrusion arch group and 2.47 mm (0.34 mm per month) in the implant group. No statistically significant differences were found in the extent of maxillary incisor intrusion between the 2 intrusion systems ( P >0.05). Both systems led to protrusion and intrusion of the maxillary incisors ( P <0.05), and protrusion and extrusion of the mandibular incisors ( P <0.05). In the Connecticut intrusion arch group, the maxillary molars were extruded by moving the crown distally and the root mesially. The 2 intrusion systems were statistically different in the extent of alterations in the axial inclinations of the maxillary molars ( P <0.05).
Conclusions
Both the Connecticut intrusion arch and the mini-implant intrusion systems successfully intruded the 4 maxillary incisors. Although the movement of the maxillary molars led to the loss of sagittal and vertical anchorages during intrusion of the incisors in the Connecticut intrusion arch group, these anchorages were maintained in the implant and control groups.
Deepbites can affect a person’s esthetic appearance and smile. Anterior deepbites caused by overeruption of the maxillary incisors can be determined by using lateral cephalometric radiographs. If the lower lip covers more than 4 mm of the maxillary central incisors on a patient’s lateral cephalometric radiographs, it is the result of maxillary incisor overeruption.
Depending on the diagnosis and treatment objectives, a deep overbite can be corrected by intruding the incisors, extruding the buccal segments, or combining these treatments. Extrusion of posterior teeth drops the mandible downward and backward, and the condyle assumes a new position in the temporomandibular joint articulation. If equilibrium is achieved between function, muscles, and the temporomandibular joint after orthodontic treatment by remodeling and readaptation, the extrusion of the posterior teeth and the successful treatment of the deep overbite remain stable. In adults, however, the mastication muscles and altered occlusion might move the extruded posterior teeth back to the original positions until equilibrium between the soft and hard tissues is obtained again and relapse occurs. Therefore, in adults, the skeletal discrepancy can be compensated for only by dentoalveolar orthodontic methods with fixed appliances. Maxillary incisor intrusion should be the preferred treatment in nongrowing patients with anterior deepbites caused by overeruption of the maxillary incisors.
Intrusion arches are frequently used to treat deep overbites. However, undesirable side effects such as extrusion of the posterior teeth or flaring of the anterior teeth limit treatment efficiency. Moreover, vertical forces can easily be heavier than desired and change the balance between intrusion of the incisors and extrusion of the molars. Anchorage control, especially in the vertical dimension, is most important if an effective bite opening is to be created by genuine intrusion of the anterior teeth. Although extraoral appliances provide sufficient anchorage, they require excessive patient cooperation.
Maximizing desired tooth movements and minimizing undesirable side effects are important goals of orthodontic treatment. Mini-implants were recently used as anchorage devices to intrude maxillary incisors, indicating that effective incisor intrusion can be achieved with few side effects. Furthermore, intrusion with mini-implants increases treatment efficiency with minimal dependence on patient cooperation. Most of these studies were case reports, and, although case reports contribute considerable information about treatment outcome, individual variations can affect the results. Even though there are few studies that eliminate the effect of individual variations by good sample sizes, none has compared the skeletal and dental effects of the 2 maxillary intrusion systems involving mini-implants and Connecticut intrusion arches. Therefore, we aimed this prospective study at comparing the 2 maxillary intrusion systems involving mini-implants and Connecticut intrusion arches used as intraoral intrusion systems. The treatment efficiency of these 2 intrusion systems with different anchorage zones during maxillary incisor intrusion was evaluated. The null hypothesis was that there are no statistically significant differences in the treatment effects of these 2 maxillary intrusion systems involving mini-implants and Connecticut intrusion arches on the dental and skeletal structures of young adult patients.
Material and methods
In this prospective clinical study, the inclusion criteria for participants were (1) all permanent teeth present and fully erupted, (2) minimal crowding in the maxillary anterior segment, (3) Class II Division 2 malocclusion with increased overbite (≥4 mm), (4) lower lip covering more than 4 mm of the maxillary central incisors on the lateral cephalometric radiographs, (5) no periodontal disease or extremely flared incisors, and (6) chronologic age of 16 years or more.
Forty-five patients (26 women, 19 men) fulfilling the criteria were selected from those referred for orthodontic treatment between January and September 2008. They did not receive any other orthodontic treatment during the maxillary incisor intrusion. Hand-wrist radiographs were used to assess skeletal maturity, if required. All participants were informed of the purpose of the study, and they signed informed consent forms.
The participants were divided into 3 groups with 15 subjects in each group by block randomization: the Connecticut intrusion arch group, comprising 6 men and 9 women, had intrusion with Connecticut intrusion arches; the implant group, comprising 6 men and 9 women, had intrusion with a mini-implant system; and the control group of 7 men and 8 women had no treatment. The mean ages of these groups are shown in Table I .
| Groups | CTA (n = 15) | Implant (n = 15) | Control (n = 15) | ||||||
|---|---|---|---|---|---|---|---|---|---|
| Mean ± SD | Min | Max | Mean ± SD | Min | Max | Mean ± SD | Min | Max | |
| Chronologic age (y) | 20.32 ± 3.22 | 15.70 | 25.40 | 20.13 ± 2.48 | 16.90 | 24.30 | 20.49 ± 2.80 | 15.40 | 25.40 |
| Treatment duration (mo) | 6.88 ± 0.95 | 5.10 | 8.50 | 6.93 ± 1.17 | 5.70 | 10.70 | 6.90 ± 1.01 | 5.60 | 9.60 |
In the Connecticut intrusion arch group, 0.018 × 0.025-in brackets (series 2000; Ormco, Glendora, Calif) were placed on the patients’ 4 maxillary incisors. Laceback ligatures were placed on the brackets of the 4 maxillary incisors. Aligning and leveling were not performed. A passive 0.016-in round segmental archwire (Ortho Organizers, Carlsbad, Calif) was bent for each patient to maintain the initial position of the 4 maxillary incisors.
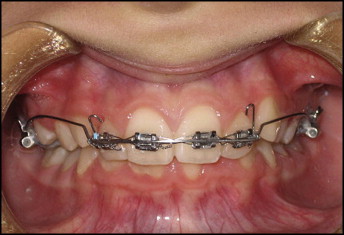
The maxillary molars were banded, and a 0.016 × 0.022-in maxillary long Nitanium intrusion arch (Ortho Organizers) was placed. The Connecticut intrusion arch was cinched back to prevent facial tipping of the incisors. On the incisor segment, the Connecticut intrusion arch was tied behind the lateral incisor brackets to individual archwires ( Fig 1 ). The initial intrusive force of the Connecticut intrusion arches was totally 60 g, and it was checked and reactivated monthly with a Tweed loop and helix forming pliers (02-209; Pin Tech Instruments, Sialkot, Pakistan) after controlling the intrusive force.
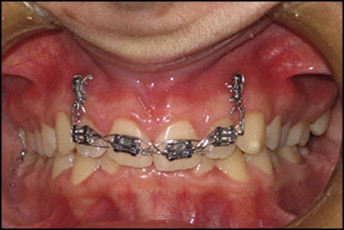
In the implant group, 0.018 × 0.025-in brackets (series 2000; Ormco) were placed on the patients’ 4 maxillary incisors. Laceback ligatures were placed on the brackets of the 4 maxillary incisors. Aligning and leveling were not performed. A passive 0.016-in round segmental archwire (Ortho Organizers) was bent for each patient to maintain the initial position of the 4 maxillary incisors. Two self-drilling mini-implants (diameter, 1.3 mm; length, 5 mm) (Absoanchor; Dentos, Daegu, South Korea) were inserted into the alveolar bone between the roots of the lateral incisors and canines at the mucogingival junction. The intrusion force was delivered by nickel-titanium coil springs, which were placed between the hooks of the passive arch and the mini-implants ( Fig 2 ), and maintained at approximately 90 g (minimum, 35 g; maximum, 50 g) per side during the study. The magnitude of the intrusive force was measured with a calibrated Dontrix gauge (Correx; Ortho Care, Saltaire, United Kingdom) and checked at every appointment. The mini-implants were loaded immediately.
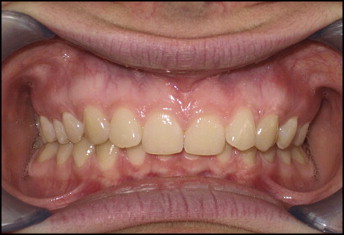
The control group was observed for 7 months ( Fig 3 ).
A lateral cephalometric radiograph and orthopantomograph (Planmeca, Helsinki, Finland), a set of impressions with a wax bite, and extraoral and intraoral photographs were obtained from each patient before intrusion (T0) and after intrusion (T1). To compare the intrusion rates and the treatment efficiencies of the 2 intrusion systems, treatment time was limited to 7 months ( Table I ). If required, maxillary incisor intrusion was continued after the study period. The cephalograms were traced, verified for landmark locations, and superimposed by an investigator (N.E.Ş). The tracings were analyzed by using an imaging system (Dolphin Imaging, Chatsworth, Calif). From each set of lateral cephalograms, cranial base superimpositions ( Figs 4 and 5 ) and mandibular regional superimpositions ( Fig 6 ) were made according to the method of Björk and Skieller. Maxillary regional superimposition was based on the best-fit method ( Fig 7 ). After the superimpositions, the locations of all anatomic landmarks were determined by using an x-y coordinate system. In the cranial base superimposition, the sella-nasion line was accepted as the x-axis, and a line perpendicular to the sella-nasion line at sella was defined as the y-axis ( Figs 4 and 5 ). In the mandibular regional base superimposition, the gonion-gnathion line was accepted as the x-axis, and a line perpendicular to the gonion-gnathion line at gonion was defined as the y-axis ( Fig 6 ). In the maxillary regional base superimposition, the anterior nasal spine-posterior nasal spine line was accepted as the x-axis, and a line perpendicular to that line at the posterior nasal spine was defined as the y-axis ( Fig 7 ). The centers of resistance of the central incisors and the maxillary molars were used to determine the genuine intrusion and positional changes of the maxillary teeth. The center of resistance points were determined on the initial cephalograms of each patient and transferred to the final cephalograms by individual templates. The crown of the tooth was used while placing the individual tooth templates to prevent any influence of root resorption. Maxillary intermolar width (the distance between the mesial cusps of the maxillary first molars) was measured with a digital caliper on the plaster models.
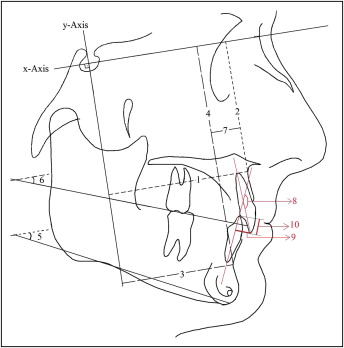
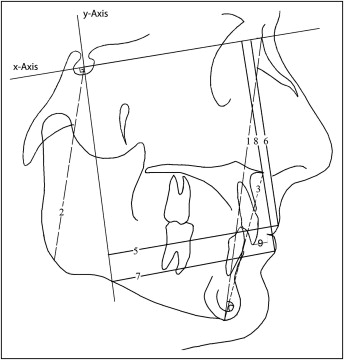
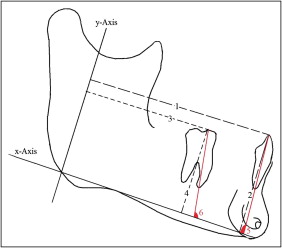
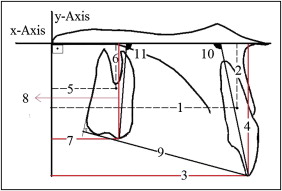
Data were collected by assessing 35 measurements on the lateral cephalogram radiographs and 1 measurement on the plaster models before and after intrusion ( Figs 4-7 ).
Statistical analysis
After a 2-week interval, 30 study models and 30 cephalograms were randomly selected and remeasured for reproducibility of the measurements. Reproducibility was assessed by the Pearson correlation coefficient, and it was nearly 1.00 (r minimum = 0.992). Homogeneity of variances was tested by using the Levene test for equality of variances. Repeated measures analysis of variance (ANOVA) was used to compare the results of the different treatment modalities, determine the significance levels for the study groups (Connecticut intrusion arch, implant, and control) and the treatment periods (T0, before; T1, after), and examine the interactions between the study periods and the groups. The Duncan test was used for multiple comparisons of the 3 groups at T0 and T1 (version 9.0; SAS Institute, Cary, NC). Values of P <0.05 were considered significant.
Results
Of the 30 mini-implants that were inserted in the implant group, 3 loosened in the first month of orthodontic force loading; these were replaced immediately. The new insertion place of the mini-implants was 1 mm above the first insertion place. Self-drilling mini-implants 1.3 mm in diameter and 5 mm in length provided sufficient anchorage for maxillary incisor intrusion. The overall success rate was 90%.
After the treatment, the mean amounts of genuine intrusion were 2.20 mm in the Connecticut intrusion arch group and 2.47 mm in the implant group ( Tables II-IV ; Figs 8 and 9 ). The center of resistance of the maxillary incisors significantly moved upward and backward, and the tip of the maxillary incisors significantly moved upward and forward in both groups ( P <0.05). The axial inclination of the maxillary incisors significantly increased, and the distance between the incisor tip and stomion superioris decreased in both treatment groups ( P <0.05). In the Connecticut intrusion arch group, the center of resistance of the maxillary molar moved mesially (0.30 mm), and the mesial tip of the maxillary molar moved distally (0.83 mm). The mean extrusion movement of the maxillary molar was 0.80 mm in the Connecticut intrusion arch group ( P <0.05). The axial inclination of the maxillary molars significantly increased (tipped distally) in the Connecticut intrusion arch group ( P <0.05). The mandibular incisors moved significantly upward and forward in both treatment groups ( P <0.05). The axial inclination of the mandibular incisors significantly increased in both treatment groups ( P <0.05). The mandibular molars moved downward in the Connecticut intrusion arch group and upward in the implant and control groups ( P <0.05). The interincisal angle and overbite significantly decreased in the both treatment groups ( P <0.05). Arch length significantly increased and the occlusal plane angle significantly decreased in both treatment groups ( P <0.05). After treatment, backward movement of Point A was statistically significant in the groups ( P <0.05).
| Measurements | CTA (n = 15) | Implant (n = 15) | Control (n = 15) | P | ||||||
|---|---|---|---|---|---|---|---|---|---|---|
| T0 | T1 | T1-T0 | T0 | T1 | T1-T0 | T0 | T1 | T1-T0 | ||
| Mean ± SD | Mean ± SD | Mean ± SD | Mean ± SD | Mean ± SD | Mean ± SD | Mean ± SD | Mean ± SD | Mean ± SD | ||
| Ax (mm) | 62.87 ± 4.46A | 62.67 ± 4.60B | −0.20 ± 0.25 | 61.73 ± 4.87A | 61.60 ± 4.93B | −0.13 ± 0.22 | 61.67 ± 4.21A | 61.67 ± 4.21B | 0.00 ± 0.00 | ∗ |
| Ay (mm) | 63.27 ± 3.95 | 63.50 ± 3.82 | 0.23 ± 0.50 | 64.33 ± 5.39 | 64.33 ± 5.56 | 0.00 ± 0.38 | 64.40 ± 3.31 | 64.40 ± 3.31 | 0.00 ± 0.00 | NS |
| Bx (mm) | 48.13 ± 6.71 | 48.20 ± 6.77 | 0.70 ± 0.18 | 46.77 ± 5.70 | 46.80 ± 5.67 | 0.03 ± 0.13 | 47.87 ± 6.16 | 47.90 ± 6.14 | 0.03 ± 0.13 | NS |
| By (mm) | 98.27 ± 5.23 | 98.33 ± 5.17 | 0.70 ± 0.26 | 98.40 ± 7.76 | 98.43 ± 7.77 | 0.03 ± 0.13 | 96.83 ± 5.35 | 97.03 ± 5.51 | 0.20 ± 0.56 | NS |
| SN-GoGn (°) | 29.63 ± 6.35 | 29.93 ± 6.22 | 0.30 ± 0.70 | 30.63 ± 6.48 | 30.60 ± 6.51 | −0.03 ± 0.55 | 30.23 ± 5.32 | 30.20 ± 5.50 | −0.03 ± 0.48 | NS |
| SN-OP (°) | 15.17 ± 3.57A | 12.43 ± 3.30Bb | −2.73 ± 1.50 | 17.23 ± 4.71A | 14.47 ± 4.33Bab | −2,77 ± 1.64 | 15.77 ± 2.82A | 15.90 ± 3.07Ba | 0.13 ± 0.48 | ∗ |
| Ax-Bx (mm) | 14.73 ± 3.92 | 14.47 ± 3.94 | −0.27 ± 0.32 | 14.97 ± 3.26 | 14.80 ± 3.0 | −0.17 ± 0.31 | 13.80 ± 3.83 | 13.77 ± 3.83 | −0.03 ± 0.13 | NS |
| Measurement | CTA (n = 15) | Implant (n = 15) | Control (n = 15) | P | ||||||
|---|---|---|---|---|---|---|---|---|---|---|
| T0 | T1 | T1-T0 | T0 | T1 | T1-T0 | T0 | T1 | T1-T0 | ||
| Mean ± SD | Mean ± SD | Mean ± SD | Mean ± SD | Mean ± SD | Mean ± SD | Mean ± SD | Mean ± SD | Mean ± SD | ||
| U1(cr)x (mm) | 48.83 ± 3.93A | 47.93 ± 4.11B | −0.90 ± 0.83 | 47.50 ± 4.17A | 46.57 ± 4.41B | −0.93 ± 0.56 | 50.03 ± 4.03A | 50.03 ± 4.03B | 0.00 ± 0.00 | ∗ |
| U1(cr)y (mm) | 15.27 ± 2.17A | 13.07 ± 2.54B | −2.20 ± 0.90 | 14.70 ± 2.81A | 12.23 ± 2.62B | −2.47 ± 0.81 | 14.57 ± 3.21A | 14.57 ± 3.21B | 0.00 ± 0.00 | ∗ |
| U1(tip)x (mm) | 50.50 ± 4.40A | 51.40 ± 4.38B | 0.90 ± 1.28 | 49.07 ± 3.68A | 50.90 ± 3.80B | 1.83 ± 1.26 | 50.83 ± 6.12A | 50.83 ± 6.12B | 0.00 ± 0.00 | ∗ |
| U1(tip)y (mm) | 30.23 ± 3.03A | 27.90 ± 3.74Bab | −2.33 ± 1.01 | 29.70 ± 3.88A | 26.90 ± 3.86Bb | −2.80 ± 0.82 | 30.53 ± 3.96A | 30.53 ± 3.96Ba | 0.00 ± 0.00 | ∗ |
| U6(cr)x (mm) | 21.13 ± 5.09A | 21.43 ± 4.88B | 0.30 ± 0.56 | 18.80 ± 4.23A | 18.80 ± 4.23B | 0.00 ± 0.00 | 21.50 ± 3.33A | 21.50 ± 3.33B | 0.00 ± 0.00 | ∗ |
| U6(cr)y (mm) | 13.97 ± 2.28A | 14.63 ± 2.21B | 0.67 ± 0.36 | 12.97 ± 2.70A | 13.00 ± 2.71B | 0.03 ± 0.13 | 14.23 ± 3.09A | 14.23 ± 3.09B | 0.00 ± 0.00 | ∗ |
| U6(tip)x (mm) | 23.20 ± 4.76A | 22.37 ± 4.90B | −0.83 ± 0.90 | 21.00 ± 4.35A | 21.00 ± 4.35B | 0.00 ± 0.00 | 23.77 ± 3.58A | 23.77 ± 3.58B | 0.00 ± 0.00 | ∗ |
| U6(tip)y (mm) | 24.43 ± 3.30A | 25.23 ± 2.83B | 0.80 ± 0.65 | 24.00 ± 3.02A | 24.00 ± 3.02B | 0.00 ± 0.00 | 24.97 ± 3.17A | 25.00 ± 3.15B | 0.03 ± 0.13 | ∗ |
| U6-U1(tip) (mm) | 37.60 ± 3.07A | 38.93 ± 2.62B | 1.33 ± 1.55 | 37.83 ± 3.26A | 38.97 ± 2.74B | 1.13 ± 1.08 | 37.87 ± 3.50A | 38.00 ± 3.67B | 0.13 ± 0.48 | ∗ |
| U1-PP (°) | 98.87 ± 7.92A | 103.73 ± 8.14Ba | 4.87 ± 5.64 | 99.57 ± 9.50A | 107.67 ± 7.56Ba | 8.10 ± 5.17 | 95.50 ± 8.57A | 95.33 ± 8.65Bb | −0.17 ± 0.94 | ∗ |
| U6-PP (°) | 92.73 ± 5.56A | 102.57 ± 6.56Ba | 9.83 ± 3.53 | 92.00 ± 4.25A | 92.00 ± 4.25Bb | 0.00 ± 0.00 | 93.13 ± 4.43A | 93.13 ± 4.43Bb | 0.00 ± 0.00 | ∗ |
| U1(tip)-Stm (mm) | 9.97 ± 3.55A | 9.20 ± 3.49Ba | −0.77 ± 1.21 | 9.93 ± 3.58A | 9.03 ± 2.98B | −0.90 ± 1.39 | 10.33 ± 3.33A | 10.46 ± 3.20B | 0.13 ± 0.81 | ∗ |
| L1x (mm) | 68.23 ± 6.02A | 68.57 ± 6.17B | 0.33 ± 0.65 | 67.77 ± 5.79A | 68.93 ± 5.78B | 1.17 ± 0.67 | 65.70 ± 7.91A | 65.70 ± 7.91B | 0.00 ± 0.00 | ∗ |
| L1y (mm) | 38.90 ± 3.63A | 39.13 ± 3.72B | 0.23 ± 0.32 | 38.87 ± 5.82A | 39.30 ± 5.88B | 0.43 ± 0.42 | 38.60 ± 4.85A | 38.60 ± 4.85B | 0.00 ± 0.00 | ∗ |
| L6x (mm) | 46.30 ± 5.68 | 46.27 ± 5.69 | −0.03 ± 0.13 | 44.93 ± 5.37 | 44.93 ± 5.37 | 0.00 ± 0.00 | 43.97 ± 5.25 | 43.97 ± 5.25 | 0.00 ± 0.00 | NS |
| L6y (mm) | 30.53 ± 3.46 | 30.43 ± 3.51 | −0.10 ± 0.21 | 30.43 ± 5.22 | 30.57 ± 5.23 | 0.13 ± 0.30 | 30.40 ± 3.77 | 30.47 ± 3.74 | 0.03 ± 0.13 | ∗ |
| L1-MP (°) | 93.87 ± 6.40A | 95.07 ± 7.16B | 1.20 ± 3.00 | 95.70 ± 7.79A | 97.90 ± 7.49B | 2.20 ± 2.07 | 93.63 ± 7.22A | 93.53 ± 7.31B | −0.10 ± 0.85 | ∗ |
| L6-MP (°) | 91.43 ± 5.93 | 91.43 ± 5.93 | 0.00 ± 0.00 | 91.87 ± 4.62 | 91.87 ± 4.62 | 0.00 ± 0.00 | 91.67 ± 7.61 | 91.67 ± 7.61 | 0.00 ± 0.00 | NS |
| U1-L1 (°) | 149.87 ± 10.23A | 143.40 ± 11.50Bab | −6.47 ± 8.61 | 147.43 ± 12.83A | 137.33 ± 10.48Bb | −10.10 ± 6.36 | 151.23 ± 11.46A | 151.47 ± 11.55Ba | 0.23 ± 0.78 | ∗ |
| Overjet (mm) | 2.80 ± 1.84 | 3.17 ± 1.50 | 0.37 ± 1.23 | 3.23 ± 0.98 | 3.83 ± 1.28 | 0.60 ± 0.66 | 2.17 ± 1.52 | 2.17 ± 1.52 | 0.00 ± 0.00 | NS |
| Overbite (mm) | 6.83 ± 1.03A | 4.73 ± 1.65Bb | −2.10 ± 1.20 | 7.13 ± 2.21A | 4.87 ± 2.17Bb | −2.27 ± 0.59 | 6.97 ± 1.41A | 6.97 ± 1.41Ba | 0.00 ± 0.00 | ∗ |
Stay updated, free dental videos. Join our Telegram channel
VIDEdental - Online dental courses


