Introduction
Orthodontic setup models are usually limited to the display of teeth, with no information about the roots. The purpose of this article is to present a method for visualizing the tooth roots in setup models by integrating information from cone-beam computed tomography and a laser scanner. The reproducibility of the integration was evaluated.
Methods
The records of 5 patients were used in this study. Three-dimensional digital models were generated from the dental casts. Tooth models were generated from the cone-beam computed tomography slices. The 3-dimensional models were superimposed on the crowns of the teeth in the tooth models and integrated. The integrated 3-dimensional tooth model and 3-dimensional setup model were registered. The reproducibility of the integration was evaluated for each tooth. Unpaired Student t tests were performed on the data between the anterior and posterior teeth, and between the right and left teeth.
Results
The discrepancy among the integrated 3-dimensional models at the final positions after we used this technique was 0.025 ± 0.007 mm. There was a significant difference in the distance between the anterior and posterior teeth ( P <0.05). However, the average distances between the anterior and posterior teeth were small: 0.023 ± 0.007 and 0.028 ± 0.007 mm, respectively. No significant difference was found between the right and left teeth ( P = 0.831).
Conclusions
The methods presented in this study provide a reproducible visualization of tooth roots in virtual setup models by registering accurate crown models to cone-beam computed tomography scans.
The goal of orthodontic treatment is to improve the malocclusion and the relevant functions of the orofacial system. Successful orthodontic treatment should be based on extensive diagnosis and treatment planning. Essential information for diagnosis is obtained from dental casts, photographs, and radiographs. In addition, the setup model, which is used to predict tooth alignment after treatment, is also useful for diagnosis and plays an important role in the 3-dimensional (3D) diagnosis. Currently, the setup model is often limited to showing the alignment of the crowns, with no information regarding the morphology or the direction of the roots or the surrounding bone. Accordingly, root resorption and fenestration of cortical bone might be due to mutual interference between tooth roots and cortical bone and compression of cortical bone. Therefore, orthodontists must make diagnoses and treatment-planning decisions with special attention not only to individual crowns but also to the roots and craniofacial structures. A system for visualizing tooth roots might be useful for observing the positional relationships between the tooth roots and the alveolar bone. Moreover, clinicians could check root parallelism easily in the setup model.
Three-dimensional technology has generated extensive fields of application in dentistry. In orthodontics, various studies have demonstrated automatic tooth alignment, quantitative evaluations for tooth move-ment, and facial profile and stress analyses. Some research groups have attempted to integrate 2 different structures. Macchi et al reported a method to represent complete 3D views of the maxilla, the mandible, and the setup model with individual anatomic roots with conventional computed tomography. Although their method is ideal, computed tomography has some limitations in dentistry because of its high cost, low vertical resolution, and high dose of radiation. Recently, cone-beam computed tomography has become more widely used in dental clinics to obtain 3D images. The radiation dosage is considerably lower with cone-beam computed tomography than in conventional computed tomography scanning. Cone-beam computed tomography also has other advantages, including shorter acquisition times and reduced costs. Although the precision of the tooth crown on cone-beam computed tomographs is low, this disadvantage would be offset by integrating the tooth crown of the dental cast with that of the cone-beam computed tomographs. However, to our knowledge, the reconstruction of tooth roots from cone-beam computed tomography scans and superimposition of the dental cast and the setup model has not yet been reported. Moreover, no reports have been published on the reproducibility of superimposition.
The purposes of this study were to establish a method for visualization of the tooth roots in a setup model with cone-beam computed tomography and noncontact 3D scanning, and to assess the reproducibility of this method.
Material and methods
Dental casts and cone-beam computed tomography slices were obtained from 5 patients (1 male, 4 female) who were diagnosed with maxillary canine impaction and preparing for treatment at the Department of Orthodontics at Hiroshima University Hospital in Japan. Their ages ranged from 15 to 25 years. This study was approved by the Ethical Committee for Epidemiology of Hiroshima University (number 329).
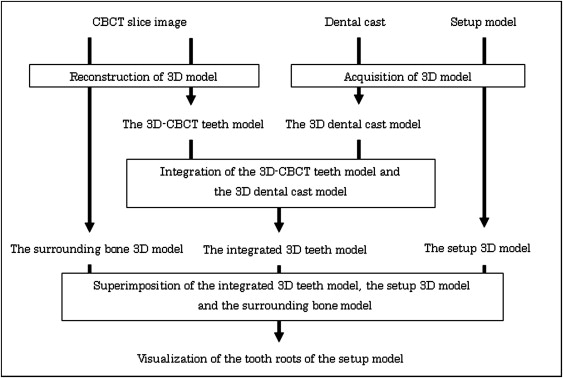
Figure 1 shows the algorithm for visualization of the tooth roots in the setup model. The procedure consists of 4 stages: (1) acquisition of the 3D dental cast model, (2) reconstruction of the 3D cone-beam computed tomography tooth model, (3) integration of the 3D dental cast model with the 3D cone-beam computed tomography tooth model, and (4) visualization of the tooth roots in the setup model and the surrounding bone. The details of each step are described below.
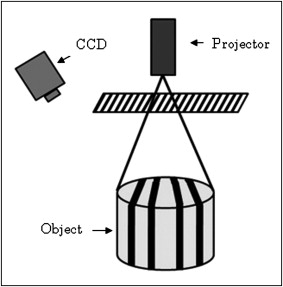
The surface of the dental cast obtained from each patient’s dentition was archived by means of a noncontact 3D surface scanner (RexcanDS, Solutionix, Seoul, Korea) to create the corresponding 3D dental cast model. The RexcanDS measuring system is based on the principle of a phase-shifting optical triangulation. An object is scanned with halogen light stripes, and the twin cameras receive the light reflected from the surface of object ( Fig 2 ). RexcanDS has a reported manufacturing accuracy of 0.016 mm. The generated 3D dental cast model was exported to the stereolithography format containing the 3D coordinates. The stereolithography format is a polygon mesh and list of the triangular surfaces that describes the generated 3D model.
Cone-beam computed tomography (CB MercuRay, Hitachi Medical, Tokyo, Japan) images taken of the patients previously for their orthodontic treatment were used. The isotropic voxel size was 0.1 mm (D-mode, 120 kV, 15 mA) for this device. Scanning time was 9.6 seconds. All slice data were exported with the digital imaging and communication in medicine (DICOM) format. Since all cone-beam computed tomography images used in this study were taken for diagnosis of the maxillary impacted teeth in these orthodontic patients, the measured area of the cone-beam computed tomography was focused on the maxilla and did not cover the whole maxilla and mandible. The 3D cone-beam computed tomography tooth models consisting of the teeth including the roots were segmented and reconstructed with ZedView software (LEXI, Tokyo, Japan). Segmentation refers to the manual process of outlining and masking the shape of structures visible in the cross-sections of volumetric data. The difficulty of segmenting the teeth from cone-beam computed tomography data is attributed to their similarity in intensity with the surrounding bone. It took approximately 2 hours on average for the segmentation of the cone-beam computed tomography tooth model with manual outlining. The generated 3D cone-beam computed tomography model was exported to the stereolithography format containing the 3D coordinates.
The data from the 3D dental cast model and the 3D cone-beam computed tomography tooth model were imported with stereolithography format on the same 3D coordinates by using reverse modeling software (RapidForm 2006; INUS Technology, Seoul, Korea). RapidForm 2006 enables data processing and analysis such as cutting, displacement, and calculation of distances. To superimpose the 3D dental cast model on the 3D cone-beam computed tomography tooth model, the crown of each tooth was used as the index of superimposition. This surface-to-surface matching used the iterative closest point algorithm as a function of RapidForm 2006. The iterative closest point algorithm finds the transformation that brings a model into the best possible alignment with the other model by iteration.
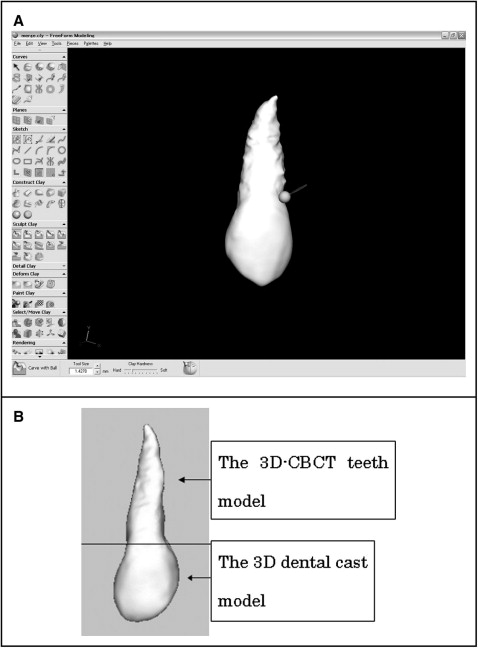
It is desirable that the crowns of the teeth and the setup model are the same form for superimposing the teeth onto the setup model. However, the crowns of the 3D dental cast model have superior reproducibility compared with the 3D cone-beam computed tomography tooth model. Thus, the crowns were eliminated from the 3D cone-beam computed tomography tooth model and merged with the crown of the 3D dental cast model with software (FreeForm, SensAble Technologies, Woburn, Mass) ( Fig 3 , A ). Integration of the 3D dental cast model with the 3D cone-beam computed tomography tooth model was completed (the integrated tooth 3D model) ( Fig 3 , B ).
In general, a setup model consists of the teeth made of plaster and paraffin wax to fix the teeth. The setup 3D model was generated in the same way, acquiring the 3D dental cast model with the RexcanDS. The 3D tooth information was transferred from the integrated 3D tooth model to the setup 3D model by using the RapidForm 2006. Moreover, the surrounding bone 3D model was segmented and reconstructed with ZedView and superimposed on the integrated 3D tooth model. Accordingly, the teeth in a setup model can be observed with the surrounding bone displayed.
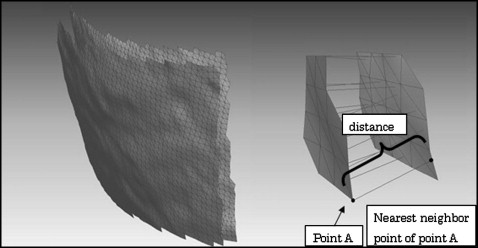
Reproducibility of the technique was evaluated with RapidForm 2006. The technique was performed in triplicate, and the discrepancy among the integrated tooth 3D models at the final positions after this technique was calculated with a shell-to-shell deviation map as the intraexaminer error. A shell-to-shell deviation map calculates a distance in whole 3D models between each point on the 3D model and the nearest neighbor point on another 3D model ( Fig 4 ). The calculation was computed and automatically completed. The results included the average distance and the standard deviation among the integrated 3D tooth models at the final positions with this technique.
Stay updated, free dental videos. Join our Telegram channel
VIDEdental - Online dental courses


