Introduction
In this cephalometric investigation, we analyzed the treatment and posttreatment effects of an orthopedic protocol for Class III malocclusion consisting of a facial mask combined with a removable bite-block appliance.
Methods
The treated sample consisted of 22 Class III patients treated with the facial mask and bite-block protocol before the pubertal growth spurt (mean age, 8.9 ± 1.5 years). Treated subjects were evaluated after facial mask and bite-block therapy and at a posttreatment observation in absence of retention. The treated group was compared with a matched control group of 12 untreated Class III subjects. All treated and control subjects were postpubertal at the final observation. Significant differences between the treated and control groups were assessed with the Mann-Whitney U test ( P <0.05).
Results
Both angular and linear sagittal measurements of the maxilla showed significant improvements during active treatment. Significant improvements of SNA angle, ANB angle, overjet, and molar relationship remained stable during the posttreatment period. No significant effect was found in the mandibular skeletal measures. No significant protraction of the maxillary incisors or retraction of the mandibular incisors was observed.
Conclusions
A bite-block appliance in the mandibular arch with a facial mask enabled effective control of mandibular rotation with progressive closure of the gonial angle. This added to the favorable maxillary outcomes of the treatment protocol.
Treatment of Class III malocclusion in growing subjects is a challenging part of contemporary orthodontic practice. Many treatment approaches can be found in the literature regarding orthopedic and orthodontic treatment in Class III malocclusion, inlcuding intraoral and extraoral appliances such as facial mask (FM), FR-3 appliance of Fränkel, bionator, removable mandibular retractor, double-piece corrector, chincup, splints, Class III elastics, and chincup (SEC III), and mandibular cervical headgear.
Initial observations on the effects of posteroanterior traction of the maxillary complex in the treatment of Class III malocclusion demonstrated skeletal protraction of the maxilla and the dentition, improvement of the ANB angle, backward and downward rotation of mandible with augmentation of facial height, and lingual tipping of the mandibular incisors. These results were often confirmed in controlled trials that usually included combined maxillary expansion and FM therapy. Clinical studies have also shown variable effects of maxillary protraction therapy on the amount of mandibular growth, with a tendency toward Class III relapse when the mandible rotated downward and backward during treatment. Only a few studies dealing with the effects of orthopedic therapy of Class III malocclusion included posttreatment observations to evaluate relapse tendencies after active therapy. Also, few trials incorporated an untreated control sample of Class III subjects followed longitudinally.
Predictive variables for satisfactory long-term outcomes of Class III early treatment can be identified in the overcorrection of overjet (OJ) and the appropriate control of vertical dentoalveolar height to prevent an unfavorable clockwise rotation of the mandible. Bite-blocks (BB) have demonstrated beneficial therapeutic effects in subjects with dentoskeletal open-bite tendency, since they reduce extrusion of the posterior teeth and allow autorotation of the mandible to produce bite closure. Extending these concepts, McNamara, Baccetti et al, and Westwood et al used bonded maxillary expanders with acrylic splints as a BB device combined with FM therapy for Class III malocclusion. Favorable outcomes of BB therapy for the control of mandibular growth direction were observed in both experimental animal and human studies.
The purpose of this controlled clinical trial was to evaluate the therapeutic effects of a treatment protocol for Class III malocclusion consisting of a FM and a BB appliance in the mandibular arch. Both active treatment and posttreatment effects were analyzed in consecutively treated patients, and they were compared with the longitudinal growth changes in a matched control group of untreated Class III subjects.
Material and methods
The treated group comprised 22 patients with dentoskeletal Class III malocclusion treated with a FM combined with a BB appliance it the mandibular arch, who were consecutively treated in the Department of Orthodontics at the University of Rome “Tor Vergata” in Italy. The success of therapy at the end of the observation period was not a determining factor for the selection of patients, since the treated sample was collected prospectively.
At the initial observation (T1), all patients had Class III malocclusion in the mixed dentition characterized by a Wits appraisal of –2 mm or less, anterior crossbite or incisor end-to-end relationship, and Class III molar relationship. All patients were white, with a prepubertal stage of skeletal maturity according to the cervical vertebral maturation method (CS 1 or CS 2). No permanent teeth were congenitally missing or extracted before or during treatment. These Class III patients had no transverse discrepancy between the dental arches.
Lateral cephalograms were taken at T1 and the end of active treatment with the FM-BB protocol (T2). After active therapy, they were recalled every 3 months to assess the stability of treatment outcomes. The treated group was reevaluated at a follow-up observation (T3) with a third set of lateral cephalograms at an average time after T2 of about 2 years (about 3.5 years after T1). All subjects had reached postpubertal skeletal maturity at T3 (CS 4, CS 5, or CS 6). The stages of cervical vertebral maturation were determined by an operator (M.M.) trained in this method. All subjects had permanent dentitions at T3, when fixed appliance therapy could be used to refine the occlusion.
A control group of 12 untreated subjects with dentoskeletal Class III malocclusion was obtained from the Department of Orthodontics at the University of Florence in Italy. The control group matched the treated group as to type of dentoskeletal disharmony, skeletal maturation at the various times, and duration of observation intervals. The mean ages at the time periods in both groups and the durations of either treatment or observation are given in Table I .
| Treated group (n = 22; 9 boys, 13 girls) |
Control group (n = 12; 7 boys, 5 girls) |
|||
|---|---|---|---|---|
| Mean | SD | Mean | SD | |
| T1 | 8.9 | 1.5 | 7.6 | 1.4 |
| T2 | 10.5 | 1.3 | 9.8 | 1.9 |
| T3 | 12.6 | 1.9 | 11.9 | 2.2 |
| T2-T1 | 1.6 | 0.8 | 2.2 | 1.3 |
| T3-T2 | 2.1 | 1.3 | 2.0 | 1.7 |
| T3-T1 | 3.7 | 1.3 | 4.3 | 2.0 |
This study, therefore, comprised a treated sample that was collected prospectively and a control sample that was collected retrospectively.
The intraoral part of the maxillary appliance (intraoral anchorage appliance for posteroanterior elastics connecting with the FM) was constructed with a 1-mm stainless steel arch (buccal and palatal), with 2 hooks in the maxillary canine region to attach the elastics. The intraoral appliance was soldered to bands placed on the maxillary first permanent molars, and the palatal arch was placed in contact with the gingival margins of the maxillary teeth. Maxillary protraction began with forward and downward traction directed approximately 30° to 40° to the occlusal plane. Extraoral elastics were attached from the hooks on the intraoral appliance to the adjustable crossbar of the FM, so that the elastics did not interfere with the function of the lips. Hooks were soldered in the frontal part of the maxillary arch, between the lateral incisors and the deciduous canines, to obtain a direct effect of forward displacement of the maxilla. Elastics of increasing force were used during the first month of therapy until a heavy orthopedic force (600 g for each side) was delivered during the next treatment period. A Delaire FM was used to provide the extraoral anchorage. The patients were instructed to wear the FM at least 14 hours a day; cooperation was good for all of them.
During FM treatment, a BB appliance was used in all treated patients, with the aim to counteract any tendency to clockwise mandibular rotation. The BB appliance was constructed in the form of a Schwarz plate for the mandibular arch with a vestibular arch, occlusal resin splints, and an expansion screw that was activated when needed ( Figs 1-3 ). The splints were intended to control molar eruption, limit intermaxillary divergency, and prevent clockwise mandibular rotation. The patients were instructed to wear the BB for 24 hours a day, including during meals; cooperation was good for all of them.
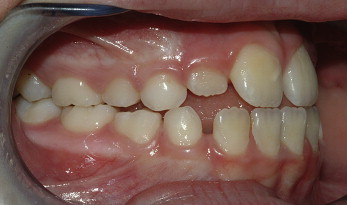
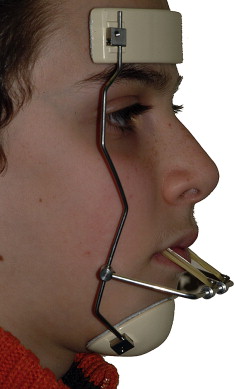
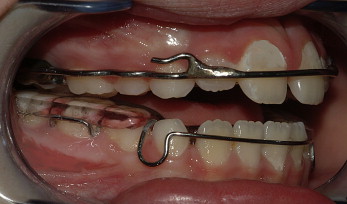
All patients were treated at least to a positive dental OJ before discontinuing treatment; most patients were overcorrected toward a Class II occlusal relationship. No appliance was worn during the T2 to T3 posttreatment observation interval.
A customized digitation regimen and analysis were used for all cephalograms examined in this study. The regimen contained measurements from the analyses of Jacobson, McNamara, Ricketts, Steiner, and Tweed.
Before the cephalometric analysis, the intraobserver measurement error was evaluated. Fifteen lateral cephalograms, selected from various subjects in the study, were traced and measured at 2 times within a week by the same operator (M.M.). The measurements at both times for each patient were analyzed with the intraclass correlation coefficient, which varied between 0.966 for the SNB angle and 0.995 for the inclination of the maxillary incisor to the Frankfort horizontal (FH) line. These values indicated a high level of intraobserver agreement. Linear measurement errors averaged 0.3 mm (SD, 0.8 mm), and angular measurement errors averaged 0.4° (SD, 0.6°).
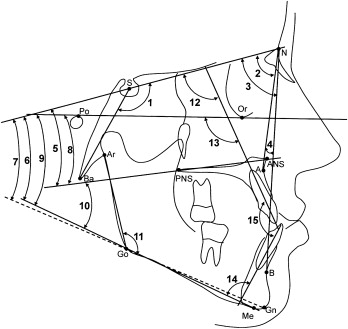
Each cephalogram was traced at the 3 times, and 29 variables (14 linear, 15 angular) were measured. The cephalometric measurements used were the following ( Figs 4 and 5 ): (1) cranial flexure, NSBa angle; (2) maxillary skeletal, SNA angle, A-N perpendicular (Point A to a line drawn perpendicular to the FH from N), Co-ANS, and Co-A; (3) mandibular skeletal: SNB angle, Pg-N perpendicular (Pg to a line drawn perpendicular to the FH from N), Co-Go, Ar-Go, Co-Gn, and Go-Gn; (4) skeletal differences: ANB angle, Wits appraisal (distance between the 2 points of intersection of the 2 perpendicular lines from Points A and B to the functional occlusal plane), and maxillomandibular differential (difference between Co-A and Co-Gn); (5) vertical skeletal: SN-palatal plane (PP) angle, SN-GoMe angle, SN-GoGn angle, FH-PP angle, FH-mandibular plane (MP) angle, PP-MP angle, and gonial angle (Ar-Go-Me); and (7) dental measurements: maxillary central incisor (U1)-SN angle, U1-FH angle, IMPA angle, interincisal angle, OJ, overbite (OB), molar relationship, and U6-SePtm.
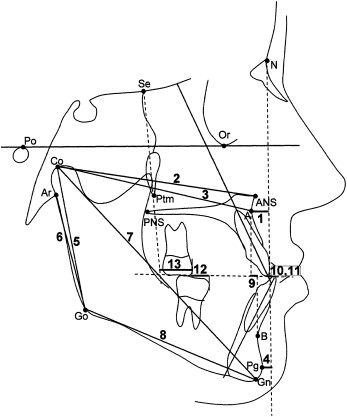
Statistical analysis
Descriptive statistics were calculated for all cephalometric measures at T1, T2, and T3 for the treated and control groups. Additionally, mean differences and standard deviations were calculated for the changes from T2 to T1, T3 to T2 and T3 to T1 in both groups.
The data were analyzed with statistical softwares (version 12.0, SPSS, Chicago, Ill; and SigmaStat 3.5, Systat Software, Point Richmond, Calif). Statistical significance was tested at P <0.05, P <0.01, and P <0.001.
The homogeneity between the treated and control groups (type of malocclusion, skeletal maturity at each observation time, sex distribution, and mean duration of observation intervals) allowed for comparisons without annualizing the data. Because of relatively few control subjects, the data did not have a normal distribution (Shapiro-Wilks test). Therefore, nonparametric statistics were used. The calculated power of the study, however, was adequate (0.85).
Before making the comparisons of the longitudinal changes, significant differences between the craniofacial starting forms at T1 were assessed with the Mann-Whitney U test between the treated and control groups. The changes in cephalometric measurements between T1 and T2, T2 and T3, and T1 and T3 in the treated group were compared with the Friedman repeated measures analysis of variance (ANOVA) on ranks with the Tukey post-hoc test ( P <0.05) to determine significant active treatment, posttreatment, and overall changes, respectively. To assess the differences between the treated and control groups at T1 to T2, T2 to T3, and overall T1 to T3 changes, Mann-Whitney U tests ( P <0.05, P <0.01, P <0.001) were used.
Results
Analysis of the starting forms ( Table II ) showed that the treated and control groups had no statistically significant differences in craniofacial characteristics at T1. The only exception was a significantly greater buccal inclination of the maxillary and mandibular incisors at T1 in the treated group that led to a significantly smaller interincisal angle in the treated group.
| Treated group (n = 22) | Control group (n = 12) | ||||
|---|---|---|---|---|---|
| Cephalometric measurement | Mean | SD | Mean | SD | Mann-Whitney U test |
| Cranial flexure | |||||
| NSBa (°) | 128.4 | 5.1 | 128.0 | 5.4 | 0.4 |
| Maxillary skeletal | |||||
| SNA (°) | 80.5 | 4.3 | 77.8 | 4.0 | 1.7 |
| A-N perpendicular (mm) | −0.8 | 2.7 | −1.3 | 3.3 | 0.5 |
| Co-ANS (mm) | 77.6 | 5.0 | 79.0 | 3.1 | −1.4 |
| Co-A (mm) | 75.2 | 5.0 | 74.6 | 2.8 | 0.6 |
| Mandibular skeletal | |||||
| SNB (°) | 80.0 | 4.3 | 78.0 | 3.7 | 2.0 |
| Pg-N perpendicular (mm) | −3.1 | 5.1 | −6.9 | 5.6 | 3.8 |
| Co-Go (mm) | 45.3 | 4.1 | 45.9 | 3.2 | −0.6 |
| Ar-Go (mm) | 38.0 | 4.3 | 38.0 | 3.1 | 0.0 |
| Co-Gn (mm) | 99.7 | 5.3 | 98.8 | 5.3 | 0.9 |
| Go-Gn (mm) | 65.3 | 3.5 | 62.7 | 3.6 | 2.6 |
| Skeletal difference | |||||
| ANB (°) | 0.5 | 2.0 | −0.3 | 2.4 | −1.2 |
| Wits appraisal (mm) | −6.2 | 2.6 | −7.6 | 4.1 | 1.4 |
| Maxillomandibular differential (mm) | 24.5 | 2.6 | 24.1 | 3.7 | 0.4 |
| Vertical skeletal | |||||
| SN-PP (°) | 7.7 | 3.2 | 10.4 | 3.3 | −2.7 |
| SN-GoMe (°) | 37.4 | 6.3 | 40.9 | 5.5 | −3.5 |
| SN-GoGn (°) | 35.3 | 6.2 | 38.3 | 5.7 | −3.0 |
| FH-PP (°) | −0.9 | 3.5 | 1.0 | 2.4 | −1.9 |
| FH-MP (°) | 28.8 | 5.3 | 31.6 | 3.8 | −2.8 |
| PP-MP (°) | 29.6 | 6.4 | 30.5 | 4.0 | −0.9 |
| Gonial angle (Ar-Go-Me) (°) | 134.1 | 6.3 | 135.5 | 4.4 | −1.4 |
| Dental | |||||
| U1-SN (°) | 107.1 | 9.6 | 98.0 | 8.2 | 9.1∗ |
| U1-FH (°) | 115.7 | 8.0 | 107.3 | 8.5 | 8.4∗ |
| IMPA (°) | 88.1 | 5.5 | 80.6 | 6.4 | 7.5† |
| Interincisal angle (°) | 127.5 | 9.6 | 140.5 | 13.5 | −13.0† |
| OJ (mm) | −1.2 | 2.0 | −2.1 | 2.5 | 0.9 |
| OB (mm) | 0.3 | 1.1 | −1.3 | 2.4 | 1.6 |
| Molar relationship (mm) | 3.0 | 1.1 | 4.0 | 3.0 | −1.0 |
| U6-SePtm (mm) | 20.7 | 3.6 | 21.7 | 2.9 | −1.0 |
Statistical analysis of the treatment and posttreatment changes in the treated group ( Table III ) showed several significant changes from T1 to T2. Sagittal maxillary position (SNA, A-N perpendicular), midfacial length (Co-A, Co-ANS), and mandibular total length (Co-Gn) were significantly greater at T2 than at T1. The values for the ANB angle and Wits appraisal showed significant improvements. The inclination of the PP to the cranial base or to the FH plane (SN-PP, FH-PP) showed significantly smaller values at T2; PP-MP, on the contrary, had significantly greater values at T2. The same occurred for OJ. A positive OJ was obtained in all subjects at T2 (range, 0.3-4.1 mm). Molar relationship had a significantly smaller value at T2 than at T1, whereas U6-SePtm showed a significant increase. There were no significant changes in the axial inclination of the maxillary and mandibular teeth in the treatment group from T1 to T2.
| Treated group T1 | Treated group T2 | Treated group T3 | Statistical comparisons (Friedman repeated measures ANOVA on ranks) | ||||||
|---|---|---|---|---|---|---|---|---|---|
| Cephalometric measurement | Mean | SD | Mean | SD | Mean | SD | T2-T1 | T3-T2 | T3-T1 |
| Cranial flexure | |||||||||
| NSBa (°) | 128.4 | 5.1 | 127.8 | 4.2 | 128.4 | 5.8 | −0.6 | 0.6 | 0.0 |
| Maxillary skeletal | |||||||||
| SNA (°) | 80.5 | 4.3 | 82.6 | 4.1 | 82.4 | 4.9 | 2.1 ∗ | −0.2 | 1.9 ∗ |
| A-N perpendicular (mm) | −0.8 | 2.7 | 0.4 | 2.3 | 0.1 | 3.1 | 1.2 ∗ | −0.3 | 0.9 |
| Co-ANS (mm) | 77.6 | 5.0 | 82.3 | 6.0 | 84.3 | 6.5 | 4.7 ∗ | 2.0 | 6.7 ∗ |
| Co-A (mm) | 75.2 | 5.0 | 80.0 | 5.9 | 81.4 | 6.4 | 4.8 ∗ | 1.4 | 6.2 ∗ |
| Mandibular skeletal | |||||||||
| SNB (°) | 80.0 | 4.3 | 79.9 | 3.8 | 80.7 | 4.9 | −0.1 | 0.8 | 0.7 |
| Pg-N perpendicular (mm) | −3.1 | 5.1 | −4.4 | 6.1 | −2.1 | 7.1 | −1.3 | 2.3 | 1.0 |
| Co-Go (mm) | 45.3 | 4.1 | 47.4 | 5.3 | 49.8 | 5.6 | 2.1 | 2.4 ∗ | 4.5 ∗ |
| Ar-Go (mm) | 38.0 | 4.3 | 39.7 | 5.1 | 41.9 | 5.5 | 1.7 | 2.2 | 3.9 ∗ |
| Co-Gn (mm) | 99.7 | 5.3 | 104.3 | 5.9 | 108.7 | 7.5 | 4.6 ∗ | 4.4 | 9.0 ∗ |
| Go-Gn (mm) | 65.3 | 3.5 | 68.0 | 3.8 | 71.1 | 4.3 | 2.7 | 3.1 ∗ | 5.8 ∗ |
| Skeletal difference | |||||||||
| ANB (°) | 0.5 | 2.0 | 2.7 | 2.5 | 1.7 | 2.6 | 2.2 ∗ | −1.0 ∗ | 1.2 ∗ |
| Wits appraisal (mm) | −6.2 | 2.6 | −4.4 | 2.1 | −4.1 | 2.7 | 1.8 ∗ | 0.3 | 2.1 ∗ |
| Maxillomandibular differential (mm) | 24.5 | 2.6 | 24.3 | 3.7 | 27.3 | 4.9 | −0.2 | 3.0 ∗ | 2.8 ∗ |
| Vertical skeletal | |||||||||
| SN-PP (°) | 7.7 | 3.2 | 5.8 | 3.0 | 6.7 | 4.1 | −1.9 ∗ | 0.9 | −1.0 |
| SN-GoMe (°) | 37.4 | 6.3 | 37.6 | 7.0 | 36.9 | 7.1 | 0.2 | −0.7 | −0.5 |
| SN-GoGn (°) | 35.3 | 6.2 | 35.7 | 7.0 | 34.7 | 6.9 | 0.4 | −1.0 | −0.6 |
| FH-PP (°) | −0.9 | 3.5 | −2.1 | 3.2 | −1.2 | 3.7 | −1.2 ∗ | 0.9 ∗ | −0.3 |
| FH-MP (°) | 28.8 | 5.3 | 29.7 | 6.4 | 29.1 | 6.3 | 0.9 | −0.6 | 0.3 |
| PP-MP (°) | 29.6 | 6.4 | 31.8 | 6.7 | 30.2 | 6.5 | 2.2 ∗ | −1.6 ∗ | 0.6 |
| Gonial angle (Ar-Go-Me) (°) | 134.1 | 6.3 | 134.2 | 5.5 | 133.3 | 5.2 | 0.1 | −0.9 | −0.8 |
| Dental | |||||||||
| U1-SN (°) | 107.1 | 9.6 | 107.1 | 7.6 | 109.6 | 7.7 | 0.0 | 2.5 | 2.5 |
| U1-FH (°) | 115.7 | 8.0 | 115.0 | 6.6 | 117.4 | 6.8 | −0.7 | 2.4 | 1.7 |
| IMPA (°) | 88.1 | 5.5 | 87.7 | 6.3 | 86.7 | 6.1 | −0.4 | −1.0 | −1.4 |
| Interincisal angle (°) | 127.5 | 9.6 | 127.6 | 7.1 | 126.8 | 8.1 | 0.1 | −0.8 | −0.7 |
| OJ (mm) | −1.2 | 2.0 | 1.9 | 1.0 | 1.6 | 1.0 | 3.1 ∗ | −0.3 | 2.8 ∗ |
| OB (mm) | 0.3 | 1.1 | 1.0 | 2.2 | 1.5 | 1.5 | 0.7 | 0.5 | 1.2 ∗ |
| Molar relationship (mm) | 3.0 | 1.1 | 0.0 | 1.7 | 1.9 | 1.5 | −3.0 ∗ | 1.9 ∗ | −1.1 |
| U6-SePtm (mm) | 20.7 | 3.6 | 24.8 | 3.1 | 26.2 | 3.8 | 4.1 ∗ | 1.4 | 5.5 ∗ |
Some cephalometric variables showed significant changes from T2 to T3 in the treated group. Maxillary skeletal cephalometric measurements were stable from T2 to T3. Mandibular body (Go-Gn) and ramus length (Co-Go) were significantly greater at T3 than at T2. There were significant rebounds in the ANB angle and maxillomandibular differential, in 2 vertical dimensions (FH-PP, PP-MP), and in molar relationship at T3. At T3, only 1 subject had an end-to-end incisal relationship, whereas all others had a positive OJ (range, 0.4-4.7 mm).
The statistical comparison of the overall changes from T1 to T3 showed significantly greater increases in maxillary sagittal position (SNA) and midfacial lenght (Co-A and Co-ANS). At T2, there were significantly greater values than at T1 for total mandibular length (Co-Gn), mandibular body (Go-Gn), and ramus length (Ar-Go and Co-Go); the same occurred for ANB angle, Wits appraisal, and maxillomandibular differential. No vertical skeletal cephalometric measurements showed significant changes from T1 to T3. Significantly greater increases were found for OJ, OB, and U6-SePtm.
The statistical comparisons of the changes between T1 and T2 in the treated and control groups ( Table IV ) showed many significant active treatment effects produced by the FM-BB protocol. All maxillary skeletal measures showed significant improvements in the treated group vs the controls. In particular, maxillary length (Co-A) had an average improvement in the treated subjects over the controls of 2.8 mm. No significant effects of therapy were found for the mandibular skeletal variables. Intermaxillary skeletal variables showed significant improvements, with an average increase in ANB of 2.8°, an average increase in the Wits appraisal of 2.5 mm, and an average reduction in the maxillomandibular differential of –4.3 mm. A significant counterclockwise rotation of the PP was found in the treated group, which led to a significant increase in intermaxillary divergence (PP-MP) during treatment. No significant clockwise rotation of the mandible was found. OJ improved significantly between T1 and T2 in the treatment group vs the controls (2.6 mm), and the molar relationship also improved (–4.7 mm). The maxillary molars were moved anteriorly significantly by active treatment (2.7 mm more than the controls). No significant differences in posttreatment changes (T2-T3) were found between the treated and control groups ( Table IV ). The only exception was a significant closure of the gonial angle in the treated group (–2.7° over the controls).
| Treated group (TG) T2-T1 | Treated group (TG) T3-T2 | Treated group (TG) T3-T1 | Control group (CG) T2-T1 | Control group (CG) T3-T2 | Control group (CG) T3-T1 | Statistical comparisons (Mann-Whitney U test) | |||||||||
|---|---|---|---|---|---|---|---|---|---|---|---|---|---|---|---|
| Cephalometric measurement | Mean | SD | Mean | SD | Mean | SD | Mean | SD | Mean | SD | Mean | SD | TG vs CG T2-T1 |
TG vs CG T3-T2 |
TG vs CG T3-T1 |
| Cranial flexure | |||||||||||||||
| NSBa (°) | −0.6 | 3.1 | 0.6 | 2.8 | 0.0 | 2.3 | 0.5 | 4.4 | −1.8 | 3.7 | −1.2 | 3.1 | −1.1 | 2.4 | 1.2 |
| Maxillary skeletal | |||||||||||||||
| SNA (°) | 2.1 | 2.8 | −0.2 | 1.8 | 1.9 | 3.1 | −0.6 | 1.2 | 0.1 | 1.4 | −0.5 | 1.4 | 2.7‡ | −0.3 | 2.4† |
| A-N perpendicular (mm) | 1.3 | 3.0 | −0.3 | 2.1 | 1.0 | 3.0 | −1.2 | 2.0 | 0.0 | 1.9 | −1.1 | 2.1 | 2.5† | −0.3 | 2.1∗ |
| Co-ANS (mm) | 4.7 | 3.1 | 2.0 | 4.6 | 6.7 | 5.6 | 2.1 | 2.8 | 3.3 | 4.4 | 5.5 | 4.5 | 2.6 | −1.3 | 1.2 |
| Co-A (mm) | 4.9 | 3.1 | 1.4 | 4.3 | 6.3 | 5.4 | 2.1 | 2.7 | 2.7 | 3.5 | 4.8 | 4.1 | 2.8∗ | −1.3 | 1.5 |
| Mandibular skeletal | |||||||||||||||
| SNB (°) | −0.1 | 2.6 | 0.8 | 1.7 | 0.7 | 2.6 | 0.0 | 1.4 | 0.6 | 1.8 | 0.6 | 1.6 | −0.1 | 0.2 | 0.1 |
| Pg-N perpendicular (mm) | −1.3 | 6.1 | 2.2 | 4.8 | 0.9 | 5.0 | 0.2 | 4.3 | 2.7 | 3.0 | 2.9 | 5.1 | −1.5 | −0.5 | −2.0 |
| Co-Go (mm) | 2.1 | 3.3 | 2.4 | 4.3 | 4.5 | 5.3 | 3.5 | 3.3 | 2.8 | 5.0 | 6.3 | 4.2 | −1.4 | −0.4 | −1.8 |
| Ar-Go (mm) | 1.7 | 3.1 | 2.2 | 3.6 | 3.9 | 4.6 | 2.7 | 3.5 | 2.6 | 4.4 | 5.3 | 3.8 | −1.0 | −0.4 | −1.4 |
| Co-Gn (mm) | 4.6 | 3.8 | 4.4 | 5.6 | 9.0 | 7.1 | 6.2 | 5.2 | 5.9 | 7.0 | 12.2 | 6.7 | −1.6 | −1.5 | −3.2 |
| Go-Gn (mm) | 2.6 | 3.9 | 3.1 | 2.9 | 5.7 | 4.0 | 3.8 | 3.7 | 2.9 | 3.7 | 6.7 | 5.0 | −1.2 | 0.2 | −1.0 |
| Skeletal difference | |||||||||||||||
| ANB (°) | 2.2 | 1.6 | −1.0 | 1.6 | 1.2 | 1.9 | −0.6 | 1.2 | −0.5 | 2.0 | −1.1 | 2.0 | 2.8‡ | −0.5 | 2.3∗ |
| Wits appraisal (mm) | 1.8 | 3.3 | 0.3 | 3.1 | 2.1 | 3.0 | −0.7 | 3.8 | 0.5 | 2.1 | −0.2 | 4.0 | 2.5∗ | −0.2 | 2.3 |
| Maxillomandibular differential (mm) | −0.2 | 2.3 | 3.0 | 2.4 | 2.8 | 3.0 | 4.1 | 3.5 | 3.2 | 4.5 | 7.4 | 4.4 | −4.3‡ | −0.2 | −4.6‡ |
| Vertical skeletal | |||||||||||||||
| SN-PP (°) | −1.9 | 2.5 | 0.9 | 2.4 | −1.0 | 2.4 | −0.1 | 3.3 | −0.3 | 2.8 | −0.4 | 3.6 | −1.8∗ | 1.2 | −0.6 |
| SN-GoMe (°) | 0.2 | 2.4 | −0.6 | 2.1 | −0.5 | 2.4 | −0.4 | 3.7 | −0.1 | 2.6 | −0.5 | 4.5 | 0.6 | −0.5 | 0.0 |
| SN-GoGn (°) | 0.4 | 2.3 | −1.0 | 1.6 | −0.6 | 2.4 | −0.3 | 3.6 | −1.0 | 2.7 | −1.3 | 4.8 | 0.7 | 0.0 | 0.7 |
| FH-PP (°) | −1.2 | 3.4 | 0.9 | 2.4 | −0.3 | 3.2 | 0.7 | 2.6 | 0.3 | 2.5 | 1.0 | 2.8 | −1.9∗ | 0.6 | −1.3 |
| FH-MP (°) | 0.9 | 3.3 | −0.6 | 2.6 | 0.3 | 3.2 | 0.4 | 2.6 | 0.4 | 1.9 | 0.8 | 3.4 | 0.5 | −1.0 | −0.5 |
| PP-MP (°) | 2.1 | 2.2 | −1.5 | 2.1 | 0.6 | 2.6 | −0.3 | 1.6 | 0.2 | 3.0 | −0.1 | 3.3 | 2.4† | −1.7 | 0.7 |
| Gonial angle (Ar-Go-Me) (°) | 0.1 | 3.3 | −0.9 | 2.6 | −0.8 | 3.5 | −0.8 | 3.0 | 1.8 | 1.8 | 1.0 | 3.1 | 0.9 | −2.7† | −1.8 |
| Dental | |||||||||||||||
| U1-SN (°) | 0.1 | 5.5 | 2.4 | 3.9 | 2.5 | 5.7 | 1.6 | 6.5 | 2.2 | 7.2 | 3.8 | 7.7 | −1.5 | 0.2 | −1.3 |
| U1-FH (°) | −0.7 | 5.1 | 2.4 | 4.7 | 1.7 | 5.7 | 0.8 | 6.7 | 1.7 | 7.3 | 2.5 | 7.4 | −1.5 | 0.7 | −0.8 |
| IMPA (°) | −0.4 | 6.2 | −0.9 | 5.4 | −1.3 | 5.4 | 0.7 | 4.7 | −2.9 | 3.7 | −2.2 | 6.1 | −1.1 | 2.0 | 0.9 |
| Interincisal angle (°) | 0.1 | 7.5 | −0.8 | 6.6 | −0.7 | 7.4 | −1.9 | 8.5 | 0.8 | 9.0 | −1.1 | 9.6 | 2.0 | −1.6 | 0.4 |
| OJ (mm) | 3.1 | 2.1 | −0.3 | 1.0 | 2.8 | 2.4 | 0.5 | 1.7 | −0.2 | 1.5 | 0.3 | 2.0 | 2.6‡ | −0.1 | 2.5† |
| OB (mm) | 0.7 | 1.8 | 0.5 | 1.7 | 1.3 | 1.2 | 1.0 | 2.2 | −0.4 | 1.1 | 0.6 | 2.0 | −0.3 | 0.9 | 0.7 |
| Molar relationship (mm) | −3.0 | 1.8 | 1.9 | 1.5 | −1.1 | 1.6 | 1.7 | 1.2 | 0.6 | 4.1 | 2.3 | 4.4 | −4.7‡ | 1.3 | −3.4† |
| U6-SePtm (mm) | 4.1 | 4.0 | 1.3 | 3.1 | 5.4 | 3.0 | 1.4 | 3.3 | 1.0 | 4.5 | 2.4 | 5.8 | 2.7∗ | 0.3 | 3.0∗ |
Stay updated, free dental videos. Join our Telegram channel

VIDEdental - Online dental courses


