Introduction
The aim of this study was to evaluate the position and movements of the tongue in patients with skeletal Class III malocclusion.
Methods
Sixty-six patients (31 male, 35 female) with Class III malocclusion were divided into 3 groups according to cephalometric analysis. The first group comprised 23 patients (13 male, 10 female) with mandibular prognathism, the second group comprised 21 patients (9 male, 12 female) with maxillary retrognathism, and the third group comprised 22 patients (9 male, 13 female) with both maxillary retrognathism and mandibular prognathism. Twenty-two skeletal Class I patients (10 male, 12 female) were also included as the control group.
Results
Dentofacial morphology affects the position and the movements of the tongue during deglutition. Contact of the anterior portion of the tongue with the rugae area of the hard palate decreased in the Class III malocclusion groups. The posterior portion of the dorsal tongue was positioned more inferiorly, and the root of the tongue was positioned more inferiorly and anteriorly in patients with Class III malocclusion than in the control group. The tip of the tongue was also in a more anterior position in the Class III groups. When the deglutition stages were evaluated, we observed that the manner of bolus transfer was different in patients with skeletal Class III malocclusion than in those with skeletal Class I malocclusion.
Conclusions
Tongue posture is affected by dentofacial structures, and adaptive changes occur in the tip, dorsum, and root of the tongue. Deglutitive tongue movements in patients with skeletal Class III malocclusion are also different from those with skeletal Class I malocclusion.
Evaluation of swallowing is an important part of oral diagnosis. Several techniques have been applied to observe tongue movements during deglutition. Cineradiography and video-fluoroscopy have been reported as acceptable methods in assessing deglutition, but radiation exposure makes their use questionable. Deglutition has also been investigated by ultrasound scanning. In ultrasonography, direct transducer skin coupling scanning caused various artifacts, resulting in inaccurate measurements of tongue movements. The cushion-scanning technique was developed to overcome this problem. However, this technique restricts the physiologic movements of the head. Cleall reported that anything that restricts the movement of the head and its structures is unphysiologic in the study of movement. In addition, the observation of the oral stage of deglutition was difficult in this technique. Electropalatography is another method to measure dynamic tongue function. In this technique, the patient wears an acrylic plate base with electrodes that record the location and the timing of tongue contacts. However, this plate might affect the position and movement of the tongue during deglutition.
Recently, dynamic magnetic resonance imaging (MRI), another noninvasive method to evaluate swallowing function, has become available. Foucart et al reported that kinetic MRI could be used to investigate the oropharyngeal apparatus. Anagnostara et al reported that high-speed kinetic MRI provided direct soft-tissue imaging without radiation exposure with comparable near real-time resolution, compared with video-fluorography. Hartl et al demonstrated that dynamic MRI with single-shot fast spin echo provided clear images of the oral and pharyngeal surfaces as well as of the deep tissue structures. Real-time balanced turbo field echo has been used in subjects with anterior open bite for the evaluation of deglutition events, transit times, and tongue movements.
Proffit reported that tongue posture and swallowing pattern were affected by the dentofacial structures. Akin et al showed that, in patients with open bite, the tongue tip was positioned more anteriorly than in patients with a normal overbite. Karacay et al evaluated alterations of tongue movements after correction of Class II malocclusion and open bite by advancement of the mandible in a forward and upward direction with a sagittal split osteotomy. Dynamic MRI showed that the tongue tip was retruded behind the incisors, and contact of the tongue with the palate increased after treatment. It was also determined that the anterior and middle portions descended, whereas the posterior portion was elevated at all stages. Sayn et al reported that tongue movements in deglutition immediately adapted to changes in the local environment that were created by the tongue crib. Fuhrmann and Diedrich evaluated the swallowing pattern by using video-based dynamic B-mode ultrasound and reported that patients with an Angle Class III malocclusion had the highest rate of abnormal swallowing.
In skeletal Class III malocclusions, generally patients have a greater mandibular bone size and a smaller maxillary bone size. In this study, we intended to evaluate the deglutition pattern in Class III malocclusion, since the size and position of the jaws and the maxillomandibular relationship can change tongue posture and movements during deglutition. Cine images of the tongue were obtained by using real-time balanced turbo field echo. To our knowledge, this technique has not been used before in the evaluation of the swallowing patterns of patients with Class III malocclusion.
Material and methods
This prospective study was carried out after institutional approval from the Ethics Committee of Gulhane Military Medical Academy in Ankara, Turkey.
Eighty-eight patients (45 male, 43 female; mean age, 17.54 ± 4.66 years) participated in this study, and all signed informed consent forms. The participants were divided into 4 groups according to their skeletal structures ( Table I ). The skeletal classifications were made by the evaluation of the sagittal components of the jaws, based on the SNA, SNB, and ANB angles, and N vertical-A and N vertical-Pg linear measurements (distance between A point and nasion perpendicular [the line beginning from nasion point and perpendicular to Frankfurt horizontal line [the line between porion and orbita points]] and distance between pogonion point and nasion perpendicular) of the lateral cephalograms. Twenty-three Class III patients (13 male, 10 female; mean age, 17.09 ± 5.77 years) with mandibular prognathism were included in the first group. In the second group, there were 21 Class III patients (9 male, 12 female; mean age, 15.58 ± 3.45 years) with maxillary retrognathism. The third group comprised 22 Class III patients (9 male, 12 female; mean age, 19.21 ± 3.87 years) with both maxillary retrognathism and mandibular prognathism. Finally, 22 subjects (10 male, 12 female; mean age, 18.26 ± 5.22 years) with skeletal Class I malocclusion composed the control group.
| Age (y) | SNA (°) | SNB (°) | ANB (°) | N vertical-A (mm) | N vertical-Pg (mm) | |||||||
|---|---|---|---|---|---|---|---|---|---|---|---|---|
| Mean | SD | Mean | SD | Mean | SD | Mean | SD | Mean | SD | Mean | SD | |
| Group 1 | 17.09 | 5.77 | 80.14 | 4.05 | 84.21 | 3.95 | −4.07 | 2.43 | −0.43 | 3.03 | 6.21 | 6.85 |
| Group 2 | 15.58 | 3.45 | 75.80 | 3.28 | 79.13 | 2.92 | −3.20 | 2.14 | −5.73 | 3.73 | −4.33 | 5.96 |
| Group 3 | 19.21 | 3.87 | 76.13 | 2.31 | 82.31 | 2.98 | −6.19 | 3.45 | −7.19 | 4.69 | 2.75 | 5.32 |
| All Class III groups | 17.41 | 4.55 | 77.27 | 3.96 | 82.03 | 4.09 | −4.70 | 3.21 | −4.43 | 4.82 | 1.43 | 7.70 |
| Group 4 | 18.26 | 5.22 | 81.27 | 1.01 | 79.36 | 1.12 | 1.91 | 0.83 | 0.10 | 1.30 | −6.73 | 2.05 |
| Overall | 17.54 | 4.66 | ||||||||||
All patients were examined with a 1.5-T super conducting magnetic resonance scanner with a quad H coil and version 9 software (New Intera Nova, Philips Medical Systems, Best, The Netherlands). Real-time balanced turbo field echo images (shortest TR/TE:2.1/1.09 ms) were taken with a 50° flip angle in the midsagittal plane, 10 mm thickness, 350 × 350 mm field of view dimensions, and 96 × 96 matrix width during the patient’s water swallowing. A hundred dynamic scans were captured in 11 seconds.
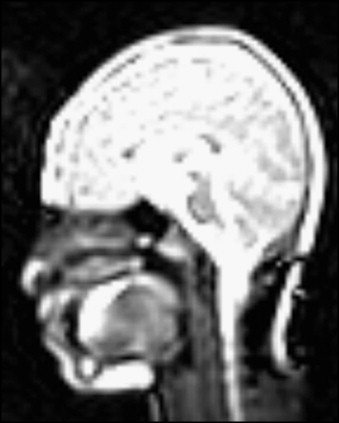
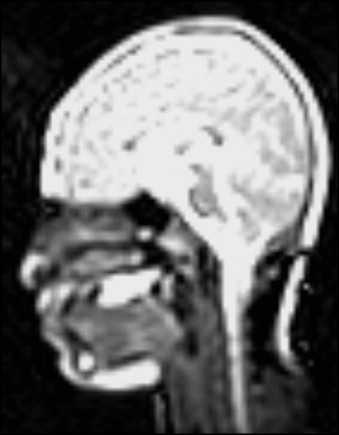
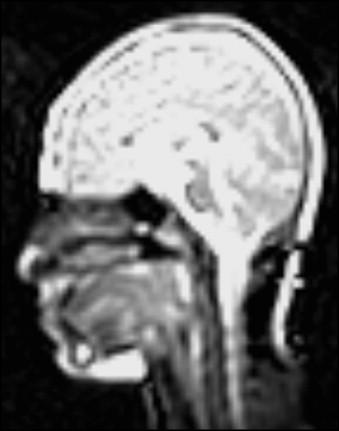
The images were obtained while the subjects were swallowing 10 mL of water that was taken with a syringe just before imaging. For each patient, images matching the following 3 stages were determined by 3 specialists and printed out on a radiograph: stage 1: loss of contact of the dorsal tongue with the soft palate ( Fig 1 ); stage 2: passage of the bolus head across the posterior or inferior margin of the ramus of the mandible ( Fig 2 ); and stage 3: passage of the bolus head through the opening of the esophagus ( Fig 3 ).
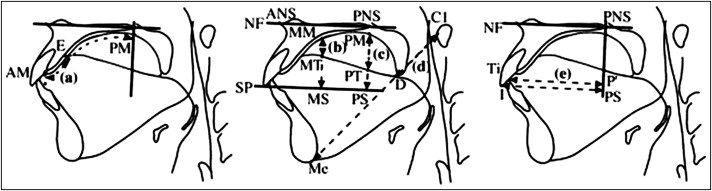
Linear measurements defined by Fujiki et al were made on these radiographs for each stage by 1 author (E.A.) to prevent interobserver variability. The reference points and planes are shown in Table II . Since AM-E and AM-PM are distances on tje palatal mucosa, they were curved lines. A ligature wire was used for the measurement of these parameters. MM-MT, MM-MS, PM-PT, PM-PS, C1-D, C1-Me, and PS-I are straight distances. P’-Ti is the shortest distance from a line crossing at a right angle to the NF plane through PNS to Ti ( Fig 4 ).
| Landmark | Definition |
|---|---|
| ANS | Most anterior point of the maxilla at the level of the palate |
| PNS | Most posterior point on the bony hard palate |
| Me | Lowest point on the symphyseal outline of the chin |
| I | Edge point of the maxillary incisor |
| CI | Front-most point of the atlas |
| NF | Plane through both ANS and PNS |
| SP | Plane passing the edge of the maxillary incisor and parallel to the palatal plane |
| AM | Boundary point between the maxillary central incisor and the palatal mucosa |
| E | Point nearest to the tongue base in the contact region between the tongue and the palatal mucosa |
| MM | Point at which the line crossing at a right angle to NF through the middle point between ANS and PNS intersects the palatal mucosa |
| MT | Point at which the line crossing at a right angle to NF through the middle point between ANS and PNS intersects the dorsum of the tongue |
| MS | Point at which the line crossing at a right angle to NF through the middle point between ANS and PNS intersects SP |
| PM | Point at which the line crossing at a right angle to NF through PNS intersects the palatal mucosa |
| PT | Point at which the line crossing at a right angle to NF through PNS intersects the dorsum of the tongue |
| PS | Point at which the line crossing at a right angle to NF through PNS intersects SP |
| D | Point at which the line through Me and CI intersects the dorsum of the tongue |
| Ti | Tongue tip |
The points and measurements of 24 patients were reevaluated 1 month later, and the method error was determined by Dahlberg’s formula, ME = √∑d2/2n
∑ d 2 / 2 n
, where n is the number of subjects and d is the difference between the 2 measurements of a pair. The method error did not exceed 0.153 mm. All statistical analyses of the groups were performed with the Statistical Package for Social Sciences for Windows software (version 13, SPSS, Chicago, Ill). The variables were examined visually and with the Shapiro-Wilks analysis for normal distribution. Table I shows the mean ages and various cephalometric values used to define the groups.
All descriptive statistics are given as means and standard deviations ( Table III ). Analysis of variance (ANOVA) for repeated measurements was used to evaluate the measurements obtained from the 3 stages, the 4 groups, and interactions of the 3 stages with the 4 groups. In case of differences, the Bonferroni post-hoc test was used to determine the causes of the differences between the stages or the groups. P ≤0.05 was accepted as the level of significant difference.
| Group 1 | Group 2 | Group 3 | Group 4 | |||||
|---|---|---|---|---|---|---|---|---|
| Mean (mm/mm) | SD | Mean (mm/mm) | SD | Mean (mm/mm) | SD | Mean (mm/mm) | SD | |
| Stage 1 | ||||||||
| AM-E/AM-PM | 0.175 | 0.095 | 0.175 | 0.090 | 0.185 | 0.090 | 0.266 | 0.057 |
| MM-MT/MM-MS | 0.575 | 0.170 | 0.586 | 0.229 | 0.568 | 0.209 | 0.607 | 0.157 |
| PM-PT/PM-PS | 0.554 | 0.228 | 0.545 | 0.211 | 0.565 | 0.208 | 0.308 | 0.080 |
| C1-D/C1-Me | 0.243 | 0.058 | 0.245 | 0.053 | 0.247 | 0.045 | 0.215 | 0.060 |
| P’-Ti/PS-I | 0.992 | 0.064 | 0.988 | 0.063 | 1.008 | 0.098 | 0.945 | 0.120 |
| Stage 2 | ||||||||
| AM-E/AM-PM | 0.233 | 0.090 | 0.227 | 0.097 | 0.225 | 0.101 | 0.297 | 0.070 |
| MM-MT/MM-MS | 0.469 | 0.285 | 0.445 | 0.273 | 0.416 | 0.132 | 0.663 | 0.153 |
| PM-PT/PM-PS | 0.538 | 0.220 | 0.511 | 0.203 | 0.522 | 0.154 | 0.239 | 0.100 |
| C1-D/C1-Me | 0.271 | 0.063 | 0.273 | 0.041 | 0.272 | 0.048 | 0.186 | 0.053 |
| P’-Ti/PS-I | 0.930 | 0.058 | 0.910 | 0.143 | 0.926 | 0.126 | 0.850 | 0.125 |
| Stage 3 | ||||||||
| AM-E/AM-PM | 0.238 | 0.091 | 0.225 | 0.083 | 0.232 | 0.089 | 0.271 | 0.051 |
| MM-MT/MM-MS | 0.391 | 0.162 | 0.401 | 0.175 | 0.383 | 0.155 | 0.403 | 0.219 |
| PM-PT/PM-PS | 0.449 | 0.187 | 0.478 | 0.199 | 0.441 | 0.147 | 0.382 | 0.153 |
| C1-D/C1-Me | 0.274 | 0.055 | 0.290 | 0.055 | 0.277 | 0.067 | 0.223 | 0.073 |
| P’-Ti/PS-I | 0.977 | 0.051 | 0.983 | 0.062 | 0.982 | 0.098 | 0.904 | 0.147 |
Results
In the within-group comparison of the stages ( Table IV ), the degree of contact between the anterior portion of the tongue and palate (AM-E/AM-PM) ( Fig 5 ) was significantly greater at stage 2 than at stage 1 ( P <0.05) in the mandibular protrusion group (group 1). The increase between stages 2 and 3 or 1 and 3 was not statistically significant ( P >0.05). This parameter also increased in the other groups, but it was not significant.
| Group | Stages | Mean difference | SE | P | Significance | ||
|---|---|---|---|---|---|---|---|
| Anterior portion of tongue | Mandibular prognathism | 1 | 2 | −0.058 | 0.020 | 0.026 | * |
| 3 | −0.063 | 0.026 | 0.063 | NS | |||
| 2 | 3 | −0.006 | 0.029 | 1.000 | NS | ||
| Maxillary retrognathism | 1 | 2 | −0.051 | 0.023 | 0.109 | NS | |
| 3 | −0.049 | 0.026 | 0.224 | NS | |||
| 2 | 3 | 0.002 | 0.029 | 1.000 | NS | ||
| Bimaxillary | 1 | 2 | −0.039 | 0.033 | 0.731 | NS | |
| 3 | −0.046 | 0.026 | 0.253 | NS | |||
| 2 | 3 | −0.007 | 0.028 | 1.000 | NS | ||
| Control | 1 | 2 | −0.031 | 0.019 | 0.359 | NS | |
| 3 | −0.005 | 0.018 | 1.000 | NS | |||
| 2 | 3 | 0.026 | 0.018 | 0.532 | NS | ||
| Middle portion of tongue | Mandibular prognathism | 1 | 2 | 0.106 | 0.071 | 0.439 | NS |
| 3 | 0.184 | 0.050 | 0.004 | † | |||
| 2 | 3 | 0.078 | 0.060 | 0.615 | NS | ||
| Maxillary retrognathism | 1 | 2 | 0.140 | 0.061 | 0.095 | NS | |
| 3 | 0.184 | 0.047 | 0.003 | † | |||
| 2 | 3 | 0.044 | 0.052 | 1.000 | NS | ||
| Bimaxillary | 1 | 2 | 0.151 | 0.040 | 0.003 | † | |
| 3 | 0.184 | 0.057 | 0.012 | * | |||
| 2 | 3 | 0.033 | 0.040 | 1.000 | NS | ||
| Control | 1 | 2 | −0.056 | 0.052 | 0.882 | NS | |
| 3 | 0.204 | 0.046 | 0.001 | ‡ | |||
| 2 | 3 | 0.260 | 0.058 | 0.001 | ‡ | ||
| Posterior portion of tongue | Mandibular prognathism | 1 | 2 | 0.017 | 0.055 | 1.000 | NS |
| 3 | 0.106 | 0.053 | 0.183 | NS | |||
| 2 | 3 | 0.089 | 0.049 | 0.255 | NS | ||
| Maxillary retrognathism | 1 | 2 | 0.034 | 0.056 | 1.000 | NS | |
| 3 | 0.067 | 0.069 | 1.000 | NS | |||
| 2 | 3 | 0.033 | 0.047 | 1.000 | NS | ||
| Bimaxillary | 1 | 2 | 0.043 | 0.058 | 1.000 | NS | |
| 3 | 0.125 | 0.057 | 0.124 | NS | |||
| 2 | 3 | 0.081 | 0.047 | 0.295 | NS | ||
| Control | 1 | 2 | 0.069 | 0.024 | 0.031 | * | |
| 3 | −0.074 | 0.037 | 0.170 | NS | |||
| 2 | 3 | −0.142 | 0.034 | 0.001 | ‡ | ||
| Root of tongue | Mandibular prognathism | 1 | 2 | −0.028 | 0.015 | 0.230 | NS |
| 3 | −0.032 | 0.017 | 0.233 | NS | |||
| 2 | 3 | −0.003 | 0.017 | 1.000 | NS | ||
| Maxillary retrognathism | 1 | 2 | −0.028 | 0.014 | 0.212 | NS | |
| 3 | −0.045 | 0.013 | 0.007 | † | |||
| 2 | 3 | −0.017 | 0.014 | 0.641 | NS | ||
| Bimaxillary | 1 | 2 | −0.025 | 0.013 | 0.217 | NS | |
| 3 | −0.030 | 0.016 | 0.210 | NS | |||
| 2 | 3 | −0.005 | 0.019 | 1.000 | NS | ||
| Control | 1 | 2 | 0.029 | 0.018 | 0.348 | NS | |
| 3 | −0.008 | 0.020 | 1.000 | NS | |||
| 2 | 3 | −0.037 | 0.018 | 0.153 | NS | ||
| Tip of tongue | Mandibular prognathism | 1 | 2 | 0.062 | 0.016 | 0.002 | † |
| 3 | 0.015 | 0.014 | 0.843 | NS | |||
| 2 | 3 | −0.047 | 0.016 | 0.023 | * | ||
| Maxillary retrognathism | 1 | 2 | 0.078 | 0.035 | 0.108 | NS | |
| 3 | 0.004 | 0.013 | 1.000 | NS | |||
| 2 | 3 | −0.074 | 0.036 | 0.165 | NS | ||
| Bimaxillary | 1 | 2 | 0.082 | 0.036 | 0.096 | NS | |
| 3 | 0.026 | 0.033 | 1.000 | NS | |||
| 2 | 3 | −0.056 | 0.037 | 0.429 | NS | ||
| Control | 1 | 2 | 0.095 | 0.035 | 0.038 | * | |
| 3 | 0.041 | 0.045 | 1.000 | NS | |||
| 2 | 3 | −0.054 | 0.045 | 0.728 | NS | ||
Stay updated, free dental videos. Join our Telegram channel
VIDEdental - Online dental courses


