Introduction
Airway size increases are associated with maxillomandibular advancement (MMA) surgery and improvement or elimination of obstructive sleep apnea (OSA). The 3-dimensional morphologic, volumetric, height, cross-sectional surface area, and diameter changes of the upper airway in patients with OSA after MMA, however, are not well understood.
Methods
Patients with moderate or severe OSA who underwent MMA surgery were evaluated by preoperative and postoperative cone-beam computed tomography scans and polysomnograms. The upper airway space was also divided into retropalatal and retroglossal spaces and was analyzed for volumetric, height, cross-sectional surface area, transverse, and anteroposterior diameter changes.
Results
Ten consecutive OSA patients with an average preoperative apnea/hypopnea index of 46 and treated with MMA surgery were included in this study. There were 8 men and 2 women, with an average age of 46 years and an average body mass index of 28. There was an average of a 2.5-fold increase in the total volume of the upper airway space. The retropalatal space increased by 3.5-fold. The retroglossal space increased by 1.5-fold. The greatest change in a cross-sectional area occurred in the transverse axis in both the retroglossal and retropalatal spaces. The average apnea/hypopnea index was 4 postoperatively.
Conclusion
MMA surgery results in a significant increase in the volume and a morphologic airway change from a round to an elliptical f shape in the upper airway space in patients with OSA. The combination of these actions reduces the collapsibility of the upper airway space, hence improving or resolving the OSA.
Highlights
- •
Postsurgical polysomnograms improved in obstructive sleep apnea in patients after maxillomandibular advancement.
- •
Patients who do not tolerate continuous positive airway pressure might benefit from maxillomandibular advancement.
Obstructive sleep apnea (OSA) is a disease of abnormal upper airway anatomy. A small upper airway can be caused by the relative positions of the maxillofacial skeletal structures and of the dental arches to one another and to the cranial base. An upper airway size of about 40 to 67.1 mm 2 at the smallest cross-sectional area in adults has been shown to be associated with sleep apnea. This is in comparison with an area of 149.3 mm 2 in normal adults. The position, size, and degree of oropharyngeal soft-tissue collapse during deep stages of sleep affect the upper airway, and this is also influenced by the body mass index. Treating patients successfully with OSA remains a challenge among all dental and medical specialists. Continuous positive airway pressure (CPAP) therapy is still prescribed as the first line of therapy and considered the gold standard in the treatment of OSA patients. However, CPAP therapy has compliance limitations, and patients still seek alternative treatment options, including upper airway surgery. However, we lack rigorous data on the outcomes of surgical management of OSA patients, high-level controlled studies in the medical literature, and standardized criteria to define surgical success. Shortcomings described in the systematic review and meta-analysis by Caples et al were inconsistent data in preoperative imaging as well as evaluations of the upper airway. There is also an absence of systematic reviews of cone-beam computed tomography (CBCT) imaging and validation of the analysis methodology of the upper airway in OSA patients in the peer-reviewed literature.
CBCT has revolutionized the field of maxillofacial surgery. It has allowed for the accurate visualization of upper airway anatomic regions in 3-dimensional (3D) and 2-dimensional patterns, reduced the amount of exposed ionizing radiation, and provided the immediate convenience of an in-office imaging system. This has aided practitioners in the diagnosis, treatment planning, outcome assessment of surgery, and education of patients regarding their condition. CBCT has been used to evaluate the upper airway anatomy in many software programs. Some of the computer viewing software programs showed high correlations but are inaccurate in the measurement of the upper airway volume. Today, the only commercially available software viewer program that has been shown to be accurate and reliable for measuring the upper airway volume is the 3dMDVultus software (3dMD, Atlanta, Ga). Total airway volume and smallest airway area have also been shown to correlate with the severity of OSA.
At the present time, maxillomandibular advancement (MMA) remains the most effective surgical procedure in treating patients with moderate to severe OSA, although only 1 study has been assigned a level of 1b in a systematic literature search. Advancement of maxillofacial skeletal structures opens the oropharyngeal airway and places the oropharyngeal musculature on tension, although these changes are still not well understood in 3 dimensions. These changes are stated to reduce the collapsibility of the upper airway during deep stages of sleep. It has been shown in the peer-reviewed literature that the success rates are as high as into the 90th percentile.
The aim of this study was to analyze the morphologic, volumetric, height, cross-sectional surface area, and diameter changes of the upper airway in a systematic fashion in patients with OSA before and after MMA surgery. Understanding the pathologic anatomy of the upper airway of the OSA patient and how it changes with MMA surgery will aid surgeons and orthodontists in the treatment planning for these patients. We describe in a comprehensive and systematic fashion the evaluation of the upper airway of OSA patients before and after MMA surgery. Our hypothesis was that the advancements of the maxilla and the mandible cause significant increases in the upper airway volume and are associated with improved scores in the polysomnogram (PSG) and other clinical measurements of OSA.
Material and methods
Patients with proven moderate or severe OSA who underwent MMA surgery were evaluated by preoperative and postoperative CBCT scans and PSGs. The CBCT scans were done on the same scanner in neutral head position while the patients were seated. The DICOM data were then analyzed via the 3dMDVultus software. The study was approved by Stanford University’s review board (number 21314). A systematic analysis of the upper airway changes was the performed by comparing the presurgical and postsurgical scans. The upper airway space (UAS) was identified and measured from the level of the posterior nasal spine to the hyoid bone. The UAS was also divided into the retropalatal space (from the level of posterior nasal spine to the lower edge of the soft palate) and the retroglossal space (from the lower edge of the soft palate to the hyoid bone). The UAS was analyzed for volumetric, height, cross-sectional surface area, transverse, and anteroposterior diameter changes.
A diagnosis of OSA was confirmed by overnight polysomnography, and the upper airway was evaluated with nasal endoscopy. Each patient underwent a CBCT scan on the same machine (i-CAT; Imaging Sciences International, Hatfield, Pa), and 3D cephalometric analysis was performed preoperatively on each patient. The patients were in preoperative orthodontic treatment initially for an average of 6 months. The 3dMDVultus software was used for virtual surgical planning to optimize the functional and esthetic results and to perform an automated airway analysis. Dental models were taken, and model surgery was performed, with fabrication of intermediate and final splints. Maxillomandibular advancement was performed on each patient. Genioglossal advancement was also performed when indicated to normalize dentofacial structures and improve procedural outcomes. Septoplasty with inferior turbinate reduction out-fracture was also performed when indicated by a preoperative small nasal airway with turbinate hypertrophy or septa deviation.
In the operating room, under general anesthesia with nasal endotracheal tube and local anesthetic with epinephrine, maxillary LeFort I and mandibular bilateral sagittal split osteotomies were performed. The redundant maxillary, palatine, and vomer bones were harvested and used as bone grafts to the maxilla. The maxilla was mobilized and placed into an intermediate splint and then fixated into the advanced position using rigid plates and screws. When indicated, a septoplasty or partial inferior turbinectomies were performed once the maxilla was down-fractured and before fixation. Next, bilateral sagittal split osteotomies of the mandible were performed. The mandible was advanced into occlusion using a final splint and fixated with rigid plates and screws. When indicated, a genial osteotomy that captured the genial tubercle and the genioglossal muscle was performed; this caused advancement to the desired position that was fixated with rigid plates and screws.
The patients were admitted postoperatively to the surgical intensive care unit for airway observation and medical management. They were then transferred to the surgical floor on the first postoperative day and discharged once they were tolerating adequate oral intake and oral pain medication. The patients were seen routinely for follow-up by both the surgeon and the orthodontist. Postoperative CBCT scans, upper airway analyses, and PSGs were performed at a minimum of 3 months postoperatively.
Patients with proven moderate to severe OSA who underwent MMA surgery were evaluated by preoperative and postoperative CBCT scans and PSG. The CBCT scans were done in neutral head position on the same scanner by the same operator while the patient was seated. The DICOM data were then analyzed via the 3dMDVultus software. This computer-assisted 3D airway analysis has been previously shown to be accurate and reproducible. A systematic analysis of the upper airway changes was then performed by comparing the presurgical and postsurgical scans. The UAS was identified and measured from the level of the posterior nasal spine to the hyoid bone. The UAS was also divided into retropalatal space (from the level of posterior nasal spine to the lower edge of the soft palate) and retroglossal space (from the lower edge of the soft palate to the hyoid bone). The UAS was analyzed for volumetric, height, cross-sectional surface area, transverse, and anteroposterior diameter changes.
Results
Ten consecutive moderate to severe OSA patients diagnosed by PSG and treated by MMA were included in this study. Average age at surgery was 46.4 years (range, 35-62 years). Eight patients were men, and 2 were women. The preoperative apnea-hypopnea index (AHI) averaged 42 (range, 16-68). An AHI of less than 5 is considered normal ( Table I ). Preoperative body mass index averaged 28.6. The mean maxillary movement was 9.4 mm, the mean mandibular movement was 9.5 mm, and the average genioglossal movement when performed was 6 mm ( Table II ). There were no major complications and 2 minor complications: 1 patient had an infection requiring plate removal at a later date, and a second patient had an unfavorable split that was managed intraoperatively, resulting in a complete osteotomy and advancement without adverse consequences.
| Patient | Sex | Age (y) | BMI | Before AHI | After AHI |
|---|---|---|---|---|---|
| NB | M | 51 | 27 | 42 | 3.8 |
| CD | M | 36 | 30.5 | 31 | 0 |
| KG | M | 51 | 29 | 48 | 0 |
| RJ | M | 35 | 28 | 54.6 | 1.5 |
| SD | M | 47 | 23 | 18 | 4 |
| VE | F | 49 | 19.8 | 53.5 | 28.4 |
| TM | M | 56 | 29.2 | 21 | 5 |
| RC | M | 47 | 35 | 68 | 3 |
| NS | M | 65 | 27 | 77 | 4 |
| MS | F | 62 | 37 | 16 | 2 |
| Patient | Skeletal pattern | Mandibular advancement (mm) | Maxillary advancement (mm) | Chin advancement (mm) |
|---|---|---|---|---|
| NB | ll | 9 | 9 | 8 |
| CD | l | 9 | 9 | 0 |
| KG | ll | 9 | 9 | 0 |
| RJ | ll | 12 | 8 | 6 |
| SD | ll | 11 | 8 | 0 |
| VE | ll | 11 | 10 | 4 |
| TM | l | 11 | 11 | 0 |
| RC | ll | 9 | 9 | 0 |
| NS | ll | 10 | 8 | 0 |
| MS | ll | 6 | 4 | 0 |
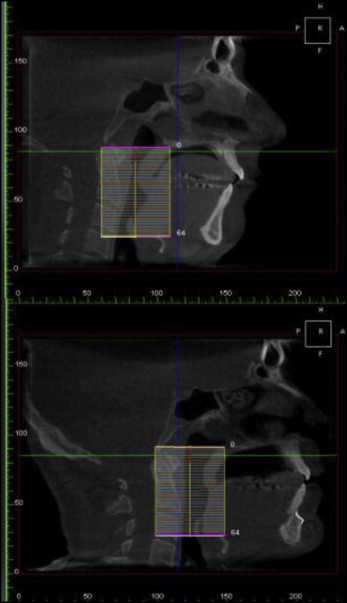
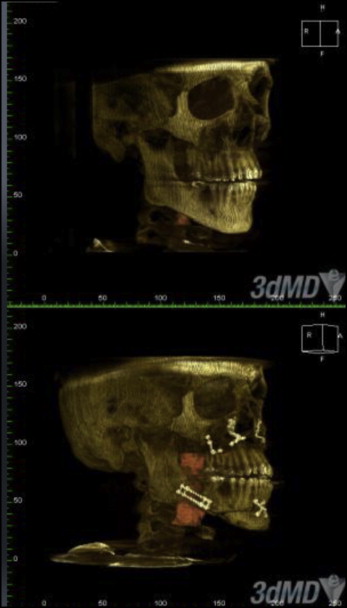
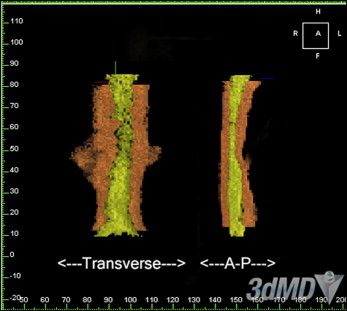
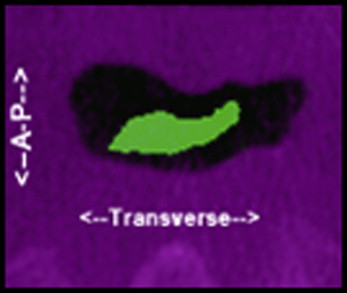
The volume of the UAS increased significantly by 237% as a result of the maxillomandibular advancement ( Figs 1-3 ). The retropalatal volume increased more than the retroglossal volume, 361% to 165%. The average area of the smallest airway (choke point) before surgery was 74.1 mm 2 , and after surgery it was 176.9 mm 2 . The surface area at the choke point in the retropalatal space also increased by a greater percentage than did the retroglossal space, 664.22% vs 100.98% ( Fig 4 ). As such, the location of the choke point generally is in the retropalatal space before surgery and in the retroglossal space after surgery. Normalization of the airway refers to the change in shape of the UAS from a funnel shape to a tube-like shape.


Looking more closely at surface-area slices, we found that the transverse dimension increased more than the anteroposterior dimension in millimetric changes ( Figs 3 and 4 ; Tables III-VI ). However, the anteroposterior dimension increased more than did the transverse dimension in percentage change; this is because the anteroposterior dimension is generally smaller than the transverse dimension: most airways are spheroid. Thus, the airway increases the most in a lateral fashion. The retropalatal space again increased more in both the transverse and anteroposterior dimensions than did the retroglossal space. Two-dimensional cephalometric studies fail to account for the changes in the transverse dimension.
| Change in UAV (%) | RPV (cc 3 ) | Change in RPV (%) | RGV (cc 3 ) | Change in RGV (%) | ||
|---|---|---|---|---|---|---|
| Presurgery | Postsurgery | Presurgery | Postsurgery | |||
| 540.60 | 1.33 | 8.46 | 536.09 | 1.89 | 13 | 587.83 |
| 35.19 | 3.97 | 4.49 | 13.10 | 3.59 | 5.73 | 59.61 |
| 41.72 | 3.91 | 5.77 | 47.57 | 7.16 | 10.67 | 49.02 |
| 793.06 | 1.2 | 20.56 | 1613.30 | 2.26 | 9.34 | 313.27 |
| 37.97 | 4.92 | 8.89 | 80.69 | 5.41 | 5.53 | 2.22 |
| 137.93 | 7.44 | 16.04 | 115.59 | 4.82 | 8.02 | 66.39 |
| 72.47 | 4.7 | 10.69 | 127.45 | 7 | 12.15 | 73.57 |
| 268 | 3.4 | 8.98 | 264 | 7.01 | 15.31 | 228 |
| 270 | 4.49 | 9.86 | 219 | 6.7 | 7.66 | 114 |
| 197 | 6.07 | 10.36 | 170 | 1.91 | 5.28 | 276 |
| Patient | Preoperative smallest RP area (mm 2 ) | Postoperative smallest RP area (mm 2 ) | Change (%) | Preoperative smallest RG area (mm 2 ) | Postoperative smallest RG area (mm 2 ) | Change (%) | Preoperative smallest area location | Postoperative location of the smallest area |
|---|---|---|---|---|---|---|---|---|
| NB | 19.7 | 191.87 | 873.47 | 49.68 | 155.34 | 212.68 | RP | RG |
| CD | 74.52 | 61.83 | −17.03 | 88.65 | 116.01 | 30.86 | RP | RP |
| KG | 103.8 | 158.85 | 53.03 | 109.89 | 152.01 | 38.33 | RP | RG |
| RJ | 8.37 | 273.5 | 3167.62 | 44.28 | 156.6 | 253.66 | RP | RG |
| SD | 104.84 | 187.83 | 79.16 | 107.46 | 161.1 | 49.92 | RP | RG |
| VE | 139.7 | 400.58 | 186.74 | 133.65 | 268.46 | 100.87 | RG | RG |
| TM | 95.36 | 387.69 | 306.55 | 60 | 72.32 | 20.53 | RG | RG |
| RC | 48.78 | 395.2 | 810 | 121.32 | 368.45 | 304 | RP | RG |
| NS | 99.63 | 277.9 | 228 | 196.55 | 183.78 | −9 | RP | RG |
| MS | 68.85 | 197.09 | 286 | 75.33 | 188.64 | 249 | RP | RG |
| Average % change RP | 664.22% | |||||||
| Average % change RG | 100.98% | |||||||
| Preoperative smallest area location | Retropalatal | |||||||
| Postoperative location of smallest area | Retroglossal |
| Patient | Preoperative RP, AP distance (mm) | Postoperative RP, AP distance (mm) | Difference (mm) | Preoperative RG, AP distance (mm) | Postoperative RG, AP distance (mm) | Difference (mm) |
|---|---|---|---|---|---|---|
| NB | 2 | 5.7 | 3.7 | 5.4 | 6.9 | 1.5 |
| CD | 5.7 | 6.6 | 0.9 | 6 | 9 | 3 |
| KG | 3 | 4.5 | 1.5 | 6.9 | 8.7 | 1.8 |
| RJ | 6 | 25.2 | 19.2 | 4.2 | 6.6 | 2.4 |
| SD | 2.1 | 6.9 | 4.8 | 5.1 | 6 | 0.9 |
| VE | 4.8 | 9.6 | 4.8 | 3.9 | 12.6 | 8.7 |
| TM | 4 | 11.2 | 7.2 | 6.4 | 6.4 | 0 |
| RC | 4.8 | 15.9 | 11.1 | 9.6 | 17.5 | 7.9 |
| NS | 6.9 | 14.1 | 7.2 | 10.2 | 6.93 | −3.3 |
| MS | 3 | 7.5 | 4.5 | 3 | 15.3 | 12.3 |
Stay updated, free dental videos. Join our Telegram channel

VIDEdental - Online dental courses


