In this article, we discuss the development of methods for computer-aided jaw surgery, which allows us to incorporate the high level of precision necessary for transferring virtual plans into the operating room. We also present a complete computer-aided surgery system developed in close collaboration with surgeons. Surgery planning and simulation include construction of 3-dimensional surface models from cone-beam computed tomography, dynamic cephalometry, semiautomatic mirroring, interactive cutting of bone, and bony segment repositioning. A virtual setup can be used to manufacture positioning splints for intraoperative guidance. The system provides further intraoperative assistance with a computer display showing jaw positions and 3-dimensional positioning guides updated in real time during the surgical procedure. The computer-aided surgery system aids in dealing with complex cases with benefits for the patient, with surgical practice, and for orthodontic finishing. Advanced software tools for diagnosis and treatment planning allow preparation of detailed operative plans, osteotomy repositioning, bone reconstructions, surgical resident training, and assessing the difficulties of the surgical procedures before the surgery. Computer-aided surgery can make the elaboration of the surgical plan a more flexible process, increase the level of detail and accuracy of the plan, yield higher operative precision and control, and enhance documentation of cases.
Orthognathic surgery involves repositioning segments of the jaws. Reconstructive procedures entail replacement of missing or damaged anatomic structures by grafts or implants. Each patient in craniomaxillofacial surgery has unique properties and requires careful preparation. Conventional methods to prepare for orthognathic surgery rely on lateral and frontal radiographic images. These are only of limited help for understanding complex 3-dimensional (3D) defects and planning appropriate corrections. Cone-beam computed tomography (CBCT) allows acquisition of 3D images of the patient’s head. CBCT is now used routinely for the diagnosis of severe abnormalities of the craniofacial skeleton. Even with the availability of CBCT, the surgical plan is still normally prepared by using 2-dimensional (2D) radiographic images. In the past 10 years, some research centers and commercial companies have strived to provide software environments that allow preparation of the operative plan on 3D models of the skeletal base extracted from the CBCT. As these planning systems begin to be used in clinical practice, it is important to validate their clinical applications and critically assess the difficulty of transferring virtual plans into the operating room.
In this article, we discuss methods for computer-aided jaw surgery and present applications of a complete computer-aided surgery (CAS) system, the CMFApp software, under development at the Maurice Müller Institute, Bern, Switzerland. The applications and adaptation of this CAS system result from the collaboration of our research center at the University of North Carolina with the Maurice Müller Institute.
Material and methods
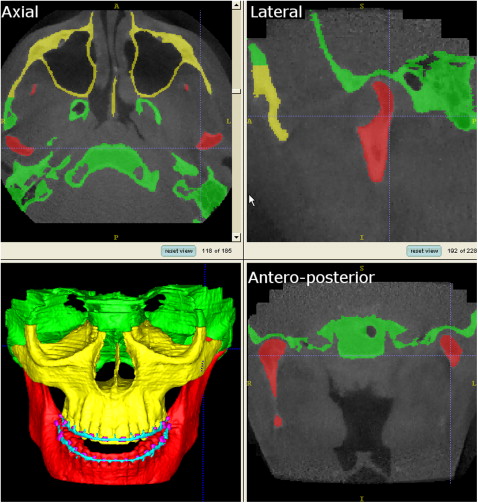
The methods for CAS systems in jaw surgery follow procedures from the image scanners to the operating room ( Fig 1 ): (1) data acquisition: collection of diagnostic data; (2) image segmentation (ITK-SNAP open source software, www.itk-snap.org ) : identification of anatomic structures of interest in the image data sets; (3) visualization (CMFApp software) : 3D display of the anatomic structures; (4) diagnosis (CMFApp software) : extraction of clinical information from the 3D representations of the anatomy; (5) planning and simulation (CMFApp software) : preparation of an operative plan by using the virtual anatomy and a simulation of the outcome; and (6) intraoperative guidance (CMFApp software) : assistance for intraoperative realization of the virtual plan.
Diagnosis of skeletal discrepancies is based on visual data from various sources: clinical examination, 3D photographic examination, CBCT, and digital dental models. A CAS must integrate many records to characterize the orthodontic diagnosis and formulate the treatment plan. The first advantage of a software-based solution is its capacity for data organization. The different sources of anatomic and diagnostic data can be stored in 1 location, correlated, and viewed as a combined display. As image modalities and sources of data multiply, these information-handling abilities will prove even more valuable, particularly if connected with planning and intraoperative guidance functions.
Multi-modality registration is available for several commercial software programs, such as 3DMDvultus (3DMD, Atlanta, Ga), Maxilim (Medicim, Mechelen, Belgium), Dolphin Imaging (Dolphin Imaging & Management Solutions, Chatsworth, Calif), InVivoDental (Anatomage, San Jose, Calif), and SimPlant OMS (Materialise, Leuven, Belgium). We focus specifically on the surgical simulation procedures executed on 3D surface models built from CBCT. However, the CMFApp software (developed with funding from the Co-Me network ) provides a uniform medical data-handling backbone to collect all anatomic, diagnostic, planning, and intraoperative guidance and monitoring information in a structured file in XML format. This includes preoperative CBCT images, skeletal models, acquired dental occlusion, operative plans, diagnostic data (3D cephalometry, mirrored structures), planning data (osteotomy lines, repositioning plans), guidance data (registration points and transformations), postoperative CBCT images, and so on. This file can be shared among different CAS applications. This data-handling mechanism is part of a modular software framework that permits seamless assembly of software components and sharing of data between these components, and it facilitates system extension.
For CBCT images, once they are acquired, the DICOM files can be imported into the 3D image-analysis software. Next, in a process known as image segmentation, we identify and delineate the anatomic structures of interest in the CBCT image. In orthodontics and orthognathic surgery, the goal of segmentation is to obtain a 3D representation of the hard and soft tissues that is usable for virtual planning.
Currently available 3D image-analysis software tools offer many manual, semiautomatic, and fully automatic segmentation techniques. For routine clinical use, a fully automated segmentation protocol is preferable because it requires only limited interaction with the user. Segmentation is a preparatory step for surgical planning and should be performed as quickly as possible. A simple way to segment bone in CBCT is thresholding. This is the technique used in commercial software such as Dolphin, 3DMD Vultus, and Maxilim. Thresholding classifies a voxel (element of volume in a 3D image) depending only on its intensity. A certain intensity range is specified with lower and upper threshold values. Each voxel belongs to the selected class (eg, bone) if, and only if, its intensity level is within the specified range. The appropriate value range must be selected for each patient because bone density varies between patients, and intensity values of bone can vary between scanners.
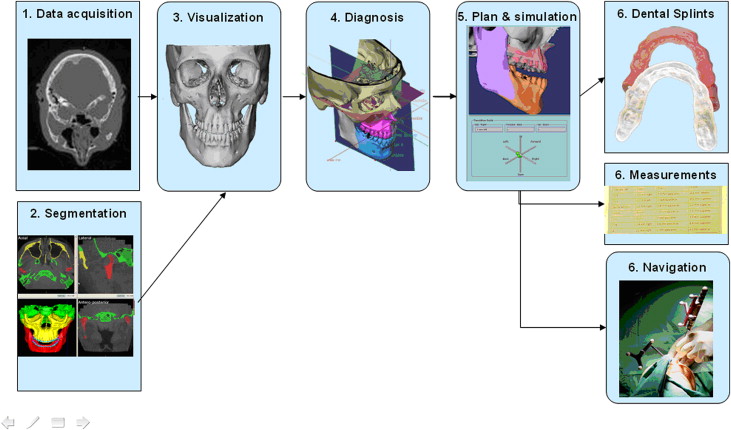
The major limitation of thresholding is that it is prone to artifacts. These artifacts are created because different densities in a voxel are averaged and then represented by 1 CBCT number. Therefore, the CBCT numbers of thin bony walls tend to drop below the thresholding range of bone because their density is averaged with that of surrounding air. This effect causes artificial holes in 3D reconstructions of the condyles and areas of thin cortical bone, such as the internal ramus of the mandible and much of the maxilla. Another source of artifacts is metal in the face (orthodontic appliances, dental fillings, implants, surgical plates). Metal artifact intensity values fall into the thresholding range of bone and are included in CBCT images as pronounced star-like streaks. The morphology and position of the condyles, and internal surfaces of the ramus and the maxilla, are critical for careful virtual surgery planning. To best capture these and other areas, our method of choice for the segmentation procedures uses ITK-SNAP software. ITK-SNAP was developed, based on the National Institutes of Health Visualization Tool Kit and Image Tool Kit, as part of the National Institutes of Health Roadmap Initiative for National Centers of Biomedical Computing. The automatic segmentation procedures in ITK-SNAP use 2 active contour methods to compute feature images based on the CBCT image’s gray level intensity and boundaries ( Fig 2 ). The first method causes the active contour to slow down near edges, or discontinuities, of intensity. The second causes the active contour to attract to boundaries of regions of uniform intensity.
After obtaining the segmentation result, manual postprocessing is normally necessary. Artifacts from metallic elements need to be removed. The 2 jaws are usually connected because of insufficient longitudinal image resolution and must be separated in the temporomandibular joint and on the occlusal surface in particular. For this reason, it was recommended that the CBCT image should be taken in centric occlusion with a stable and thin bite-registration material. On a laptop computer equipped with 1 GB of RAM, the initial mesh generation step typically takes about 15 minutes. Manual postprocessing usually takes longer, up to several hours (separation of the jaws can be particularly tedious). Currently, this manual postprocessing step is too time-consuming and not practical for the surgeon. However, some groups have recommended that these steps can be outsourced to radiology technicians at imaging centers. Further research in advanced segmentation methods is essential to reach the ideal of an accurate and continuous individual segmentation of the skeletal base, with only a few mouse clicks. This needs to be possible with images of even poor quality.
After segmentation of the anatomic structures of interest, 2 technological options are available to visualize these structures 3 dimensionally. The first are surface-based methods, which require the generation of an intermediate surface representation (triangular mesh) of the object to be displayed. The second are volume-based methods, which create a 3D view directly from the volume data.
The advantages of surface-based methods are the detailed shading of the facial surfaces at any zoom factor. Also, any other 3D structure that can be represented by a triangular mesh can be easily included in the anatomic view (eg, implants imported from computer-aided design implant databases). Most Cranio-maxillofacial (CMF) surgery-planning software programs (including the CMFApp described here) use surface-based visualization. An obvious disadvantage of surface-based methods is the need for an intermediate surface representation.
Some developments in computer-aided CMF surgery use volume-based visualization—eg, the commercial Voxim (IVS Solutions AG, Chemnitz, Germany)—based on a highly optimized volume representation showing good detail and performance on clinical data sets. The advantages of volumetric methods are direct visualization of volumetric operations not only in 3D, but also on cross-sectional image views. Virtual osteotomies are applied on the original image data set. However, it is difficult to establish the boundaries between tissues and assign the proper color or transparency values to obtain the desired display. Moreover, the image intensity for a tissue can vary between patients and scanners (eg, bone density varies with age, and there are variations in scanner calibrations, and so on). Virtual cutting operations are much more difficult to simulate in voxel-wise representations. Further evolutions in software and graphics hardware that combine both surface-based and volume-based visualization technologies have great potential.
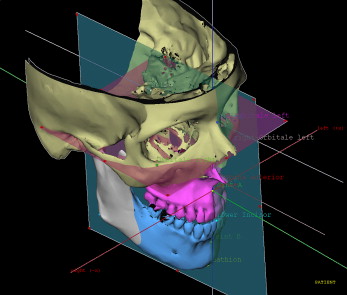
Correction of dentofacial deformities often requires rotational movements of the 3D cephalometry; deformities are impossible to represent correctly in lateral or frontal planes only. In the CMFApp software, cephalometry is performed on the 3D skeletal model generated from the CBCT image, defining landmarks, lines, planes, and measurements. Definition of individual coordinate systems is possible; these are used to express all displacement values during movement planning and intraoperative navigation ( Fig 3 ).
The use of computers for cephalometric analysis allows new assessment methodologies. Morphometrics is the branch of mathematics studying shapes and shape changes of geometric objects. Cephalometrics is a subset of morphometrics. Clinical cephalometric analyses have been based on a set of points, either of anatomic meaning or from an abstract definition (such as the middle point between 2 other points). Surface and shape data from 3D imaging provide new characterization schemes, based on higher-order mathematical entities (eg, spline curves and surfaces). Cutting et al and Subsol et al introduced the concept of ridge curves for automatic cephalometric characterization. Ridge curves (also known as crest lines) of a surface are the loci of the maximal curvature in the associated principal curvature directions. The ridge lines of a surface convey rich and compact information, which tends to correspond to natural anatomic features. Lines of high curvature are typical reference features in the craniofacial skeleton.
Future studies will establish new standards for 3D measurements in the craniofacial skeleton. New developments in this area might lead to comprehensive 3D morphometric systems including surface-based and volume-based computed shape measurements. They could also lead to 4-dimensional shape information that integrates evolution over time in the analysis.
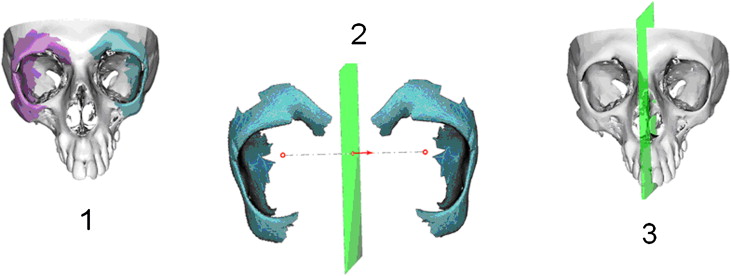
Mirroring can be a valuable technique in the treatment of asymmetries. This allows the normal contralateral side to be used as a reference. The conventional definition of the symmetry plane is the midsagittal plane. In 2D cephalometry, the midline is defined with a number of anatomic landmarks on the frontal cephalogram and used as a reference to measure the distance to laterally positioned landmarks. Facial asymmetry is assessed and determined by the differences between measurements on both sides. Transposition of this conventional 2D landmark-based definition scheme in 3D works well to obtain a plane that accounts for global symmetry of the entire face. Previous work on a landmark-based midsagittal plane showed that the definition of the midsagittal plane is reliable. However, the choice of landmarks used to determine the midsagittal plane has a marked impact on the asymmetry quantification. In a particular face, symmetry is often better described by several regional symmetry axes (eg, symmetry between the jaw and midface regions often differs) for which there is no defining landmark set. In patients with severe mandibular asymmetries, as in craniofacial microsomia, entire regions of the anatomy might be missing or severely dislocated. Thus, selection of landmarks in the mandible could result in an incorrect quantification of asymmetry.
For this reason, the CMFApp software also allows surface-based definition of symmetry planes. This allows the user to select equivalent surface regions on both sides ( Fig 4 ). An automatic optimization process calculates the symmetry plane, which is most able to reflect the correspondence of these regions. This is a key requirement for the usability of mirroring techniques. The symmetry plane should be adjusted to the selected symmetrical structure to obtain as close a match as possible between the mirrored healthy structure and the affected site.