Introduction
A significant objective of orthodontic treatment is to achieve proper and stable tooth positions that involve not only the crowns, but also their roots. However, the current methods of clinically monitoring root alignment are unreliable and inaccurate. Therefore, the purpose of this study was to develop a methodology that can accurately identify root position in a clinical situation.
Methods
Pretreatment and posttreatment cone-beam computed tomography (CBCT) and extraoral laser scans of study models of a patient were obtained. Threshold segmentation of the CBCT scans was performed, resulting in 3-dimensional surface models. The pretreatment CBCT teeth were isolated from their respective arches for individual tooth manipulation. These isolated pretreatment CBCT teeth were superimposed onto the posttreatment surface scan depicting the expected root position setup. To validate the accuracy of the expected root position setup, it was compared with the true root position represented by the posttreatment CBCT scan. Color displacement maps were generated to measure any differences between the expected and true root positions.
Results
Color map analysis through crown superimposition showed displacement differences of 0.148 ± 0.411 mm for the maxillary roots and 0.065 ± 0.364 mm for the mandibular roots.
Conclusions
This methodology has been demonstrated to be an accurate and reliable approach to visualize the 3-dimensional positions of all teeth, including the roots, with no additional radiation applied.
The principal aims of orthodontic treatment are to maneuver teeth from malocclusion to an esthetic, functional, and stable occlusion with each whole tooth, crown and root included, positioned properly in 3 dimensions. To achieve this ideal occlusion, orthodontists often use Andrews’ 6 keys as general guidelines. Four of Andrews’ keys (mesiodistal, faciolingual, and occlusal gingival positions, and axial rotation) are governed solely by the crowns of the teeth and are straightforward to monitor clinically. However, because crowns do not always accurately indicate the whole tooth angulation and inclination, the remaining keys (mesiodistal angulation and faciolingual inclination) are better judged by involving the roots. Therefore, the ability to visualize the roots of the teeth would significantly help orthodontists to achieve all 6 keys.
The gold standard for monitoring and finalizing root position is to check panoramic x-rays at the initial, progress, and finishing stages of orthodontic treatment. However, panoramic x-rays may be inaccurate in depicting the true root positions. Numerous studies have shown that panoramic radiographs contain distortions because of nonorthogonal x-ray beams directed at the target teeth. Yet most orthodontists still use panoramic radiographs to visualize and correct root positions as shown in a 2008 survey, which found that 67.4% and 80.1% of American orthodontists take progress and posttreatment panoramic x-rays, respectively, because better alternatives are not readily available. Therefore, the development of a new and accurate approach for visualizing the position and angulation of roots is necessary.
Cone-beam computed tomography (CBCT) is a technique that has recently become more commonly used in orthodontics. Unlike panoramic radiographs, CBCT scans depict the true root positions and angulations in 3 dimensions. Furthermore, any distortions in the CBCT scans have been shown to be clinically insignificant. However, clinicians often take progress and posttreatment records, which would require multiple CBCT scans. Multiple scans would expose the patient to higher levels of radiation; this is not recommended clinically, especially in children.
Recently, a new methodology was reported that combines a single CBCT image with intraoral scans with the capability to track the root position at any stage of orthodontic treatment. However, this approach was demonstrated only in an ex-vivo typodont model. The aim of this study was to translate this previously reported methodology from a bench-top typodont model to a patient to develop an accurate approach to monitor root positions clinically throughout orthodontic treatment with minimal radiation.
Material and methods
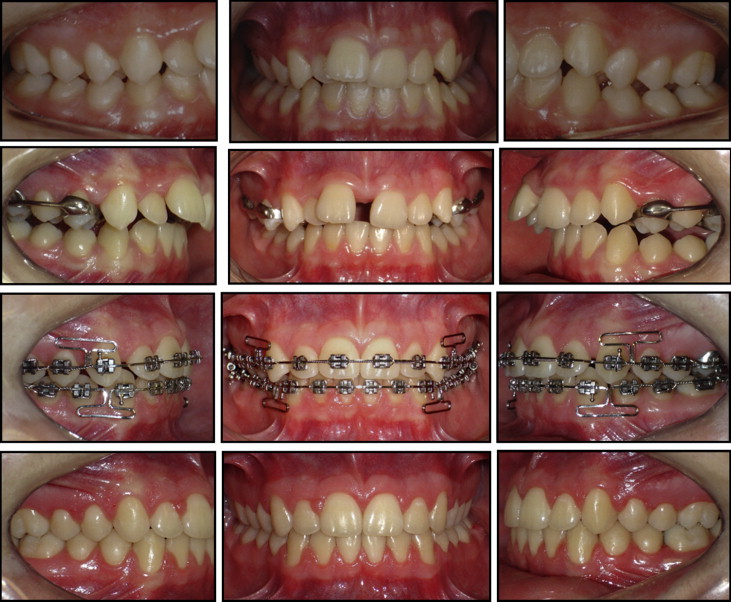
We obtained records from the patient database of the Department of Orthodontics of Pontifical Catholic University of Rio Grande do Sul in Brazil. These records included pretreatment and posttreatment CBCT scans and laser scans of poured-up casts of 1 patient. These casts were poured with orthodontic stone from alginate impressions. The patient was a 12-year-old boy with a skeletal and dental Class II malocclusion treated by an author (A.W.) with the Haas-type rapid palatal expander followed by combined headgear therapy and comprehensive orthodontic treatment with standard edgewise (0.022-in slot) fixed appliances ( Fig 1 ). The patient’s CBCT scans were available from the data sets obtained for clinical purposes with an i-CAT scanner (Imaging Sciences International, Hatfield, Pa) set at 120 kVp, 8 mA, a large field of view, and a scan time of 40 seconds. The images were reconstructed with 0.25-mm slice thickness and exported as DICOM files. The laser scans of the pretreatment and posttreatment poured-up casts were obtained using an XCAD scanner (São Paulo, SP, Brazil) and exported as stereolithography files.
The pretreatment and posttreatment DICOM files were imported into Mimics software (version 16.0; Materialise, Leuven, Belgium), and threshold segmentation was individually performed on each set of data, creating 3-dimensional (3D) virtual surface models of the teeth ( Fig 2 , A ). The same process was used on both sets of data. An initial threshold of 2224 to 4095 gray levels was applied to the DICOM data and was manually adjusted until all teeth were accurately captured while also minimizing the amount of surrounding bone to individually segment the teeth. Various functions within Mimics were applied, including region growing, cropping, and edit mask in 3 dimensions to isolate each tooth from the remaining bony structures. Wrapping and smoothing functions were also applied to optimize the 3D surface models of the CBCT teeth ( Fig 2 , B ). These teeth were individually imported into the software 3-matic (version 8.0; Materialise), which has the capability to perform superimpositions of the parts.
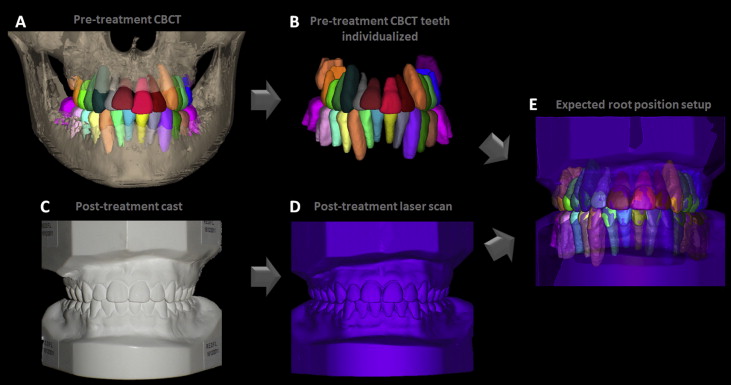
The “expected root position” (ERP) setup at posttreatment was created by superimposing the individually isolated tooth crowns ( Fig 2 , B ) from the initial CBCT scan ( Fig 2 , A ) onto the crowns of the posttreatment laser scan ( Fig 2 , D ) of the posttreatment cast ( Fig 2 , C ). The superimposition of the CBCT crowns carries the root information with it and forms the ERP setup, which depicts the expected root positions in 3 dimensions at posttreatment ( Fig 2 , E ). A color displacement map between the individually isolated tooth crowns obtained from the pretreatment CBCT teeth and the posttreatment laser scan was generated to validate the accuracy of the superimposition.
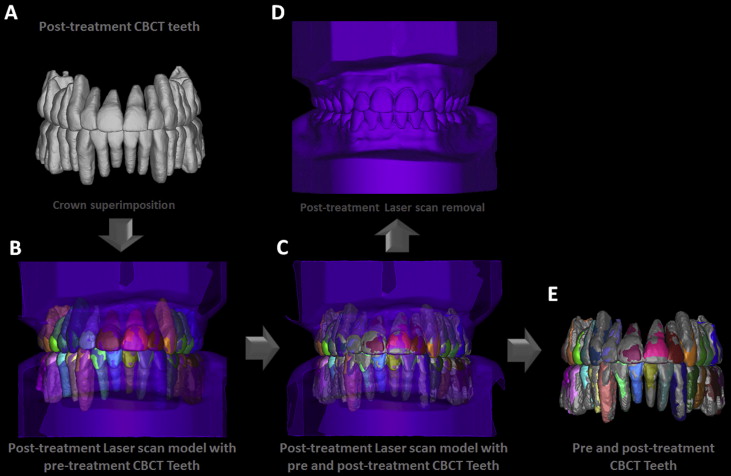
To validate the ERP setup, we performed the previously validated indirect superimposition process between the ERP setup and the posttreatment CBCT scan. This was accomplished by superimposing the crowns of the posttreatment CBCT teeth ( Fig 3 , A ) (that were not individually isolated) onto the crowns of the same posttreatment laser scan used to create the ERP setup ( Fig 3 , B ). A color displacement map of the superimposed posttreatment CBCT teeth and the posttreatment laser scan was generated to validate the accuracy of the alginate impression and the laser scan. At this point, the crowns of the posttreatment CBCT teeth and the ERP setup should be in the same position in 3 dimensions ( Fig 3 , C ). After removing the posttreatment laser scan ( Fig 3 , D ), the ERP setup and the true positions of the roots depicted by the posttreatment CBCT scan were indirectly superimposed with each other ( Fig 3 , E ).
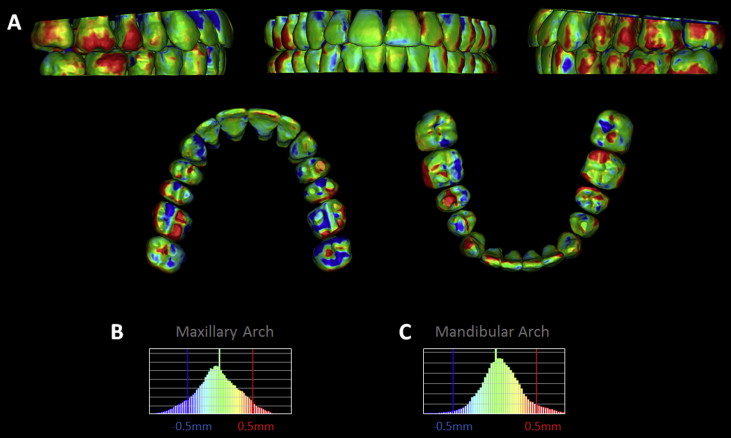
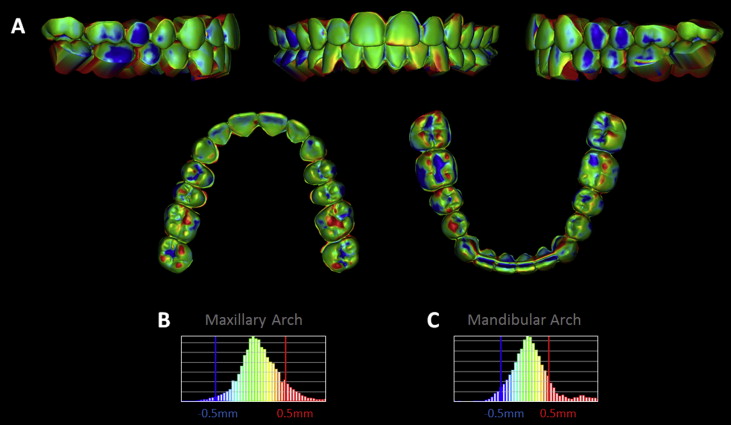
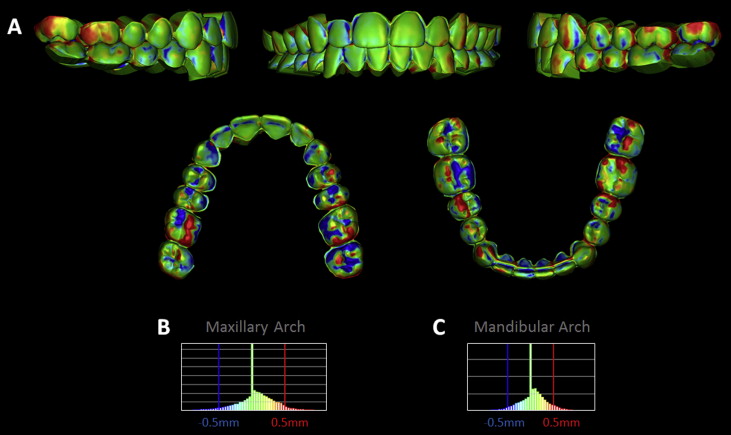
The ERP and the posttreatment CBCT setups were cut roughly at the cementoenamel junction, isolating the roots and crowns from each other. The closest point surface displacements between thousands of surface triangles in the 3D surface models were measured, and color displacement maps were generated to allow quantification of the registration errors in 2 scenarios: (1) the ERP and the posttreatment CBCT crowns, and (2) the ERP and the posttreatment CBCT roots. All color maps were generated with the same parameters. The histogram of the color mapping showed a whole spectrum of color ranging from blue, indicating displacement of 0.5 mm or more, to red, indicating outward displacement of 0.5 mm or more, with most of the areas in green at and around 0.0 mm of displacement.
Results
After direct superimposition between the pretreatment CBCT crowns and the posttreatment laser scan crowns, color maps were generated to verify accurate superimpositions. The color maps showed a maxillary displacement of 0.140 ± 0.314 mm with a maximum of 1.018 mm, and a mandibular displacement of 0.115 ± 0.448 mm with a maximum of 1.210 mm ( Fig 4 , Table ).
| Analysis type | Mean displacement (mm) | SD (mm) | Minimum displacement (mm) | Maximum displacement (mm) |
|---|---|---|---|---|
| Pretreatment CBCT crowns vs posttreatment laser scan crowns | ||||
| Maxillary crowns | 0.140 | 0.314 | 0.000 | 1.018 |
| Mandibular crowns | 0.115 | 0.448 | 0.000 | 1.210 |
| Posttreatment CBCT crowns vs posttreatment laser scan crowns | ||||
| Maxillary crowns | 0.048 | 0.317 | 0.000 | 1.453 |
| Mandibular crowns | 0.050 | 0.306 | 0.000 | 1.537 |
| ERP crowns vs posttreatment CBCT crowns | ||||
| Maxillary crowns | 0.048 | 0.339 | 0.000 | 1.474 |
| Mandibular crowns | 0.084 | 0.274 | 0.000 | 1.404 |
| ERP roots vs posttreatment CBCT roots | ||||
| Maxillary roots | 0.148 | 0.411 | 0.000 | 2.155 |
| Mandibular roots | 0.065 | 0.364 | 0.000 | 1.978 |
Direct superimposition between the posttreatment CBCT crowns and the posttreatment laser scan crowns was also verified to be accurate through the color maps. The color maps showed maxillary displacement of 0.048 ± 0.317 mm with a maximum of 1.453 mm, and a mandibular displacement of 0.050 ± 0.306 mm with a maximum of 1.537 mm ( Fig 5 , Table ).
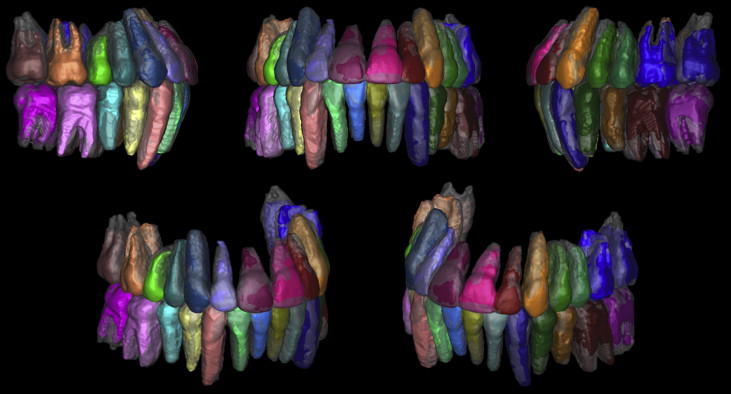
After indirect superimposition, the ERP setup was qualitatively compared with the posttreatment CBCT setup through different viewpoints and by making the posttreatment CBCT virtual model semitransparent ( Fig 6 ). Whereas the crowns of the 2 setups were held at best fit, qualitatively, the root positions depicted by the ERP setup showed minimal differences to the true root positions represented by the posttreatment CBCT roots.
Color mapping from indirect superimposition of the ERP setup crowns with the posttreatment CBCT crowns through laser scanned crowns showed a maxillary displacement of 0.048 ± 0.339 mm with a maximum of 1.474 mm, and a mandibular displacement of 0.084 ± 0.274 mm with a maximum of 1.404 mm ( Fig 7 , Table ). Color mapping of the roots showed a maxillary displacement of 0.148 ± 0.411 mm with a maximum of 2.155 mm, and a mandibular displacement of 0.065 ± 0.364 mm with a maximum of 1.978 mm ( Fig 8 , Table ).