Introduction
The aim of this prospective longitudinal study was to evaluate transverse skeletal changes after surgically assisted rapid maxillary expansion. The changes were registered by using a 3-dimensional computerized tomography technique based on superimposition on the anterior base of the skull.
Methods
The subjects comprised 35 patients (mean age, 19.7 years; range, 16.1-43.9 years). Low-dose, helical computerized tomography images were taken at treatment start and after orthodontic treatment. The 3-dimensional models were registered and superimposed at the anterior cranial base.
Results
Surgically assisted rapid maxillary expansion had a significant transverse skeletal treatment effect, significantly greater posteriorly than anteriorly. The expansion was parallel anteriorly, but posteriorly there was significant transverse tipping. Although there was no statistically significant difference between the changes at the corresponding landmarks, the range of standard deviations was marked.
Conclusions
The results showed that, for registering transverse skeletal changes after surgically assisted rapid maxillary expansion, 3-dimensional superimposition is a reliable method, circumventing projection and measurement errors. Surgically assisted rapid maxillary expansion had a significant but nonuniform skeletal treatment effect. Despite careful surgical separation, pronounced posterior tipping occurred. No correlation was found between the severity of tipping and the patient’s age.
Surgically assisted rapid maxillary expansion is used primarily to correct maxillary transverse hypoplasia in skeletally mature patients and has been an accepted modality in orthodontic therapy for many years. In principle, the indication is the same as for orthopedic rapid maxillary expansion: malocclusion associated with a narrow maxilla. Although the advantages of surgically assisted rapid maxillary expansion are well documented, there is lack of consensus with respect to skeletal efficiency and stability.
The skeletal and dental effects of surgically assisted rapid maxillary expansion have been evaluated in a number of clinical and radiographic studies. In an implant study of orthopedic rapid maxillary expansion in growing patients in 1958, Krebs reported different effects in various zones of the maxilla: dental expansion was greater than skeletal expansion and more pronounced anteriorly than posteriorly. Furthermore, there was more expansion in the alveolar process than in the maxillary base. These findings were eventually accepted as state of the art.
However, Krebs’s results should be extrapolated with caution. Many investigators have tried to verify his conclusions, but their findings have been inconclusive.
Both orthodontic and surgical procedures used for surgically assisted rapid maxillary expansion can vary, and the different treatment approaches can affect the treatment outcome. There is lack of consensus among clinicians with respect to achieving a balance between extensive surgery for mobilization and a more conservative procedure, with less risk of complications.
In most studies, the results are based on evidence from conventional 2-dimensional cephalometrics, lateral or frontal. Such methods are limited and open to criticism: 2-dimensional cephalometric analysis of a 3-dimensional (3D) structure is subject to errors in projection, landmark identification, and measurements.
In recent years, there have been major advances in computerized tomography and imaging techniques; it is now possible to achieve more precise and accurate data. Rapid, exact axial acquisition offers great potential for sophisticated image analysis. As early as 1982, Timms et al used computerized tomography to analyze treatment outcomes after rapid maxillary expansion in growing patients but concluded that, in addition to the disadvantage of a high dose of radiation, it was difficult to produce valid superimpositions for evaluation. Podesser et al investigated the reproducibility of maxillary structures using computerized tomography and concluded that the patient’s position in the scanner was a crucial factor for projection and measurement errors.
To facilitate and standardize the orientation of the 3D images, various landmarks have been proposed. However, the potential errors associated with such landmarks and coordinate systems are not acceptable for superimposition and treatment analysis.
Thus, for reliable, quantitative 3D assessment of skeletal changes after surgically assisted rapid maxillary expansion, it is essential to use a superimposition technique that does not depend on landmarks or planes.
The purpose of this study was to evaluate the transverse treatment effects of surgically assisted rapid maxillary expansion, by using a 3D imaging technique and registration based on superimposition on the anterior cranial base.
Material and methods
The subjects were skeletally mature patients scheduled to undergo surgically assisted rapid maxillary expansion for treatment of a skeletal maxillary transverse discrepancy exceeding 5 mm ( Fig 1 ). According to a power calculation, a priori, the minimum sample size was set at 34 patients, with α = 0.05 and power of 80%. Before treatment, all patients were informed of the voluntary basis of their participation in the study. To prevent a sample size not in accordance with the power calculation size, 40 consecutive patients were recruited from the Department of Orthodontics at the Institute for Postgraduate Dental Education, Jönköping, Sweden, and the Department of Dentofacial Orthopaedics, Maxillofacial Unit, University Hospital, Linköping, Sweden. Three patients declined to participate in the study but finished the treatment, and 2 patients had to be excluded because their computerized tomography records were incomplete. The sample thus comprised 35 patients (14 male, 21 female). The mean age at treatment start was 19.7 years (range, 16.1-43.9 years).
Registrations were made a week before surgery in connection with the presurgical examination and at the end of the orthodontic treatment, at a mean of 18 months postoperatively. The distribution of posttreatment registrations was not analyzed in detail but was less than 1 month.
The study was approved by the Research Ethics Committee, Faculty of Health Sciences, Linköping University, Linköping, Sweden (reference, M746-04).
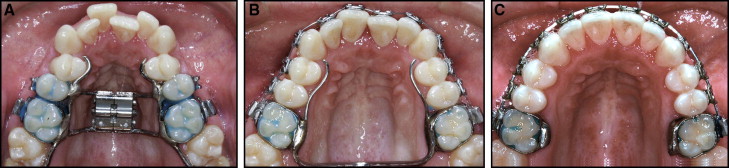
The orthodontic phase of treatment was undertaken at local orthodontic clinics under the supervision of the orthodontic departments in Jönköping and Linköping. The maxillary expansion appliance comprised a tooth-borne device activated by means of a conventional hyrax expander (Hyrax II; Dentaurum, Ispringen, Germany) with a soldered framework and orthodontic bands ( Fig 1 , A ). The appliance was scheduled for insertion as close as possible to the date of surgery. The amount of expansion was calculated for each patient, including a general bilateral overexpansion of half a cusp width. The patients were instructed to activate the jackscrew by 1 turn (0.25 mm) twice a day after a postoperative latency period of 5 days. Postoperative control was scheduled at 12 days postsurgery and included an occlusal radiograph to ensure a clinically symmetrical opening of the midpalatal suture and a medial diastema. At that time, the amount of additional expansion was measured.
After a mean active expansion period of 15 days (range, 11-17 days), with overexpansion of half a cusp, the appliance was used as a passive retainer for 90 days. At that time, the hyrax expander was replaced by a modified transpalatal arch ( Fig 1 , B ), and fixed appliance treatment began.
On completion of the active treatment phase, the transpalatal arch was removed, and fixed appliance treatment continued with stiff rectangular archwires to adjust the transverse width and to control and correct the buccal root torque of the molars. All transverse discrepancies were corrected by the end of treatment, at a mean of 18 months postoperatively, and the orthodontic treatment period then concluded. At this point, 26 patients were referred for the second stage of orthognathic surgery ( Fig 1 , C ). In the remaining 9 patients, the fixed appliance was debonded, and a Hawley plate was provided as a retainer.
Surgical treatment followed a technique similar to that described by Glassman et al and was undertaken by 2 experienced senior oral and maxillofacial surgeons (P.N. and another) at the Department of Oral and Maxillofacial Surgery, Institute for Postgraduate Dental Education, Jönköping, Sweden, and the Department of Dentofacial Orthopaedics, Maxillofacial Unit, University Hospital, Linköping, Sweden.
The surgery was carried out under general anesthesia and nasotracheal intubation. The mucoperiosteal incision in the maxillary vestibule extended from the right to the left second premolars. The osteotomies were performed on the maxillary lateral walls, from the piriform aperture to the pterygoid plates. The pterygomaxillary sutures were kept intact. The linings of the floor and the lateral walls of the nasal passage were reflected. A vertical osteotomy at the anterior nasal spine and the median palatal suture was carried out to ensure separation of the maxillary halves. The hyrax expander was activated by 12 turns (3 mm) to verify the success of the osteotomy and to ensure a visible symmetrical separation, and then deactivated by the same amount.
Depending on their physical condition and postoperative swelling, the patients were discharged from the hospital on the same day or the day after surgery.
All patients had computerized tomography imaging a week before treatment started and at the end of the active treatment phase in the maxilla, at a mean of 18 months postoperatively. The examinations were done at the Center for Medical Image Science and Visualization, University Hospital, Linköping, Sweden, and at the Department of Radiology, Ryhov County Hospital, Jönköping, Sweden.
A helical computerized tomography machine (Somatome Sensation 64 CT scanner; Siemens Medical Solutions, Erlangen, Germany) with a low-dose protocol (CARE dose 4D, Siemens Medical Solutions) was used at 120 kV and 55 mAs. The rotation time was 1 second, and the pitch factor was 0.9 with a collimation of 0.6 mm. The increment was 0.3 mm. The isotopic resolution/voxel size was 0.33 mm, according to the manufacturer. Spiral scanning is a continuous volume image process. Each acquisition provides a complete volume data set and does not require additional radiation to obtain overlapping slices. The patient’s head was positioned with the Frankfort plane vertical. The scanned area comprised the anterior cranial base to the mandibular base. After examination, the images were processed at a radiologic workstation (Sectra Imtec AB, Linköping, Sweden) with slice thickness of 0.75 mm and slice increment of 0.3 mm in Kernel H 60s sharp FR (high-resolution kernel suitable for this investigation), to allow further segmentation and registration.
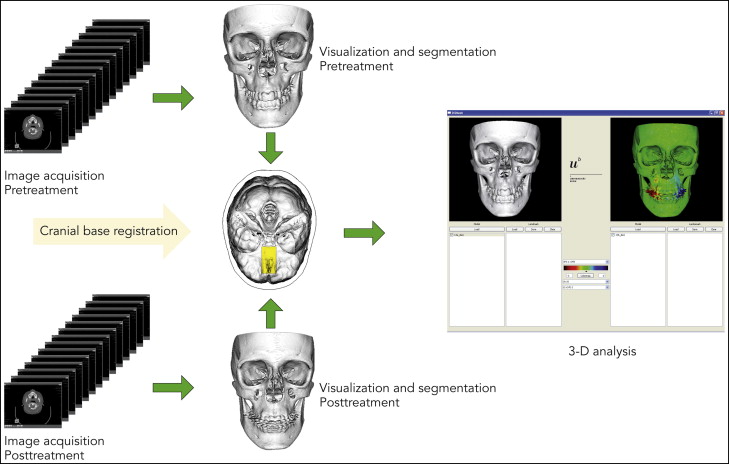
To visualize and measure the bony changes induced by surgically assisted rapid maxillary expansion, the data were processed by using a modified version of the technique described by Cevidanes et al. This process involves image segmentation, registration, and visualization ( Fig 2 ).
Segmentation is the process of outlining the shape of a structure, in this case the skeletal outer surface. The segmentation was performed semiautomatically in Amira (Mercury Computer System, Berlin, Germany) by an author (H.K.). In the semiautomatic segmentation technique, the region of interest is outlined with mouse clicks in the cross-sections of a data set, and algorithms (simple thresholding and region growing) are applied, so that the path that best fits the edge of the image is shown. In this study, the semiautomatic tools in Amira were effectively used to accelerate the segmentation process.
The image registration and superimposition of the preoperative and postoperative 3D models were done with a volumetric registration method, specifically normalized mutual information, based on the anterior cranial base. The cranial fossae and the ethmoid bone surfaces are regarded as stable areas, with growth completed before puberty. Once the preoperative and postoperative volumes are registered, they share the same coordinate system, which compensates for any discrepancies between these volumes and diminishes the risks of projection and measurement errors.
A landmark-based, nonrigid mapping technique, thin plate spline, was used to determine the corresponding skeletal points between the presurgery and postsurgery 3D models. This was done by a pipeline procedure according to the method of Kim et al.
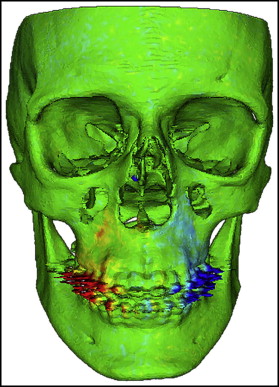
Di2Mesh software (University of Bern Institute for Surgical Technology & Biomechanics, Bern, Switzerland) is a graphical user interface-based application allowing the user to compute surface-to-surface distances in specified directions and visualize them with a color map. In this study, the color map scheme was applied to show the transverse displacements. The transverse outward displacement was indicated in red on the right side of the maxilla and in blue on the left side. The absence of displacement was indicated in green ( Fig 3 ).
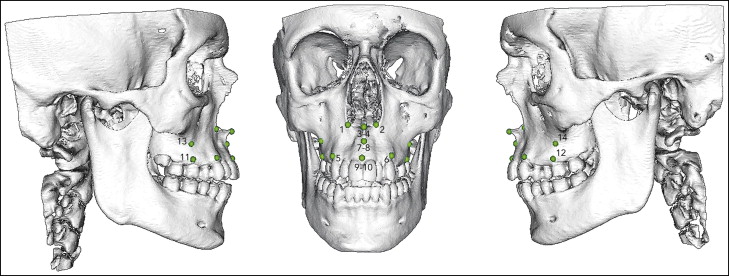
Seven validated pairs of bony landmarks according to the study Moore-Jansen et al were selected for measurements and to show the displacements in the maxilla from both the sagittal and coronal aspects ( Fig 4 ). Of these 7 pairs, alare, ectocanine, processus zygomaticus, and ectomolare were real homologous and corresponding landmarks, whereas spina nasalis anterior, A-point, and prosthion were constructed in pairs of left and right to enable transverse measurement in the anterior midline of the maxilla.
The nonrigid transformation model, thin plate spline deformation, and closest point matching were used to show displacements. The landmarks were identified and digitized by an author (A.M.), and the software (Di2Mesh) computerized the closest-point relationship between the presurgical and postsurgical landmarks in a 3D Euclidean space coordinate system. Only transverse displacements of the landmarks were measured.
Fifteen computerized tomography studies were randomly selected. The anatomic landmarks were located and digitized in each 3D model. The same observer (A.M.) repeated the procedure 4 weeks later, and the displacements of the landmarks were calculated. The error of the measurements was calculated by intraclass correlation coefficients (ICCs) for single measurements, which is an expression of intraobserver reliability. An ICC above 0.75 indicates excellent reliability. The ICC values were between 0.810 and 0.971 for all landmarks with the exception of alare (ICC, 0.701).
Statistical analysis
Statistical analyses were undertaken by using the Statistical Package for the Social Sciences III (version 15.0; SPSS, Chicago, Ill). The distribution of data was tested with the 1-sample Kolmogorov-Smirnov test. The results showed normal distribution of the data, but the sample size and some skewness of the data could also justify nonparametric tests. Median values and percentiles were used to describe the changes and distributions. The Wilcoxon signed rank nonparametric test was used to evaluate pretreatment and posttreatment differences. The level of significance was set at P <0.05. The Spearman rho was applied to assess the correlation between the skeletal changes in the maxilla.
Results
Transverse maxillary displacement, expressed as the difference between the preexpansion and postexpansion registrations, confirmed the significant active skeletal treatment effects in all landmarks measured, except for the right anterior spina nasalis. There were pronounced variations in the distribution. The median, probability, percentiles, and minimum and maximum values for the transverse displacement in each landmark are shown in Table I . There was no significant difference in displacement between corresponding landmarks on the left and right sides, except for spina nasalis anterior, which showed significantly more outward or transverse displacement on the left side. There were no significant differences related to sex or age in displacement.
| Landmark | Median displacement (mm) | Wilcoxon test | P 10 | P 90 | Minimum | Maximum |
|---|---|---|---|---|---|---|
| Alare, right (1) | 1.29 | ∗ | 0.16 | 2.20 | −0.52 | 3.24 |
| Alare, left (2) | 1.23 | ∗ | −0.32 | 2.62 | −0.69 | 3.28 |
| Spina nasalis, right (3) | 0.86 | NS | −0.92 | 2.48 | −2.17 | 2.99 |
| Spina nasalis, left (4) | 1.49 | ∗ | −0.30 | 2.64 | −2.04 | 4.89 |
| Ectocanine, right (5) | 1.71 | † | 0.20 | 2.98 | −0.06 | 3.86 |
| Ectocanine, left (6) | 1.73 | † | 0.21 | 2.38 | −0.79 | 4.93 |
| A-point, right (7) | 2.34 | † | 1.41 | 3.15 | −0.88 | 4.81 |
| A-point, left (8) | 1.95 | † | 0.92 | 3.18 | −1.44 | 5.85 |
| Prosthion, right (9) | 1.79 | † | 0.59 | 2.77 | −0.48 | 3.91 |
| Prosthion, left (10) | 1.51 | † | 0.25 | 3.16 | −0.50 | 3.53 |
| Ectomolare, right (11) | 2.37 | ‡ | 0.85 | 3.83 | 0.15 | 5.04 |
| Ectomolare, left (12) | 2.04 | ‡ | 0.76 | 4.17 | 0.00 | 4.95 |
| Processus zygomaticus, right (13) | 1.57 | ∗ | 0.00 | 2.74 | −0.25 | 3.82 |
| Processus zygomaticus, left (14) | 1.23 | ∗ | 0.08 | 2.66 | −0.37 | 3.57 |
Stay updated, free dental videos. Join our Telegram channel
VIDEdental - Online dental courses


