Introduction
The aims of this study were to determine the accuracy of volumetric measurements of teeth in vitro by cone-beam computed tomography (CBCT) and to analyze the factors affecting their volume measurements from the CBCT data.
Methods
We used a sample of CBCT-scanned (voxel sizes: 0.125, 0.20, 0.25, 0.30, and 0.40 mm) and laser-scanned crowns (n = 40) and roots (n = 32). The Tukey test was used to assess the differences between the CBCT-scan and the laser-scan volumes.
Results
There was a statistically significant difference between the laser-scan crown volume and each voxel size of CBCT-scan crown volume ( P <0.05). CBCT-scan crown volumes at 0.30 and 0.40 mm were statistically significantly distinct from those at 0.125, 0.20, and 0.25 mm ( P <0.05). There was a statistically significant difference between the laser-scan root volume and each voxel size of CBCT-scan root volume ( P <0.05). The laser-scan root volume at 0.40 mm was statistically significantly distinct from the volumes at 0.125 and 0.20 mm ( P <0.05). The in-vitro volume measurements from the CBCT scans were larger than those of the laser scans: from 21.73% to 43.92% in the crown halves, and from 18.27% to 41.58% in the root halves at the different voxel sizes.
Conclusions
With increasing voxel sizes during scanning, the volume measurements of teeth tended to be larger. The surface surrounding artifacts might lead to larger volumes.
In recent years, cone-beam computed tomography (CBCT) has been widely used in orthodontics. Applications of CBCT 3-dimensional (3D) imaging in orthodontics include dental measurements, diagnostics of the temporomandibular joint, 3D cephalometry, evaluation of root resorption after tooth movement, airway assessment, periodontal bone level assessment before orthodontic treatment, presurgical assessment of the jaw, and predicting the diameter of the unerupted tooth. Moreover, CBCT imaging can be imported as digital imaging and communications in medicine (DICOM) format files into third-party software for the reconstruction of 3D surface models of the craniofacial skeleton, soft tissues, and teeth. These 3D surface models can also be imported as standard tessellation language (STL) format files into computer-aided design software as guides for implant and miniscrew designs, bracket designs and positioning, orthognathic surgery simulation, and the creation of physical models with rapid prototyping technology.
Several previous studies have focused on the accuracy of volume measurements of teeth from CBCT data. Maret et al used a sample of CBCT and microcomputed tomography data from tooth germs and found that the accuracy of the CBCT method for volume measurements of teeth was similar to that of the microcomputed tomography method; Wang et al reached the same conclusion. But Liu et al found that the CBCT volume measurements deviated slightly from the physical volumes by –4% to 7%. In these studies, the tooth volumes could have been affected by the segmentation from the jaw and the Hounsfield unit threshold value setting during segregation, which might be different for different observers. In addition, voxel sizes, tube voltages, and fields of view from the same CBCT device could also affect tooth volumes.
Hence, our first aim in this study was to compare the accuracy of CBCT-scan volume measurements with that of laser-scan volume measurements of crown and root halves separately in vitro. The second aim was to analyze the factors affecting volume measurements of teeth from CBCT data.
Material and methods
For this study, we collected 52 premolars extracted from 22 orthodontic patients and removed the soft tissue, residual bone, and calculus from all teeth. The teeth were cut at the cervical level and divided into crown halves and root halves before scanning. Our study included 40 crown halves (excluding teeth with dental caries and enamel hypoplasia) and 32 root halves (excluding undeveloped roots, double roots, and root fractures). Because laser scanning is a surface scan, to facilitate laser scanning we filled the pulp cavities of the 40 crown halves and 32 root halves with plaster to form a closed entity of each half. All teeth were obtained after informed consent was received from each donor according to the institutional review board protocol of Sichuan University, Chengdu, China.
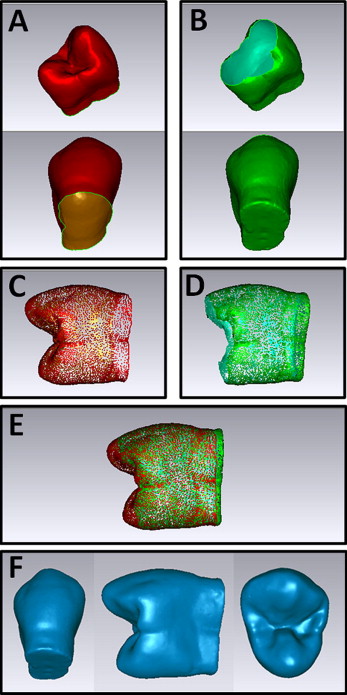
The samples were coated with Arti-Spray BK-285 powder (Dr Jean Bausch, Köln, Germany) to facilitate laser scanning. The laser scan was performed with 3D laser scanning equipment (3Shape, Copenhagen, Denmark), which can obtain surface models in the form of a “point cloud” format with accuracy of 20 μm and is often used in the laboratory for plaster model scanning. According to the method of reverse engineering, the top and bottom parts of the teeth (crown halves and root halves) were scanned separately and then merged with Geomagic Studio software (version 10; Geomagic International, Research Triangle Park, NC), which can automatically stitch the overlap points (about 10,000 points) of 2 models. The same operator (N.Y.) performed this process on all samples ( Fig 1 ). After both parts were stitched, the laser scan model can also be exported as STL format files. In this study, the laser-scanned models were regarded as the reference and are referred to as the laser-scan crown and the laser-scan root groups.
Wax and a cup of water were scanned with a 3D examination scanner (KaVo Dental, Biberach, Germany) to calibrate the Hounsfield unit threshold according to the manufacturer’s instructions. The means and standard deviations of the thresholds of water, air, and wax in Hounsfield units were calculated with eXamVisionQ software (KaVo Dental).
All teeth were fixed on the wax base and scanned with the 3D examination scanner system. The CBCT scan parameters are presented in Table I . After scanning, the CBCT data were exported as DICOM format files and imported into Mimics software (version 10.01; Materialise, Leuven, Belgium) for segmentation and 3D reconstruction. The segmentation thresholds in Hounsfield units ranged from 56 (water threshold) to 3071 (maximum) according to calibration, and the pulp cavities were filled by the “cavity fill” tool in the Mimics software to obtain the intact tooth volume. The segmentation process was performed twice by the same operator (N.Y.), at least a week apart. The voxel sizes of 0.125, 0.20, 0.25, 0.30, and 0.40 mm of the CBCT crown and root models were referred to as the CBCT-scan crown group and the CBCT-scan root group in this study.
| Group | Voxel size (mm) | FOV (mm 2 ) | Scan time (sec) | Tube current (mA) | Tube voltage (kV) |
|---|---|---|---|---|---|
| CS 0.125 | 0.125 | 85 × 85 | 23 | 5 | 120 |
| CS 0.20 | 0.20 | 85 × 85 | 23 | 5 | 120 |
| CS 0.25 | 0.25 | 85 × 85 | 23 | 5 | 120 |
| CS 0.30 | 0.30 | 85 × 85 | 8.9 | 5 | 120 |
| CS 0.40 | 0.40 | 85 × 85 | 8.9 | 5 | 120 |
The laser-scan model was imported into the Mimics software for volume measurement, and the CBCT-scan model could be directly measured in the software after the 3D reconstruction. All measurements were made twice by the same operator (N.Y.), at least a week apart.
Statistical analysis
A standard statistical software package (version 12; SPSS, Chicago, Ill) was used for data analysis. An intraclass correlation coefficient was then calculated to determine the level of intraobserver reliability. The volume measurements of the crown and root halves of the different voxel sizes from the CBCT and the laser scans were compared separately with the Tukey test (in case of homogeneity of variance) (α = 0.05).
Results
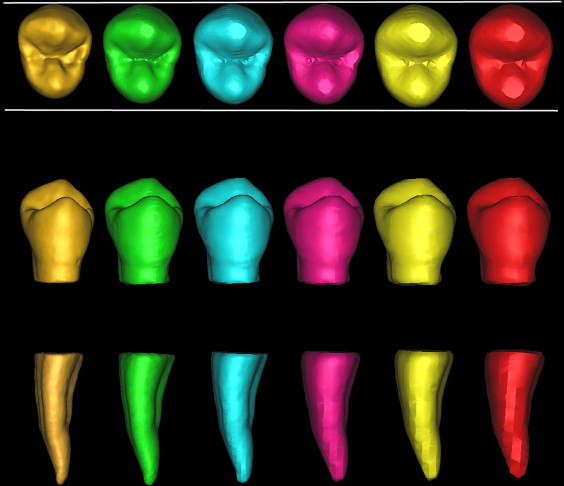
The intraobserver reproducibility was high (intraclass correlation coefficient = 1). The means and standard deviations of the Hounsfield unit thresholds of water, air, and wax were 56.0 ± 10.6, –990.0 ± 14.3, and –280.0 ± 38.8, respectively. The means and standard deviations of the volume measurements of laser-scan and CBCT-scan crown halves are presented in Table II . The means and standard deviations of the volume measurements of the laser-scan and CBCT-scan root halves are presented in Table III . The measurements of CBCT-scanned crown volumes deviated from those of laser-scanned crown volumes by 21.73% to 43.92% with the different voxels. The measurements of the CBCT-scanned root volumes deviated from those of the laser-scanned root volumes by 18.27% to 41.58% with the different voxels. The laser-scanned and CBCT-scanned crown and root measurements at each voxel are presented in Figure 2 .
| Laser scan | CBCT scan | |||||
|---|---|---|---|---|---|---|
| LSC | CSC 0.125 | CSC 0.20 | CSC 0.25 | CSC 0.30 | CSC 0.40 | |
| Mean ± SD (mm 3 ) | 327.82 ± 46.20 | 399.06 ± 54.06 ∗ | 410.46 ± 55.40 ∗ | 418.01 ± 56.16 ∗ | 458.15 ± 60.57 ∗ , † | 471.81 ± 61.70 ∗ , † |
| Volume difference | +21.73% | +25.21% | +27.51% | +39.76% | +43.92% | |
| Laser scan | CBCT scan | |||||
|---|---|---|---|---|---|---|
| LSR | CSR 0.125 | CSR 0.20 | CSR 0.25 | CSR 0.30 | CSR 0.40 | |
| Mean ± SD (mm 3 ) | 174.41 ± 35.85 | 206.28 ± 41.08 ∗ | 212.75 ± 42.26 ∗ | 216.83 ± 42.70 ∗ | 235.13 ± 46.19 ∗ | 246.94 ± 53.27 ∗ , † |
| Volume difference | +18.27% | +21.98% | +24.32% | +34.82% | +41.58% | |
Results
The intraobserver reproducibility was high (intraclass correlation coefficient = 1). The means and standard deviations of the Hounsfield unit thresholds of water, air, and wax were 56.0 ± 10.6, –990.0 ± 14.3, and –280.0 ± 38.8, respectively. The means and standard deviations of the volume measurements of laser-scan and CBCT-scan crown halves are presented in Table II . The means and standard deviations of the volume measurements of the laser-scan and CBCT-scan root halves are presented in Table III . The measurements of CBCT-scanned crown volumes deviated from those of laser-scanned crown volumes by 21.73% to 43.92% with the different voxels. The measurements of the CBCT-scanned root volumes deviated from those of the laser-scanned root volumes by 18.27% to 41.58% with the different voxels. The laser-scanned and CBCT-scanned crown and root measurements at each voxel are presented in Figure 2 .
| Laser scan | CBCT scan | |||||
|---|---|---|---|---|---|---|
| LSC | CSC 0.125 | CSC 0.20 | CSC 0.25 | CSC 0.30 | CSC 0.40 | |
| Mean ± SD (mm 3 ) | 327.82 ± 46.20 | 399.06 ± 54.06 ∗ | 410.46 ± 55.40 ∗ | 418.01 ± 56.16 ∗ | 458.15 ± 60.57 ∗ , † | 471.81 ± 61.70 ∗ , † |
| Volume difference | +21.73% | +25.21% | +27.51% | +39.76% | +43.92% | |
Stay updated, free dental videos. Join our Telegram channel
VIDEdental - Online dental courses


