Introduction
Conventional treatment for young Class III patients involves extraoral devices designed to either protract the maxilla or restrain mandibular growth. The use of skeletal anchorage offers a promising alternative to obtain orthopedic results with fewer dental compensations. Our aim was to evaluate 3-dimensional changes in the mandibles and the glenoid fossae of Class III patients treated with bone-anchored maxillary protraction.
Methods
Twenty-five consecutive skeletal Class III patients between the ages of 9 and 13 years (mean age, 11.10 ± 1.1 year) were treated with Class III intermaxillary elastics and bilateral miniplates (2 in the infrazygomatic crests of the maxilla and 2 in the anterior mandible). The patients had cone-beam computed tomography images taken before initial loading and at the end of active treatment. Three-dimensional models were generated from these images, registered on the anterior cranial base, and analyzed by using color maps.
Results
Posterior displacement of the mandible at the end of treatment was observed in all subjects (posterior ramus: mean, 2.74 ± 1.36 mm; condyles: mean, 2.07 ± 1.16 mm; chin: mean, −0.13 ± 2.89 mm). Remodeling of the glenoid fossa at the anterior eminence (mean, 1.38 ± 1.03 mm) and bone resorption at the posterior wall (mean, −1.34 ± 0.6 mm) were observed in most patients.
Conclusions
This new treatment approach offers a promising alternative to restrain mandibular growth for Class III patients with a component of mandibular prognathism or to compensate for maxillary deficiency in patients with hypoplasia of the midface. Future studies with long-term follow-up and comparisons with facemask and chincup therapies are needed to better understand the treatment effects.
Class III malocclusion is most commonly associated with hypoplasia of maxillary growth. However, hyperplasia of the mandible also can result in a mesiocclusion. Even when maxillary deficiency is the main etiology of the Class III malocclusion, a mandibular retraction effect can aid in the correction of the maxillomandibular discrepancy.
Whereas extraoral traction with a facemask applies anteriorly directed forces to the maxilla to mechanically disrupt the sutures and to stimulate maxillary forward growth, reaction forces tend to push the chin posteriorly. These reaction forces result in clockwise rotation of the mandible and increased vertical dimensions and are also observed in chincup therapy. Little is known about eventual modifications in the temporomandibular joint with facemask therapy. Modeling of the glenoid fossa has been reported in magnetic resonance imaging studies with the Herbst appliance and in histologic studies on rhesus monkeys treated with chincup therapy. However, there are no reported human studies of modeling of the glenoid fossa after Class III extraoral traction. Furthermore, 2-dimensional cephalometric analysis does not allow clear visualization of changes in the glenoid fossa or asymmetric effects on both sides.
In contrast to facemask therapy, bone-anchored maxillary protraction applies continuous anteriorly directed forces to the maxilla and continuous retraction forces to the mandible. Moreover, better compliance can be expected from patients for intraoral elastic traction rather than an extraoral device. Previous studies have evaluated the effects of this protocol on maxillary displacement and modeling by using superimpositions of cone-beam computed tomography (CBCT) images before and after orthopedic traction registered on the anterior cranial base. In this study, we focused on the mandibular and glenoid fossa changes in 3 dimensions after bone-supported continuous Class III intermaxillary traction.
Material and methods
The prospective sample consisted of 25 consecutively treated patients (13 girls, 12 boys) with a dentoskeletal Class III malocclusion. All patients were treated by 1 operator (H.D.C.) with the bone-anchored maxillary protraction technique. Institutional review board approval was obtained before the study.
At the initial observation (T1), all patients had a Class III malocclusion in the mixed or permanent dentition characterized by a Wits appraisal of −1 mm or less (mean, −4.8 ± 2.8 mm), an anterior crossbite or incisor end-to-end relationship, and a Class III molar relationship. The skeletal characteristics of this sample at T1 have been previously described in detail. All patients were of white ancestry, with a prepubertal stage of skeletal maturity according to the cervical vertebral maturation method (CS 1 to CS 3). Twenty-one of the 25 patients were still prepubertal at the end of treatment (T2) (CS 1 to CS 3), whereas 4 patients were at CS 4. The subjects’ mean ages were 11.9 ± 1.8 years at T1 and 13.1 ± 1.7 years at T2. The mean duration of the treatment was 1.2 ± 0.1 years.
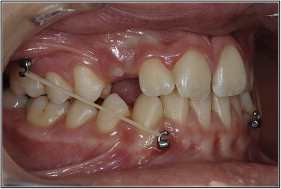
The bone-anchored maxillary protraction orthopedic protocol consisted of the following. Each patient had miniplates placed on the left and right infrazygomatic crests of the maxillary buttress and between the lower left and right lateral incisors and canines ( Fig 1 ). Small mucoperiosteal flaps were elevated, and modified miniplates (Tita-Link; Bollard, Brussels, Belgium) were secured to the bone by 2 screws in the mandible or 3 screws in the maxilla screw diameter, 2.3 mm; length, 5 mm). The extensions of the plates perforated the attached gingiva near the mucogingival junction. Three weeks after surgery, the miniplates were loaded. Class III elastics applied an initial force of 150 g on each side, and increased to 200 g after 1 month of traction and to 250 g after 3 months. The patients were asked to replace the elastics at least once a day and wear them 24 hours per day. In 14 patients, after 2 to 3 months of intermaxillary traction, a removable biteplate was inserted in the maxillary arch to eliminate occlusal interference in the incisor region until correction of the anterior crossbite was obtained.
The CBCT scans were taken at T1 and T2 with an iCat machine (Imaging Sciences International, Hatfield, Pa) with a 16 × 22-cm field of view. Virtual 3-dimensional surface models were constructed from the CBCT images with a voxel dimension of 0.5 × 0.5 × 0.5 mm. Construction of 3-dimensional surface models of the anatomic structures of interest and the 3-dimensional graphic renderings were done by using software (ITK-SNAP; open-source software, www.itksnap.org ).
The T1 and T2 images were registered by using the anterior cranial fossa as the reference. A fully automated voxel-wise rigid registration method was performed with software (IMAGINE, open-source software, http://www.ia.unc.edu/dev/download/imagine/index.htm ). This method, developed by Cevidanes et al, masks anatomic structures altered by treatment or growth to prevent observer-dependent reliance on subjectively defined anatomic landmarks. In this study, the 3-dimensional models at T1 and T2 were registered on anterior cranial fossa structures, specifically the endocranial surfaces of the cribriform plate region of the ethmoid bone and the frontal bone. These regions were chosen because of their early completion of growth. The software compares the images by using the intensity of the gray scale for each voxel of the 2 images.
After the registration step, all reoriented virtual models were superimposed to quantitatively evaluate the greatest surface displacement by using the CranioMaxilloFacial (CMF) application software (developed at the M. E. Müller Institute for Surgical Technology and Biomechanics, University of Bern, Bern, Switzerland, under the funding of the Computer Aided and Image Guided Medical Interventions network, http://co-me.ch ). The CMF tool calculates thousands of color-coded point-to-point comparisons (surface distances in millimeters) between the 3-dimensional models, so that the differences between 2 surfaces at any location can be quantified.
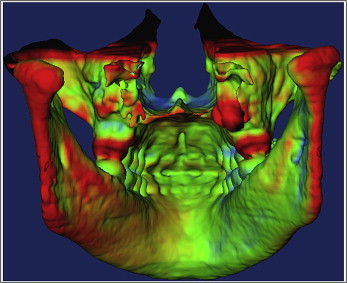
For quantitative assessment of the changes between the 3-dimensional surface models, the isoline tool allows the user to define a surface-distance value to be expressed as a contour line (isoline) that corresponds to regions having a surface distance equal to or greater than the defined value. The isoline tool was used to quantitatively measure the greatest displacements between points in the 3-dimensional surface models for the right and left anterior and posterior surfaces of the condyles, the right and left anterior and posterior surfaces of the glenoid fossae walls, the chin, the right and left posterior surfaces of the rami, and the soft-tissue chin ( Fig 2 ).
The greatest displacements between T1 and T2 were computed at each anatomic region of interest. The error of the method as determined in previous studies showed excellent reliability. Descriptive statistics was used to describe the percentiles, means, standard deviations, and ranges. Pearson correlation coefficients were used to assess the associations between changes at each anatomic region. The level of significance was set at 0.05.
Results
Table I summarizes the descriptive statistics for changes in the mandibular condyle, glenoid fossa, ramus, and chin observed from T1 to T2 for the 25 consecutive patients treated with bone-anchored maxillary protraction.
| Condyle | Glenoid fossa | Ramus | Chin | |||||||||
|---|---|---|---|---|---|---|---|---|---|---|---|---|
| R ant | L ant | R post | L post | R ant | L ant | R post | L post | R | L | Hard | Soft | |
| Mean | −2.21 | −2.28 | 2.03 | 2.12 | 1.30 | 1.47 | −1.39 | −1.30 | 2.73 | 2.76 | −0.13 | −0.03 |
| SD | 0.98 | 0.82 | 1.21 | 1.06 | 1.03 | 1.03 | 0.75 | 0.46 | 1.36 | 1.36 | 2.89 | 3.00 |
| Range (minimum and maximum) | −1.06 | −0.52 | 0.32 | 0.51 | −1.18 | −1.06 | 0.10 | −0.45 | 0.18 | 0.69 | −5.85 | −5.01 |
| −4.12 | −3.63 | 4.52 | 4.50 | 2.79 | 3.22 | −3.40 | −2.15 | 6.45 | 5.54 | 4.42 | 5.05 | |
Throughout a year of treatment, the chin on average maintained its relative anteroposterior position (mean change, −0.13 ± 2.89 mm). The range of response was highly variable, from 4.42 mm of anterior displacement to as much as −5.85 mm of posterior displacement. On average, distal displacement of the posterior ramus was observed (mean right ramus displacement, 2.73 ± 1.36 mm; mean left ramus displacement, 2.76 ± 1.36 mm) ( Fig 3 ). The condyles moved posteriorly (mean right condyle posterior surface changes, 2.03 ± 1.21 mm; mean left condyle posterior surface changes, 2.12 ± 1.06 mm). The posterior eminence of the glenoid fossae showed resorption of the posterior wall (mean right posterior wall changes, −1.39 ± 0.75 mm; mean left posterior wall changes, −1.30 ± 0.46 mm). There was apposition of bone at the anterior eminences of the fossae, with mean changes of 1.30 ± 1.03 mm and 1.47 ± 1.03 mm, respectively, at the right and left anterior articular eminences ( Fig 4 ). The soft-tissue chin (mean displacement, −0.03 ± 3.0 mm) showed similar positional changes compared with the hard-tissue chin (−0.13 ± 2.89 mm).
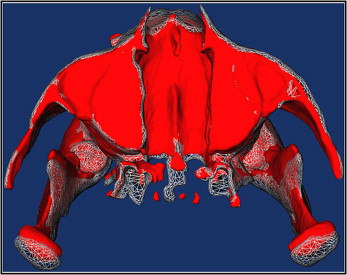
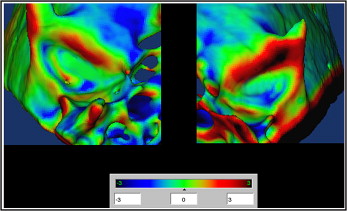
Table II shows the correlations between changes at the condyles, glenoid fossae, posterior surface of the rami, and hard- and soft-tissue chins. The amounts of displacement of the right condyle, glenoid fossa, and ramus were highly correlated to the displacements of the same anatomic regions on the left side. There also was a high correlation between the posterior displacement of the condyles and the amount of bone apposition at the anterior eminence and resorption at the posterior wall of the glenoid fossa. Poor or no correlation was found between the displacement of the posterior border of the ramus and the displacement of the condyles or glenoid fossa modeling. However, the anteroposterior displacement of the hard-tissue chin was correlated with the displacement of the posterior border of the ramus and strongly correlated with the displacement of the soft-tissue chin.
| Condyle | Glenoid fossa | Ramus | Chin | |||||||||
|---|---|---|---|---|---|---|---|---|---|---|---|---|
| R ant | L ant | R post | L post | R ant | L ant | R post | L post | R | L | Hard | Soft | |
| Condyle | ||||||||||||
| R ant | 0.75 ∥ | −0.81 ∥ | −0.62 ∥ | −0.66 ∥ | −0.55 ∥ | 0.60 ∥ | 0.48 ∥ | −0.65 ∥ | −0.43 ∥ | 0.32 | 0.11 | |
| L ant | § | −0.46 ∥ | −0.64 ∥ | −0.69 ∥ | −0.70 ∥ | 0.39 | 0.35 | −0.46 ∥ | −0.47 ∥ | 0.34 | 0.14 | |
| R post | § | ∗ | 0.76 ∥ | 0.43 ∥ | 0.40 ∥ | −0.62 ∥ | −0.66 ∥ | 0.53 ∥ | 0.29 | −0.13 | 0.07 | |
| L post | ‡ | ‡ | § | 0.49 ∥ | 0.52 ∥ | −0.33 | −0.49 ∥ | 0.37 | 0.38 | −0.11 | 0.11 | |
| Glenoid fossa | ||||||||||||
| R ant | ‡ | ‡ | ∗ | ∗ | 0.90 ∥ | −0.26 | −0.26 | 0.21 | 0.09 | 0.13 | 0.27 | |
| L ant | † | § | ∗ | † | § | −0.23 | −0.28 | 0.22 | 0.14 | 0.17 | 0.26 | |
| R post | † | NS | ‡ | NS | NS | NS | 0.68 ∥ | −0.61 ∥ | −0.44 ∥ | 0.09 | 0.01 | |
| L post | ∗ | NS | ‡ | ∗ | NS | NS | ‡ | −0.46 ∥ | −0.41 ∥ | 0.01 | −0.05 | |
| Ramus | ||||||||||||
| R | ‡ | ∗ | † | NS | NS | NS | † | ∗ | 0.81 ∥ | −0.54 | −0.65 ∥ | |
| L | ∗ | ∗ | NS | NS | NS | NS | ∗ | ∗ | § | −0.59 | −0.43 ∥ | |
| Chin | ||||||||||||
| Hard | NS | NS | NS | NS | NS | NS | NS | NS | † | † | 0.79 | |
| Soft | NS | NS | NS | NS | NS | NS | NS | NS | ∗ | § | § | |
Stay updated, free dental videos. Join our Telegram channel
VIDEdental - Online dental courses


