Introduction
The purpose of this study was to examine whether the pharyngeal airway volume in adults with skeletal Class III malocclusion is greater than in subjects with Class I occlusion and whether the pharyngeal airway volume correlated with facial morphology.
Methods
Cone-beam computed tomography scans were obtained from 60 subjects, who were assigned to 2 groups. The skeletal Class III malocclusion group consisted of 31 subjects (16 men, 15 women) who had planned on orthodontic treatment with orthognathic surgery. The Class I malocclusion group consisted of 29 subjects (14 men, 15 women). The pharyngeal airway volumes and areas were measured and compared with cephalometric variables.
Results
The cross-sectional areas of the lower part of the pharyngeal airway and the volume of the upper part of the pharyngeal airway were greater in skeletal Class III malocclusion patients than in Class I malocclusion patients. The volume of the upper part of the pharyngeal airway showed negative correlations with ANB angle and the Wits appraisal, and positive correlations with SNB, APDI, pogonion to N-perp, gonial angle, and FMA.
Conclusions
The volume of the upper part of the pharyngeal space was greater in patients with skeletal Class III malocclusion, and the increased volume of the upper part of the pharyngeal airway showed significant correlations with measurements characterizing the anterior position of mandible.
Researchers have shown that respiratory function influences craniofacial growth and occlusion. Impaired nasal respiratory function is associated with airway inadequacy, which can result in mouth breathing. This change in breathing pattern leads to lowering of the mandible and the tongue and an extended head posture. These postural changes are reflected in changes in craniofacial growth and anomalies of dental position.
Downward and backward rotations of the mandible have been observed in growing children with upper airway obstruction caused by enlarged adenoids, and the treatment of nasal obstruction in growing patients results in a more normal pattern of dentofacial development. In addition, compensatory facial-growth change was observed in children with a narrow airway, who showed more anterior growth of the mandible and the maxilla during the adolescent growth spurt than those who did not have an adenoidectomy.
A smaller nasopharyngeal area has been observed more often in patients with both Class II and Class III malocclusions than in those with Class I malocclusion. Because of the variations in the location and the degree of constriction of the airways, facial morphology can vary widely among subjects. However, previous studies of airway and facial growth have used 2-dimensional (2D) lateral cephalograms to measure the width and cross-sectional areas of the airway. Although lateral cephalograms offer valuable information for airway evaluation, there are limitations in 2D imaging because of the anatomic variations of the complex structure of the airway.
Recently, computed tomography (CT), as used in medicine, has provided 3-dimensional (3D) assessments of the complex anatomy of the craniofacial structures. CT imaging can be used to evaluate the volume and dimensions of the airway. Despite the advantages of high-quality medical CT with less magnification and distortion and a lack of projection errors, its application in orthodontics has been limited to special patients because of the high radiation dose and associated scanning costs. Cone-beam CT (CBCT), which is widely used in dentistry, has lower radiation and costs than medical CT and can be used for orthodontic diagnosis and treatment planning. CBCT images provide reconstructed 3D models by using computer software and allow visualization of the various craniofacial structures of interest. The 3D volumetric images also offer visualization of internal structures by eliminating external structures.
The aims of this study were to investigate the relationship between the pharyngeal airway and facial morphologic patterns in subjects with skeletal Class III malocclusion by evaluating cephalometric variables and the volumes and cross-sectional areas of 3D CT images of the pharyngeal airway. The resulting information could be valuable for understanding the spatial interactions between the pharyngeal airway and the surrounding structures and for diagnosing and treating patients with Class III skeletal malocclusion who require surgical orthodontic therapy.
Material and methods
The study protocol was approved by the ethics review committee at Kangdong Sacred Heart Hospital, Hallym University Medical Center, Seoul, Korea, and informed consent was received from all patients (IRB 09-58-03). The study sample included the records of 60 healthy adults (ages, 18-30 years; mean age, 26.0 ± 4.5 years) who were referred to the Department of Orthodontics for orthodontic treatment and were diagnosed as having Class I or skeletal Class III malocclusion between April and November 2009. The skeletal Class III malocclusion group consisted of 31 subjects (16 men, 15 women) who had been planning on orthodontic treatment with orthognathic surgery. The Class I malocclusion group consisted of 29 subjects (14 men, 15 women) who were characterized by measurements of ANB angle, overjet, and molar relationships ( Table I ). All patients had a fully developed permanent dentition from second molar to second molar. No subject had craniofacial anomalies or symptoms of pharyngeal pathology. Subjects with a history of adenoidectomy or tonsillectomy were also excluded.
| n | Age (y) | P | ||
|---|---|---|---|---|
| Mean | SD | |||
| Men | ||||
| Class I | 14 | 27.9 | 4.9 | 0.46 |
| Class III | 16 | 24.1 | 3.2 | |
| Women | ||||
| Class I | 15 | 25.2 | 3.5 | 0.93 |
| Class III | 15 | 25.3 | 5.0 | |
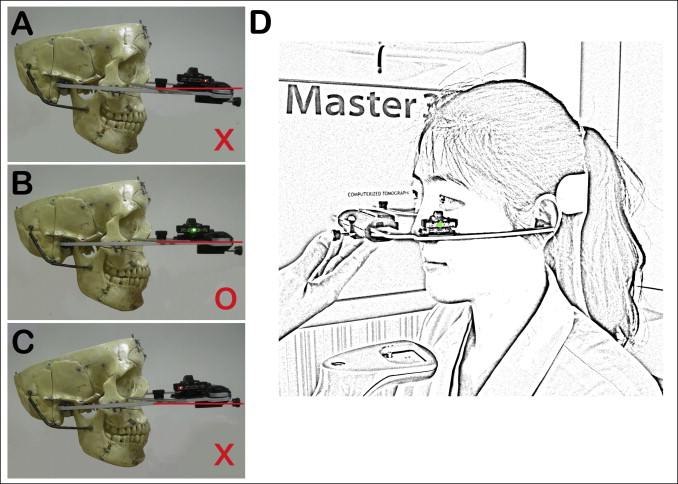
CBCT scans of all subjects were obtained by using the Master 3D dental imaging system (Vatech, Seoul, Korea) with the following parameters: 90 kV, 3.6 mAs, 15-second scan time, and a 20 × 19 field of view. The CBCT scans were taken in the upright position, with a registered head position in which the horizontal reference plane was determined with the Frankfort horizontal plane established by a facebow and a digital level meter (Action level, Seculine, Seoul, Korea) ( Fig 1 ). The patients were asked not to swallow or breathe. The slice thickness was set at 0.3 mm, and the voxel size was 0.3 × 0.3 × 0.3 mm.
The digital image files were exported in digital imaging and communications in medicine (DICOM) format, producing 476 basis images, and imported into the InVivoDental software (Anatomage, San Jose, Calif). These images were rendered into volumetric images, and the reconstructed sagittal, axial, and coronal slices and the 3D models were obtained.
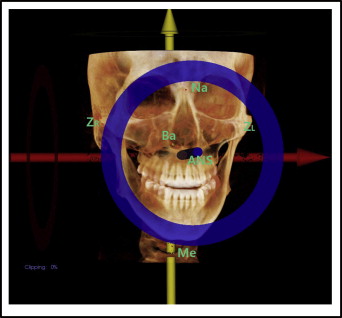
The size of the face was measured from the 3D models by creating a coordinate system. Bizygomatic width, Na-Me distance, and Ba-ANS distance were projected onto the x-axis, y-axis, and z-axis, respectively ( Fig 2 ).
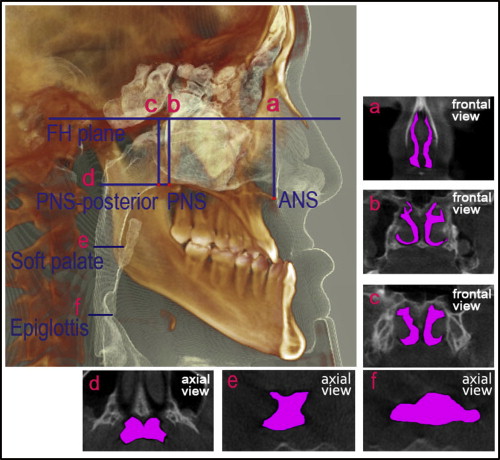
Six cross-sectional planes were used to evaluate the area of the airway and identified on the 3D model ( Fig 3 ). The area measurements were calculated automatically by tracing the soft-tissue outline visible in the reconstructed cross-sectional cuts from the volumetric data by using the InVivoDental (Anatomage) measuring tools. The area measurements included the ANS plane area, the PNS plane area, the PNS-posterior plane area, the PNS-axial plane area, the soft-palate plane area, and the epiglottis plane area.
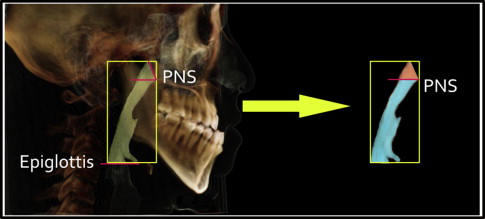
To isolate the airway space, the threshold value was set to a range of −1024 to −300 Hounsfield units. The pharyngeal airway volume was measured by the sum of the upper part of the pharyngeal airway volume and the lower part of the pharyngeal airway volume ( Fig 4 ). The pharyngeal airway volumes were measured automatically by the same examiner (J.S.H.) using the InVivoDental software.
The 2D cephalometric images were derived from the 3D CT scans by using the InVivoDental software, and the images were imported into the V-ceph program (version 5.5; Osstem, Seoul, Korea) for cephalometric analysis. The landmark identifications and measurements were performed by the same investigator (J.S.H.). For the cephalometric analysis, conventional hard-tissue cephalometric landmarks were identified, and 8 anteroposterior and 3 vertical measurements were calculated ( Table II ). To examine the interinvestigator differences, 15 randomly selected cephalometric images derived from the 3D CT scans were retraced and remeasured by another investigator (K.M.O.).
| Variable | Description | |
|---|---|---|
| Anteroposterior skeletal pattern | SNA (°) | Angle between the anterior cranial base (SN) and NA line |
| SNB (°) | Angle between the anterior cranial base (SN) and NB line | |
| ANB (°) | Difference between SNA and SNB | |
| APDI (°) | Anteroposterior dysplasia indicator, the sum of facial plane (N-pog) to Frankfort horizontal (FH) plane angle, AB to facial plane angle, and palatal plane (ANS-PNS) to FH plane angle | |
| Wits (mm) | Distance from A-point to B-point parallel to the occlusal plane | |
| A to N-perp (mm) | Linear distance from A-point to nasion perpendicular | |
| Pog to N-Perp (mm) | Linear distance from pogonion to nasion perpendicular | |
| Mandibular body length (mm) | Linear distance of mandibular plane (Go-Me) | |
| Vertical skeletal pattern | Mandibular plane angle (°) | Angle formed by SN plane, linear distance between S (sella) and N (nasion) and the mandibular plane (Go-Me) |
| Gonial angle (°) | Angle formed by the junction of the posterior and lower borders of the mandible | |
| FMA (°) | Angle formed by the FH plane and the mandibular plane (Go-Me) | |
Statistical analysis
All variables except ANB and FMA were found to be normally distributed by using a normality test at P <0.05. Descriptive statistics, including the means and standard deviations for each group, were calculated with SPSS software for Windows (version 12.0, SPSS, Chicago, Ill). The differences between skeletal Class III and Class I in the men and women were tested by using the Mann-Whitney test. The general linear model was used to evaluate the differences between the 2 groups, controlling for sex, age, and size of face. Spearman correlation coefficients were used to detect relationships between pharyngeal airway volumes and cephalometric variables. Multiple regression analysis was used to determine the relationships between facial morphology and pharyngeal airway volume, controlling for sex, age, and size of face.
Fifteen randomly selected CT images were remeasured by the same investigator 2 weeks after the first measurements. Paired t tests were used to estimate systemic errors, and it was determined that all measurements were free of systemic errors. The random error was estimated with Dahlberg’s formula : (ME 2 = Σd 2 /2n). The random errors varied from 43.11 to 78.67 mm 2 in area measurements, and from 99.83 to 171.4 mm 3 in volume measurements. The interinvestigator differences for the cephalometric measurements were evaluated with paired t tests at P <0.05, and there were no significant differences.
Results
There were significant differences in size of face between the sexes. The bizygomatic width and Na-Me distance were greater in the men than in the women ( P <0.01).
The means and standard deviations for the volumetric, cross-sectional, and cephalometric variables were compared between the 2 groups in men and women ( Tables III and IV ). SNB, ANB, APDI, Wits appraisal, and pogonion to N-perp showed significant differences between the 2 groups for both sexes. The gonial angle was significantly greater in the Class III group in men ( P <0.01), and the mandibular body length was significantly greater in the Class III group in both men ( P <0.05) and women ( P <0.01). No statistically significant differences were found in the cross-sectional area of the pharyngeal airway between the 2 groups in the men. The soft palate plane area and the epiglottis plane area were significantly greater in the Class III group in the women ( P <0.01 and P <0.05, respectively). Only the upper pharyngeal airway volume was significantly greater in the Class III group than in the Class I group in the men ( P <0.05). In the women, however, all volumetric measurements were significantly greater in the Class III group ( P <0.01). There were no significant differences in bizygomatic width, Na-Me, and Ba-ANS between the 2 groups for either sex.
| Measurement | Class I (n = 14) | Skeletal Class III (n = 16) | P | ||
|---|---|---|---|---|---|
| Mean | SD | Mean | SD | ||
| SNA (°) | 79.76 | 2.31 | 80.91 | 3.81 | 0.47 |
| SNB (°) | 77.49 | 1.89 | 84.85 | 4.59 | 0.00 † |
| ANB (°) | 2.22 | 1.08 | −3.94 | 3.09 | 0.00 † |
| APDI (°) | 82.32 | 2.23 | 99.67 | 7.63 | 0.00 † |
| Wits (mm) | −0.74 | 2.43 | −12.71 | 5.2 | 0.00 † |
| A to N-perp (mm) | −1.58 | 1.69 | −2.47 | 4.35 | 0.81 |
| Pog to N-perp (mm) | −5.77 | 5.25 | 5.9 | 9.41 | 0.00 † |
| Body length (mm) | 75.15 | 4.09 | 79.78 | 6.08 | 0.03 ∗ |
| Mandibular plane angle (°) | 32.22 | 4.95 | 34.12 | 6.49 | 0.4 |
| Gonial angle (°) | 116.8 | 5.21 | 127.1 | 5.39 | 0.00 † |
| FMA (°) | 23.44 | 4.81 | 27.48 | 5.88 | 0.11 |
| SA (mm 2 ) | 286.27 | 63.29 | 268.86 | 54.7 | 0.45 |
| SP (mm 2 ) | 348.73 | 108.01 | 362.53 | 102.2 | 0.74 |
| SPP (mm 2 ) | 412.14 | 138.54 | 457.21 | 150.63 | 0.43 |
| SPA (mm 2 ) | 695.38 | 160.46 | 589.3 | 149.59 | 0.09 |
| SSP (mm 2 ) | 261.12 | 88.80 | 373.45 | 234.43 | 0.12 |
| SE (mm 2 ) | 413.08 | 80.88 | 408.19 | 117.62 | 0.90 |
| VUP (mm 3 ) | 3687.69 | 966.46 | 4665.57 | 975.66 | 0.02 ∗ |
| VLP (mm 3 ) | 29680.45 | 7023.32 | 29396.79 | 11841.21 | 0.94 |
| VT (mm 3 ) | 33368.15 | 7355.60 | 34062.36 | 12517.31 | 0.86 |
| ZR-ZL (mm) | 139.78 | 4.11 | 139.51 | 2.84 | 0.49 |
| Na-Me (mm) | 124.96 | 6.09 | 128.43 | 8.16 | 0.29 |
| Ba-ANS (mm) | 92.94 | 3.70 | 88.61 | 5.43 | 0.82 |
| Measurement | Class I (n = 15) | Skeletal Class III (n = 15) | P | ||
|---|---|---|---|---|---|
| Mean | SD | Mean | SD | ||
| SNA (°) | 81.14 | 4.03 | 78.61 | 3.66 | 0.17 |
| SNB (°) | 77.95 | 4.09 | 81 | 3.25 | 0.05 ∗ |
| ANB (°) | 3.19 | 0.68 | −2.31 | 1.95 | 0.00 † |
| APDI (°) | 81.79 | 3.57 | 95.33 | 3.78 | 0.00 † |
| Wits (mm) | −1.72 | 1.49 | −10.4 | 4.62 | 0.00 † |
| A to N-perp (mm) | 0.19 | 2.75 | −1.24 | 3.09 | 0.21 |
| Pog to N-perp (mm) | −5.48 | 6.38 | 3.74 | 6.17 | 0.00 † |
| Body length (mm) | 72.38 | 4.92 | 81.68 | 6.04 | 0.00 † |
| Mandibular plane angle (°) | 35.65 | 6.58 | 38.37 | 5.84 | 0.41 |
| Gonial angle (°) | 120.13 | 7.6 | 125.91 | 7.68 | 0.19 |
| FMA (°) | 26.7 | 5.54 | 31.02 | 13.57 | 0.57 |
| SA (mm 2 ) | 242.74 | 42.19 | 256.49 | 65.29 | 0.54 |
| SP (mm 2 ) | 329.01 | 68.27 | 323.96 | 59.55 | 0.84 |
| SPP (mm 2 ) | 395.06 | 101.11 | 396.87 | 99.49 | 0.96 |
| SPA (mm 2 ) | 700.93 | 130.01 | 711.63 | 130.74 | 0.83 |
| SSP (mm 2 ) | 206.06 | 61.88 | 386.60 | 122.87 | 0.00 † |
| SE (mm 2 ) | 285.28 | 70.47 | 370.31 | 104.82 | 0.03 ∗ |
| VUP (mm 3 ) | 2913.87 | 650.08 | 4115.33 | 990.3 | 0.00 † |
| VLP (mm 3 ) | 20772.4 | 5233.45 | 26737.75 | 4515.21 | 0.00 † |
| VT (mm 3 ) | 23686.27 | 5360.08 | 30853.08 | 4986.11 | 0.00 † |
| ZR-ZL (mm) | 127.38 | 6.90 | 127.87 | 4.27 | 0.66 |
| Na-Me (mm) | 119.20 | 3.80 | 123.38 | 5.45 | 0.08 |
| Ba-ANS (mm) | 90.36 | 3.79 | 88.55 | 4.97 | 0.34 |
Stay updated, free dental videos. Join our Telegram channel
VIDEdental - Online dental courses


