Introduction
Survival analysis is useful in clinical research because it focuses on comparing the survival distributions and the identification of risk factors. Our aim in this study was to investigate the survival characteristics and risk factors of orthodontic mini-implants with survival analyses.
Methods
One hundred forty-one orthodontic patients (treated from October 1, 2000, to November 29, 2007) were included in this survival study. A total of 260 orthodontic mini-implants that had sandblasted (large grit) and acid-etched screw parts were placed between the maxillary second premolar and the first molar. Failures of the implants were recorded as event data, whereas implants that were removed because treatment ended and those that were not removed during the study period were recorded as censored data. A nonparametric life table method was used to visualize the hazard function, and Kaplan-Meier survival curves were generated to identify the variables associated with implant failure. Prognostic variables associated with implant failure were identified with the Cox proportional hazard model.
Results
Of the 260 implants, 22 failed. The hazard function for implant failure showed that the risk is highest immediately after placement. The survival function showed that the median survival time of orthodontic mini-implants is sufficient for relatively long orthodontic treatments. The Cox proportional hazard model identified that increasing age is a decisive factor for implant survival.
Conclusions
The decreasing pattern of the hazard function suggested gradual osseointegration of orthodontic mini-implants. When implants are placed in a young patient, special caution is needed to lessen the increased probability of failure, especially immediately after placement.
Since their introduction, the use of orthodontic mini-implants or screws has become widespread and has gained in popularity. The abundance of recent studies is evidence of this popularity, and, more favorably, patients seem to have high acceptance and satisfaction with this relatively new treatment modality. When researching orthodontic implants, clinicians are frequently concerned about the ultimate success rate and the risk factors of failure.
Survival analysis is the most suitable method to analyze data that have as a principal end point the time until an event occurs; it is a popular method in biomedical research. Survival time can be defined broadly as the time until an event. The event in this study was implant failure. Although some prosthetic dental implant studies used survival analysis, studies of orthodontic mini-implants simply reported success or failure rates. This is less meaningful than a survival analysis.
For an orthodontic-implant success-rate study, survival analysis seems to have several advantages and even be superior to other methods. First, the most important feature of survival analysis is that some subjects in the study have not experienced implant failure at the end of the study or the time of analysis. Because of time limitations, a researcher often cannot wait for all events in all subjects. These situations are called censored observations. Second, some subjects are lost to follow-up, drop out, or experience failure because of an unrelated cause. Third, we usually cannot determine the exact time of implant failure but can notice that the failure happened only at discrete times—ie, at the appointment or the patient’s visit. Survival analysis solves these problems irrespective of the original distribution of data, produces valuable information, including hazard characteristics and survival rates, and identifies risk factors. Thus, survival analysis modeling seemed to be a valuable method for orthodontic mini-implant research, and our aim was to investigate orthodontic implant failure characteristics and risk factors with survival analyses.
Material and methods
One hundred forty-one orthodontic patients (treated from October 1, 2000, to November 29, 2007) were included. Their mean age was 27 years (range, 12-51 years). All patients were treated with fixed appliance and had their 4 first premolars extracted. A total of 260 orthodontic mini-implants (C-implant, Dentium, Seoul, Korea) were placed between the maxillary second premolars and the first molars. The mini-implants were used to retract the anterior segment with a controlled tipping force.
To exclude both material and design factors of the implants, only 1 type of implant was used. This implant had a sandblasted (large grit) and an acid-etched screw part. The screw part was 1.8 mm in diameter and 8.5 mm long. The head part (upper 2 mm) was designed for orthodontic use. Detailed specifications can be found elsewhere.
Five clinical variables (sex, age, implantation side [right or left], oral hygiene, and clinician) were investigated, and survival time was coded by weeks after implant placement. Placement of the mini-implants was performed by 2 right-handed clinicians; one, who had been in clinical orthodontic practice over 30 years, placed 174 mini-implants, and the other (S.H.K.), who had 10 years of experience, placed 86 mini-implants. The healing period after placement was 4 weeks. Oral hygiene status was determined by reviewing orthodontic records and intraoral photos subjectively.
Failures of implants were coded as events data. Implants that were removed because the treatment ended and those that were not removed during the fixed period of this investigation were coded as censored data. Discrete failure time was recorded in weeks.
Statistical analysis
The Fisher exact test significance and odds ratio statistics were calculated. A nonparametric life table method was used to easily visualize the hazard function over time. There were only 2 failure events after 70 weeks (at 113 and 117 weeks), and the hazard function was depicted at a 100-week limit. Kaplan-Meier survival curves were generated, and the Gehan generalized Wilcoxon test was used to identify the variables associated with implant failure. Prognostic variables associated with implant failure were identified with the Cox proportional hazard model by using SPSS software for Windows (version 12.0, SPSS, Chicago, Ill). The level of statistical significance was set at 5%.
Results
The average participating time of each implant was 74 ± 41 weeks and ranged from 1 to 189 weeks. Of the 260 implants, 22 failed, and 238 were censored, 220 of which completed orthodontic treatment. The average orthodontic treatment time was 88 weeks.
There was no significant difference in the success rates between implantation sides, clinicians, sex, and oral hygiene. Only the age variable had a significant association with success rate ( Table I ). When the success rates were evaluated for each clinician, the results were similar for the pooled data in Table I .
| Variable | Success n (%) |
Failure n (%) |
Total | Exact test significance |
Odds ratio (95% CI) |
|---|---|---|---|---|---|
| Implantation side | 1.000 | 1.07 (0.45, 2.56) | |||
| Right | 123 (91.8) | 11 (8.2) | 134 | ||
| Left | 115 (91.3) | 11 (8.7) | 126 | ||
| Clinician | 1.000 | 0.94 (0.37, 2.40) | |||
| 1 | 159 (91.4) | 15 (8.6) | 174 | ||
| 2 (S.H.K.) | 79 (91.9) | 7 (8.1) | 86 | ||
| Sex | 0.598 | 0.76 (0.28, 2.05) | |||
| Male | 53 (89.8) | 6 (10.2) | 59 | ||
| Female | 185 (92.0) | 16 (8.0) | 201 | ||
| Oral hygiene | 0.508 | 1.40 (0.58, 3.36) | |||
| Good | 128 (92.8) | 10 (7.2) | 138 | ||
| Bad | 110 (90.2) | 12 (9.8) | 122 | ||
| Age subgroups (y) ∗ | 0.025 † | 0.31 (0.11, 0.85) | |||
| <20 | 42 (82.4) | 9 (17.6) | 51 | ||
| 20-30 | 121 (93.8) | 8 (6.2) | 129 | ||
| >30 | 75 (93.8) | 5 (6.4) | 80 |
∗ Among the 3 subgroups, the odds ratio was calculated between the <20 and the 20-30 age subgroups
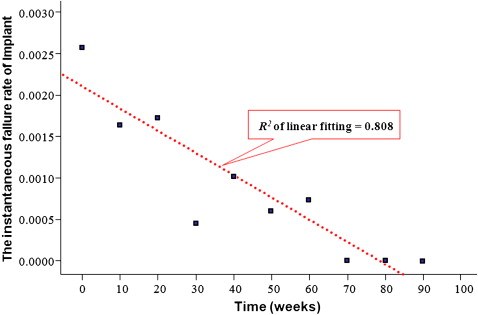
The hazard function of implant survival time gives the conditional failure rate. Therefore, the hazard function is regarded as the instantaneous failure rate. Late failure events at 70, 113, and 117 weeks were observed. When the time after implant placement was truncated at 100 weeks, the hazard function of implant failure showed that the risk was highest immediately after placement and then decreased to zero. The linear fit of the hazard function showed high quality of fit ( R 2 = 0.81) with a negative slope over time, as shown in Figure 1 .

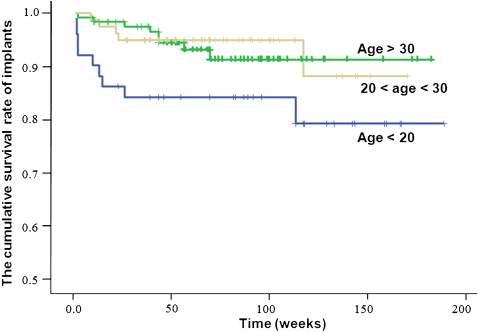
The survival function is also called the cumulative survival rate. The mean time of permanence for the implant placed was 156.5 weeks, and the median time of permanence far exceeded the mean orthodontic treatment time. The Kaplan-Meier survival curve ( Fig 2 ) showed an extremely high success rate. The Gehan generalized Wilcoxon test showed that, for patients younger than 20 years, the survival rate was significantly lower than for older subgroups ( P = 0.029).

The Cox proportional hazard model also showed that increasing age is a decisive factor for implant survival ( Table II ). The estimated probability of implant failure decreased 0.925 times with each year of the patient’s age ( P = 0.016).
Stay updated, free dental videos. Join our Telegram channel

VIDEdental - Online dental courses


