Introduction
The aims of this study were to evaluate and compare skeletal, dentoalveolar, dental, and periodontal changes in surgically assisted rapid maxillary expansion (SARME) patients with and without pterygomaxillary disjunction.
Methods
The records of 20 patients who underwent SARME in the clinics of the dental school at Marmara University in Turkey were collected and divided into 2 groups of 10 patients each, according to the surgical protocol followed. Cone-beam computed tomography images before the operation and 3 to 6 months after the end of active expansion were analyzed by 20 linear and 7 angular measurements. The reliability of the 3-dimensional analysis was investigated.
Results
All transversal measurements in the dentoalveolar and dental levels increased after expansion in both the SARME with pterygomaxillary disjunction and the SARME without pterygomaxillary disjunction groups with no significant differences between them. In the SARME without pterygomaxillary disjunction group, more pronounced buccal alveolar bending and buccal tipping of the posterior teeth were found, but the difference did not reach statistical significance. SARME reduces buccal alveolar width in the premolar region significantly when pterygoid disjunction is not performed.
Conclusions
SARME with or without pterygomaxillary disjunction is an effective technique to treat maxillary transverse deficiency in adolescent and adult patients. Pterygomaxillary disjunction is advised in periodontally compromised patients. Cone-beam computed tomography scanning is a reliable method for studying the dentoskeletal effects of SARME.
Highlights
- •
Surgically assisted rapid maxillary expansion (SARME) can correct transverse discrepancies and maxillary transverse deficiencies.
- •
Cone-beam computed tomography is reliable for assessing maxillary dentoskeletal changes after expansion.
- •
SARME can cause buccal tipping of posterior teeth and buccal alveolar bending.
- •
Separate the pterygoid plates to minimize buccal alveolar width reductions.
Transverse maxillary deficiency is a frequent component of malocclusions. Rapid maxillary expansion (RME) is a well-established method to correct this problem as well as arch length discrepancies. Although this is the treatment of choice for growing adolescents, for skeletally mature patients RME has proved to have limited orthopedic effects on the maxillary skeletal structures because of the increased thickness of the bones, with reduced elasticity and obliteration of the maxillary sutures that accompany maturation. Surgically assisted RME (SARME) has been used in recent years to overcome these obstacles and offers a true orthopedic result without unwanted effects such as lateral tipping of the posterior teeth, buccal fenestrations, failure to open the midpalatal suture, alveolar bending, extrusion of posterior teeth, pain, instability, and root resorption.
Although SARME was introduced in 1938 and has been well established, there is no current consensus for the surgical technique to be followed. Different osteotomies and combinations of them have been described in the literature, and only general guidelines exist. Ideally, the patient’s age, treatment needs, and the stresses generated in each area of the maxilla during the application of orthodontic forces should dictate the osteotomy lines. Recognized areas of stresses that impede the unrestricted opening of the maxilla are the piriform aperture pillars (anteriorly), the zygomatic buttress (laterally), the pterygoid junction (posteriorly), and the midpalatal suture (medially). More specifically, the need for dissecting the pterygoid plates and the effects of such procedures on the treatment outcome still need to be elucidated, especially if we consider the increased risk of an osteotomy in the pterygoid plate area.
The need for releasing the maxilla from the posterior stresses of the pterygoid plates has been advocated, whereas other authors have shared the more conservative approach that removing the resistance from the zygomatic buttress is sufficient for true orthopedic expansion. Koudstaal et al stated that SARME without pterygoid separation results in a different pattern of expansion. They believed that the ratio of anterior to posterior expansion is higher in patients with no pterygoid separation than in SARME patients who underwent pterygoid osteotomy, and this might be considered as an individualized treatment to achieve more distraction on either the posterior or the anterior level.
A review of the literature about SARME shows that the authors of most studies evaluated the efficiency and efficacy of the technique using plaster models of the patient’s dentition, posteroanterior cephalograms, or computed tomography. Only recently, cone-beam computed tomography (CBCT) studies on the subject of SARME have started appearing, and this is the first CBCT study to investigate the effect of pterygoid disjunction on the treatment outcome.
The aims of this study were to compare and evaluate the immediate dentoskeletal effects of 2 distinct surgical techniques used for SARME. The difference between these techniques consists of whether the release of the pterygoid junction was performed.
Material and methods
This was a retrospective study approved by the ethical committee of the Institute of Health Sciences of Marmara University in Istanbul, Turkey. Between June 2011 and July 2012, 26 patients underwent SARME in the Department of Orthodontics. Of the 26 patients, 3 with craniofacial anomalies, including cleft patients, were excluded from this study, as were 3 patients with missing diagnostic records at the desired time points. CBCT records of 20 patients (4 male, 16 female; mean age, 18.8 years) were retrieved from the department’s archives. All subjects were white from the same geographic area. CBCT images were obtained immediately before the surgical procedure and 3 to 6 months after completion of the active expansion according to the standardized protocol for all patients undergoing SARME at Marmara University. In all patients, expansion was performed with the same intraoral appliance, a bonded acrylic hyrax-type expander, covering all posterior teeth, without previous orthodontic treatment.
According to the surgical protocol that was undertaken, the patients were divided into 2 groups: SARME with pterygoid disjunction (SARME +PD) and SARME without pterygoid disjunction (SARME −PD).
In the SARME −PD group (10 patients; mean age, 19.2 years), the surgical technique involved the bilateral LeFort I type of osteotomy plus midline osteotomy. In the SARME +PD (10 patients; mean age, 18.4 years), the same protocol was followed with pterygoid disjunction performed additionally. The lateral LeFort I cuts extended from the piriform rims anteriorly through the zygomatic buttress to the tuberosity area posteriorly, 4 to 5 mm above the apices of the maxillary teeth, and were carried out with a reciprocating saw. The midline osteotomy was performed with a spatula type of chisel placed between the anterior nasal spine and the apices of the central incisors. Separation of the pterygoid plates was done with an angulated osteotome. Intraoperatively the hyrax screw was activated 8 times (2 mm) just before the midline osteotomy. After a latency period of 3 days, the patients started activating the expander twice daily (0.5 mm) until adequate expansion was achieved.
All 3-dimensional (3D) scans in DICOM format were reoriented and resliced based on the Frankfort horizontal (FH) with a standardized procedure using MIMICS software (version 14.0; Materialise, Leuven, Belgium).
Our 3D analysis included measurements on the skeletal level (including measurements describing the effects of the techniques on the pterygoid plate anatomy), on the dentoalveolar level, on the dental level, and periodontal measurements.
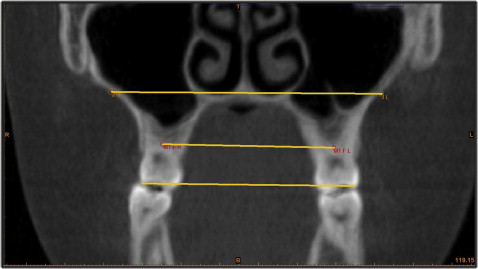
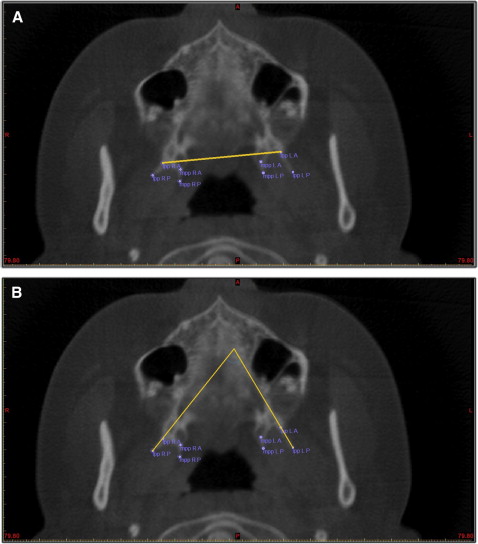
For the skeletal measurements ( Table I ) at the anterior part of the maxilla, the diameter of the piriform aperture—the distance between the left and right piriform rims—was measured. Medially, the distance between jugale points bilaterally ( Fig 1 ); posteriorly, the distance between the lateral pterygoid plates bilaterally ( Fig 2 , A ); and the angles between the left and right lateral pterygoid plates ( Fig 2 , B ) and between the medial pterygoid plates were measured.
| Measurement | Definition |
|---|---|
| J distance | The distance between jugale points of the left and right sides. Jugale point for a specific side is defined on the coronal slice passing through the molar furcation point of that side, as the intersection between the arch of the zygomatic process and the horizontal line passing through the floor of the nose ( Fig 1 ). |
| Pir L-R | The diameter of the piriform aperture. Distance between left and right piriform rims (the most latero-inferior points were traced on the 3D reconstructed image). |
| lpp L-R | The distance between anterior points of the left and right lateral pterygoid plates. Pterygoid plates were traced on the axial slice at the level that the palatal foramens could be best seen; lateral and medial plates were traced by 2 points each, anterior and posterior—posteriorly at the most posterior aspect of the plate and anteriorly at the most concave point on the pterygomaxillary fissure line for the lateral plates and on the pterygomaxillary fissure line for the medial plates ( Fig 2 , A ). |
| lpp angle | The angle between the left and right lateral pterygoid plates ( Fig 2 , B ). |
| mpp angle | The angle between the left and right medial pterygoid plates. |
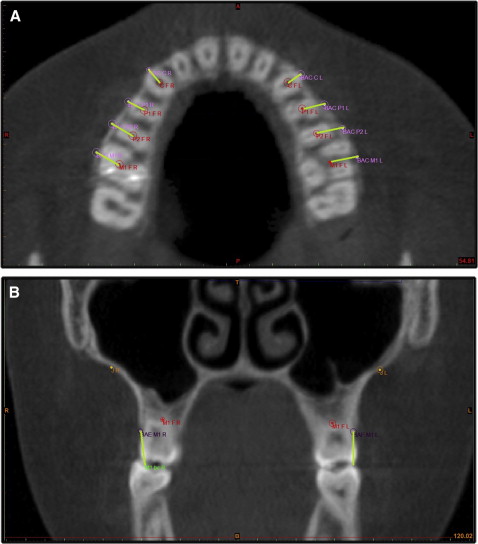
For the dentoalveolar measurements ( Table II ), the major part of this analysis was based on a plane defining the dentoalveolar level of the maxilla. This plane was defined by the trifurcation points of the 2 first molars separately for each side and is parallel to the FH plane. After defining the first molar’s root trifurcation point on the same 2-dimensional axial slice, the centers of the roots of the first premolar and the canine were identified also, and this was repeated for the contralateral side. Linear distances between the contralateral points were measured ( Fig 3 ). Switching to the coronal view, tangents on the alveolar crests were defined bilaterally on the palatal side at the molar level sagitally, and the angle between them and the FH was calculated describing the angulation of the alveolar crests.
| Measurement | Definition |
|---|---|
| CF L-R | Distance between the canine furcation points bilaterally ( Fig 3 , A ). |
| P1F L-R | Distance between the first premolar furcation points bilaterally ( Fig 3 , A ). |
| P2F L-R | Distance between the second premolar furcation points bilaterally ( Fig 3 , A ). |
| M1F L-R | Distance between the first molar furcation points bilaterally ( Fig 3 , A ). |
| Or-alv L,R | Angulation of the alveolar crests. On each side and at the coronal slice of the molar furcation point, a line tangent to the alveolar crest is defined. This measurement represents the angle between this line and the line passing through the Or points (the outer angle). |
For the dental measurements ( Table III ), the distances between the buccal cusps of contralateral teeth were measured. The angulation of each tooth’s axis and the FH was calculated to evaluate dental tipping. Also, the vertical effects of the technique were described.
| Measurement | Definition |
|---|---|
| C c L-R | Intercanine width. Distance between the left and right canine cusps. |
| P1 bc L-R | Interpremolar width for first premolars. Distance between the buccal cusps of the left and right first premolars. |
| P2 bc L-R | Interpremolar width for second premolars. Distance between the buccal cusps of the left and right second premolars. |
| M1 bc L-R | Intermolar width. Distance between the mesiobuccal cusps of the left and right first molars. |
| Or-C | Canine angulation. Angle between the Or line and the canine axis as defined by the cusp and root apex. |
| Or-P1 | First premolar angulation. Angle between the Or line and the first premolar axis as defined by the buccal cusp and the buccal root apex. |
| Or-P2 | Second premolar angulation. Angle between the Or line and the second premolar axis as defined by the buccal cusp and the buccal root apex. |
| Or-M1 | Molar angulation. Angle between the Or line and the first molar axis as defined by the mesiobuccal cusp and the palatal root apex. |
| FH to M1 | Vertical molar movement. Distance between the molar furcation point and the Frankfort horizontal. |
For the periodontal measurements ( Table IV ), the periodontal effects of the technique were evaluated by measuring the width of the buccal alveolar bone covering the posterior teeth and the canines on the previously defined dentoalveolar level ( Fig 3 , A ), as well as the height of the alveolar crest ( Fig 3 , B ).
| Measurement | Definition |
|---|---|
| BAC to CF | Width of the buccal alveolar bone in the canine region. The shortest distance between the canine furcation point and the edge of the alveolar bone at the same axial slice ( Fig 3 , A ). |
| BAC to P1F | Width of the buccal alveolar bone in the first premolar region. The shortest distance between the first premolar furcation point and the edge of the alveolar bone at the same axial slice ( Fig 3 , A ). |
| BAC to P2F | Width of the buccal alveolar bone in the second premolar region. The shortest distance between the second premolar furcation point and the edge of the alveolar bone at the same axial slice ( Fig 3 , A ). |
| BAC to M1F | Width of the buccal alveolar bone in the first molar region. The shortest distance between the first molar furcation point and the edge of the alveolar bone at the same axial slice ( Fig 3 , A ). |
| Cusp to BAE C | Alveolar bone height in the canine region. Distance between canine cusp and the marginal ridge of the alveolar bone. Buccal alveolar edge (BAE) points are given on the 3D reconstruction of the scan at the middle of the anatomic crown of the tooth ( Fig 3 , B ). |
| Cusp to BAE P1 | Alveolar bone height in the first premolar region. Distance between the first premolar buccal cusp and the marginal ridge of the alveolar bone ( Fig 3 , B ). |
| Cusp to BAE P2 | Alveolar bone height in the second premolar region. Distance between the second premolar buccal cusp and the marginal ridge of the alveolar bone ( Fig 3 , B ). |
| Cusp to BAE M1 | Alveolar bone height in the first molar region. Distance between the first molar mesiobuccal cusp and the marginal ridge of the alveolar bone ( Fig 3 , B ). |
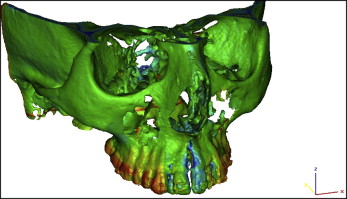
In addition to the 3D cephalometric analysis, to better visualize the dental and skeletal effects of SARME, the preexpansion and postretention 3D reconstructed scans were superimposed according to the best fit of the cranial base, and color mapping of the affected areas was created by the 3-Matic module of the MIMICS software ( Fig 4 ).
Statistical analysis
Statistical analysis was performed using the Statistical Package for the Social Sciences (version 15.0.1; SPSS, Chicago, Ill). The Student t test was used for the intergroup comparisons of parameters with normal distributions, and the Mann-Whitney U test was used for the intergroup comparisons of parameters without normal distributions. The paired samples t test was used for the in-group comparisons of parameters with normal distributions. In the analysis of reliability regarding parameter measurements, the intraclass correlation coefficient was calculated. All measurements were calculated twice by the same investigator (A.S.) in a 2-week interval ( P <0.05).
Results
On the skeletal level ( Table V ), true anterior skeletal expansion was evident in both groups with no statistically significant differences between them. No expansion can be reported for the posterior aspect of the maxilla on the skeletal level (lpp L-R difference, 0.93 ± 1.68/0.75 ± 1.19 mm). In the middle area of the maxilla, however, in the SARME −PD group, constriction was seen between the jugale points. The skeletal measurements between the 2 groups did not differ significantly.
| Skeletal measurement | SARME +PD | SARME −PD | P ‡ |
|---|---|---|---|
| Mean ± SD | Mean ± SD | ||
| J distance | |||
| Preop | 63.23 ± 6.54 | 63.49 ± 6.50 | 0.930 |
| Postop | 62.64 ± 6.05 | 62.09 ± 6.90 | 0.853 |
| P § | 0.242 | 0.021 ∗ | |
| Pir L-R | |||
| Preop | 20.38 ± 1.94 | 20.08 ± 1.99 | 0.737 |
| Postop | 22.55 ± 1.49 | 22.84 ± 1.84 | 0.705 |
| P § | 0.001 † | 0.001 † | |
| lpp L-R | |||
| Preop | 45.27 ± 3.93 | 45.34 ± 2.69 | 0.964 |
| Postop | 46.20 ± 3.21 | 46.09 ± 3.24 | 0.940 |
| P § | 0.113 | 0.077 | |
| lpp angle | |||
| Preop | 67.35 ± 14.02 | 76.43 ± 11.55 | 0.132 |
| Postop | 61.20 ± 13.80 | 77.20 ± 9.90 | 0.008 † |
| P § | 0.119 | 0.827 | |
| mpp angle | |||
| Preop | 18.67 ± 8.75 | 19.46 ± 11.86 | 0.866 |
| Postop | 14.23 ± 9.86 | 23.49 ± 7.50 | 0.030 ∗ |
| P § | 0.228 | 0.272 | |
| Difference | SARME +PD | SARME −PD | P |
|---|---|---|---|
| Mean ± SD (median) | Mean ± SD (median) | ||
| J distance | −0.58 ± 1.48 (−0.77) | −1.39 ± 1.57 (−0.92) | 0.257 |
| Pir L-R | 2.16 ± 1.41 (2.66) | 2.75 ± 1.41 (2.24) | 0.545 |
| lpp L-R | 0.93 ± 1.68 (0.73) | 0.75 ± 1.19 (0.57) | 0.650 |
| lpp angle | −6.15 ± 11.30 (−3.62) | 0.77 ± 10.83 (4.92) | 0.112 |
| mpp angle | −4.44 ± 10.85 (−2.09) | 4.02 ± 10.86 (5.25) | 0.096 |
On the dentoalveolar level ( Table VI ), significant expansion was achieved between the contralateral teeth ( P <0.01) in both groups. No significant differences can be reported between the 2 groups. The decrease seen in the or-alv L,R angle postoperatively compared with the preoperative values indicated buccal tipping of the alveolar crest. More pronounced tipping was reported in the SARME −PD group (−5.45° ± 4.25°) than in the SARME +PD group (−7.34° ± 5.81°); however, the difference did not reach statistical significance.
| Dentoalveolar measurement | SARME +PD | SARME −PD | P † |
|---|---|---|---|
| Mean ± SD | Mean ± SD | ||
| CF L-R | |||
| Preop | 26.74 ± 2.17 | 26.20 ± 1.65 | 0.572 |
| Postop | 29.61 ± 3.05 | 29.03 ± 2.43 | 0.669 |
| P ‡ | 0.001 ∗ | 0.001 ∗ | |
| P1F L-R | |||
| Preop | 32.20 ± 2.81 | 31.26 ± 1.95 | 0.417 |
| Postop | 36.43 ± 3.27 | 34.96 ± 2.96 | 0.319 |
| P ‡ | 0.001 ∗ | 0.001 ∗ | |
| P2F L-R | |||
| Preop | 36.92 ± 3.43 | 36.50 ± 2.20 | 0.748 |
| Postop | 40.75 ± 3.54 | 40.08 ± 2.99 | 0.653 |
| P ‡ | 0.001 ∗ | 0.001 ∗ | |
| M1F L-R | |||
| Preop | 42.25 ± 4.05 | 42.28 ± 1.42 | 0.979 |
| Postop | 46.20 ± 3.89 | 45.79 ± 2.35 | 0.777 |
| P ‡ | 0.001 ∗ | 0.001 ∗ | |
| Or-alv L,R | |||
| Preop | 80.05 ± 3.16 | 78.39 ± 4.51 | 0.356 |
| Postop | 74.59 ± 4.23 | 71.05 ± 3.94 | 0.069 |
| P ‡ | 0.003 ∗ | 0.001 ∗ | |
| Difference | SARME +PD | SARME −PD | P |
|---|---|---|---|
| Mean ± SD (median) | Mean ± SD (median) | ||
| CF L-R | 2.86 ± 1.78 (2.86) | 2.82 ± 1.35 (2.73) | 0.965 |
| P1F L-R | 4.23 ± 1.35 (3.89) | 3.69 ± 1.77 (4.00) | 0.775 |
| P2F L-R | 3.83 ± 1.29 (3.63) | 3.57 ± 1.91 (3.78) | 0.880 |
| M1F L-R | 3.95 ± 1.47 (3.64) | 3.50 ± 1.70 (2.98) | 0.496 |
| Or-alv L,R | −5.45 ± 4.25 (−4.67) | −7.34 ± 4.64 (−5.81) | 0.257 |
On the dental level ( Table VII ), all distances between cusps of the contralateral teeth increased significantly in both groups with no difference between the groups. SARME resulted in buccal tipping of all posterior teeth but not of the canines. Moreover, the distance between the molar furcation point and the FH decreased significantly in both groups.


