Introduction
The use of bimaxillary surgeries to treat Class III malocclusions makes the results of the surgeries more complicated to estimate accurately. Therefore, our objective was to develop an accurate soft-tissue prediction model that can be universally applied to Class III surgical-orthodontic patients regardless of the type of surgical correction: maxillary or mandibular surgery with or without genioplasty.
Methods
The subjects of this study consisted of 204 mandibular setback patients who had undergone the combined surgical-orthodontic correction of severe skeletal Class III malocclusions. Among them, 133 patients had maxillary surgeries, and 81 patients received genioplasties. The prediction model included 226 independent and 64 dependent variables. Two prediction methods, the conventional ordinary least squares method and the partial least squares (PLS) method, were compared. When evaluating the prediction methods, the actual surgical outcome was the gold standard. After fitting the equations, test errors were calculated in absolute values and root mean square values through the leave-1-out cross-validation method.
Results
The validation result demonstrated that the multivariate PLS prediction model with 30 orthogonal components showed the best prediction quality among others. With the PLS method, the pattern of prediction errors between 1-jaw and 2-jaw surgeries did not show a significantly difference.
Conclusions
The multivariate PLS prediction model based on about 30 latent variables might provide an improved algorithm in predicting surgical outcomes after 1-jaw and 2-jaw surgical corrections for Class III patients.
Highlights
- •
We developed a soft-tissue prediction model that can be applied to Class III surgery patients.
- •
The partial least squares method was better than the conventional ordinary least squares method.
- •
We discussed choosing an optimal number of the partial least squares components.
- •
The multivariate partial least squares of 30 latent variables had the best prediction quality.
- •
We explained why partial least squares is a more accurate prediction than the conventional method.
One of the most important considerations in orthodontic treatment planning is an esthetic posttreatment patient profile. Many orthodontic residency programs teach this as the primary objective from which all other clinical treatment decisions are based. In patients with significant skeletal discrepancies requiring orthognathic surgery, decisions regarding the details of the surgical methods would be much easier if the exact results of the surgery could be accurately predicted and portrayed while still in the treatment planning stage. Consequently, the orthodontic literature is replete with studies regarding the associations between surgical skeletal repositioning and soft-tissue responses. Imagine being able to perform a simulation of various surgeries on a commercially available 3-dimensional software-rendered model that produced predictable results, reliable enough to dictate treatment decisions and accurate enough to show a patient what his or her eventual appearance would be. This would increase a patient’s understanding and acceptance of the recommended treatment. Of course, prediction software is currently available, but anyone who has used it realizes that the predictions are often rudimentary, unrealistic, and unreliable. As analysis techniques advance, orthodontic software should continue to integrate these advances to better serve clinicians. Consequently, clinicians should come to expect more from their orthodontic imaging software programs.
As any clinician involved with patients with severe Class III malocclusions quickly realizes, the soft-tissue profile does not directly, 1 to 1, follow the surgical changes of the underlying bony structures. The partial least squares (PLS) method is a comparatively new way of formulating prediction equations, and its application to various scientific and biologic disciplines from chemical engineering to brain image analysis is becoming increasingly widespread. Applying the PLS method is advantageous when there are many variables and they are highly correlated. The merit of the PLS method is its capability of taking correlation structures into account, controlling not only for the correlations between the predictor and response variables but also for the correlations within the predictor variables and the response variables.
Recently, a study applying the multivariate PLS method to mandibular setback surgeries demonstrated considerably more accurately predictions than the conventional ordinary least squares (OLS) method. The conventional OLS method was determined to be unsatisfactory when there were many correlated variables. Among the variables considered when predicting the soft-tissue response to surgery are the patient’s age, sex, time after surgery, and presurgical soft-tissue characteristics, including tissue thickness measured at various landmarks. These various factors can be considered in the PLS method through orthogonal linear combinations that can extract a small number of significant components that are combinations of the original variables. In addition, the improved accuracy of the PLS method is most likely because the soft-tissue response at a specific point highly depends on its adjacent soft-tissue response: ie, the interdependency of soft-tissue points.
However, the aforementioned investigation had only been performed for mandibular setback surgeries alone. Class III 2-jaw surgery patients had not yet been included. Including an additional surgery has a great influence on the soft-tissue profile changes, greatly complicating the prediction. Consequently, most studies have reported only 1 specific maxillofacial surgery in their soft-tissue analyses. Because bimaxillary surgery produces more stable results than single-jaw mandibular procedures in Class III correction, clinically, there has been an increase in its use. However, current prediction programs for bimaxillary surgery are less predictable than for 1-jaw surgery. It is especially difficult to accurately determine the changes in the soft-tissue profile when mandibular setback surgeries are combined with other surgical procedures, such as a LeFort I osteotomy or a genioplasty.
Our aim in this study was to develop an accurate soft-tissue prediction method that can be applied to various methods of Class III surgical correction: mandibular surgery and maxillary surgery, and genioplasty. In addition, we discuss the steps in choosing an optimal multivariate PLS prediction model.
Material and methods
The institutional review board of Seoul National University School of Dentistry for the protection of human subjects reviewed and approved the research protocol (number S-D 20140018).
The subjects consisted of 204 patients (103 women and 101 men with an average age of 24 years) who had undergone surgical correction of a severe Class III malocclusion. All subjects were of Korean ethnicity. All patients received mandibular setback surgery, and 133 patients had LeFort I maxillary osteotomy. Genioplasty was performed for 81 patients. Table I provides further details of the patients with regard to ages at surgery and some cephalometric and occlusal characteristics. All patients had ceased growing and were healthy, without cleft lip and palate, injury, or craniofacial syndrome.
| Variable | Mean | SD | Minimum | Maximum |
|---|---|---|---|---|
| Age (y) | ||||
| Female (n = 103) | 23.8 | 5.1 | 16.0 | 50.5 |
| Male (n = 101) | 23.6 | 3.5 | 18.8 | 39.1 |
| Time after surgery (mo) | 9.1 | 3.9 | 3.7 | 29.4 |
| Maxillary surgery | ||||
| No (n = 71) | ||||
| Yes (n = 133) | ||||
| Genioplasty | ||||
| No (n = 123) | ||||
| Yes (n = 81) | ||||
| Overjet before surgery (mm) | −5.8 | 3.8 | −19.6 | 2.2 |
| Overbite before surgery (mm) | −0.2 | 1.8 | −5.4 | 5.9 |
| Amount of surgical repositioning at Point A (mm) ∗ (n = 133) | ||||
| Anteroposterior repositioning | 1.4 | 1.9 | −4.4 | 7.0 |
| Vertical repositioning | −1.1 | 2.3 | −7.1 | 4.4 |
| Amount of surgical repositioning at Point B (mm) ∗ (n = 204) | ||||
| Anteroposterior repositioning | −7.3 | 3.8 | −24.1 | 4.1 |
| Vertical repositioning | −2.9 | 4.2 | −14.8 | 11.4 |
∗ A negative value indicates either a posterior direction or a superior direction during surgical repositioning.
Preoperative lateral cephalograms were taken close to the time of surgical correction. The data were collected prospectively with the postoperative radiographs taken at least 4 months (average, 9.1 months) after surgery to allow any residual soft-tissue swelling to resolve.
Thirty-nine skeletal landmarks and 32 soft-tissue landmarks from glabella to the terminal point were identified. With its origin at sella, the vertical reference was established perpendicular to the sella-nasion line plus 7°. Using a custom digitizing program via C# programming language (Microsoft, Redmond, Wash), the coordinates of every landmark on each tracing were sequentially computed in relation to the x and y reference system.
The prediction process had 2 stages: building a prediction equation through model fitting, and validation by applying the equation to each subject and calculating test errors. Figure 1 is a flow diagram for establishing the prediction model in this study.
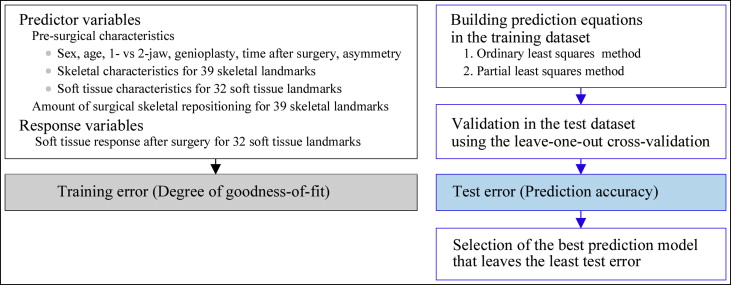
Two hundred twenty-six predictor variables and 64 response variables were entered into the prediction equation. The predictor variables included each patient’s age and sex, time after surgery, 1-jaw vs 2-jaw surgery, conjunctive genioplasty, amount of asymmetry, 39 presurgical skeletal landmarks, 32 soft-tissue landmarks before surgery, and 78 (39 × 2) variables measuring the surgical skeletal repositioning in both the anteroposterior and vertical directions. The 64 (32 × 2) response variables were set as the soft-tissue position after surgery in the 32 soft-tissue landmarks in both the x-axis and the y-axis.
The training data set was numerically treated via centering and normalization. The centering made the following computations numerically well conditioned. The normalization gave each variable equal influence in the initial stage of the data analysis.
Two multivariate methods of constructing prediction equations were developed using the conventional OLS and the PLS methods.
First, the conventional OLS method covers from a simple ratio statistics or correlation analysis to a more complex multiple linear regression. In this study, the multivariate multiple linear regression with forward variable selection was used. The model was selected with the Akaike information criterion; the lower this criterion, the better the model will be.
Second, the PLS method is a multivariate regression with latent variables (also called components). This latent variable method was used to focus the information of a large data set into a few underlying components or factors, leaving most of the measurement noise behind as residuals. Although some mathematical details would have been needed, we emphasized the methods and results rather than their theoretical background. With regard to more detailed mathematical properties and interpretations for the PLS method, please refer to the studies of Hastie et al and Wehrens.
In the training data set, the absolute error values after fitting the prediction equation (also called training error) were measured.
After constructing the prediction equation in the training data set, the validation was performed in the test data set (also called the validation data set), and test errors (also called validation errors) were calculated for each subject. We applied the leave-1-out cross-validation technique. The test errors were also used to determine the optimal number of PLS components. From the statistical and clinical viewpoints, the test error is the most important criterion in determining the best prediction model. To restate, the lower the test errors, the better the prediction model becomes.
Plus and minus errors of the prediction could cancel each other out when mean errors are being calculated. Therefore, test errors in the forms of absolute values and root mean square error values of prediction were used as the decision criteria for the predictive performance.
Having chosen the final prediction model, we compared the prediction accuracy between the OLS and PLS methods, and between the 1-jaw and 2-jaw surgery patients.
The free statistics software language R was used. It runs on a wide variety of UNIX platforms, Windows (Microsoft), and MacOS (Apple Inc, Cupertino, Calif). The entire data and complete results without personal patient information will be available upon request to the authors.
Results
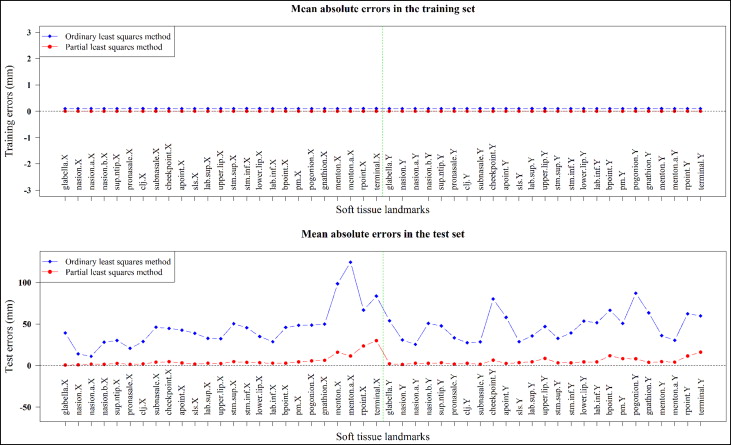
At the stage of building prediction equations, the goodness of fit or the quality of model fitting can be expressed as the extent of training errors. The training errors from both the OLS and PLS methods were negligible or trivial, as shown in Figure 2 (top). However, after applying the prediction equation to each subject in all response variables, the test errors showed significantly lower errors in the PLS method than in the conventional OLS method ( Fig 2 [bottom]).
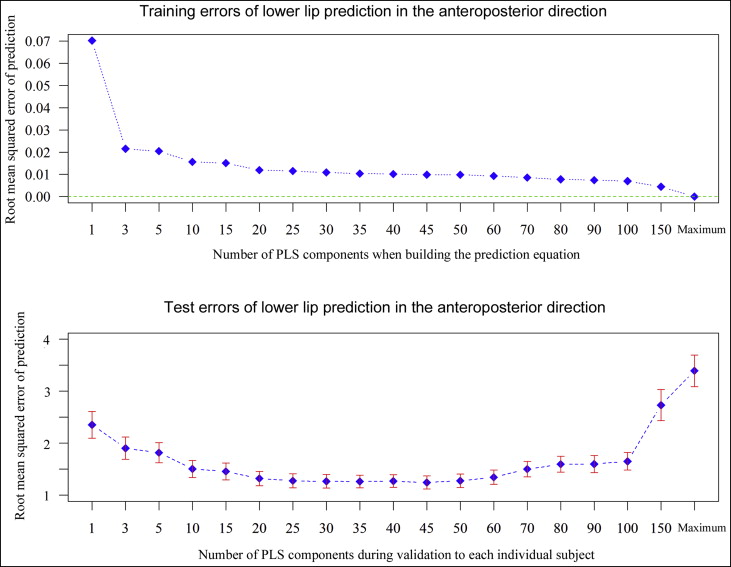
A root mean square error of prediction curve was used to select the best prediction model. Figure 3 shows the root mean square error of prediction curves in both the training and the test data set for a selected landmark. In building prediction equations with the training set, the more components that were included, the smaller the predicton errors obtained. The full prediction model with the entire components had no error in the training set. However, when validating the equation to each subject, there was an optimum number of components to minimize prediction error in the test set ( Fig 3 ). Typically, we chose the smallest model that minimized the expected prediction error. Therefore, the PLS prediction equation with 30 components was selected as the final prediction model.
Soft-tissue prediction accuracy was compared between 1-jaw (mandibular setback) and 2-jaw surgery patients; this is given in Table II . Among all 32 soft-tissue landmarks, 12 were chosen to concisely report the results. There was no statistically significant difference in the test errors between the 1-jaw and 2-jaw surgeries.
| Soft-tissue landmark | Anteroposterior error ( x direction, mm) | P value | Vertical error ( y direction, mm) | P value | ||
|---|---|---|---|---|---|---|
| 1-jaw (n = 71) |
2-jaw (n = 133) |
1-jaw (n = 71) |
2-jaw (n = 133) |
|||
| Soft-tissue A-point | 0.86 | 0.92 | 0.517 | 1.05 | 1.19 | 0.265 |
| Superior labial sulcus | 0.85 | 1.03 | 0.059 | 1.50 | 1.40 | 0.535 |
| Labrale superius | 1.02 | 1.23 | 0.072 | 1.38 | 1.35 | 0.828 |
| Upper lip | 1.07 | 1.28 | 0.092 | 1.37 | 1.32 | 0.698 |
| Stomion | 1.43 | 1.54 | 0.491 | 0.96 | 1.00 | 0.717 |
| Lower lip | 1.29 | 1.26 | 0.828 | 1.60 | 1.48 | 0.471 |
| Labrale inferius | 1.21 | 1.18 | 0.857 | 1.85 | 1.58 | 0.196 |
| Soft-tissue B-point | 1.14 | 1.26 | 0.346 | 1.93 | 1.92 | 0.962 |
| Protuberance menti | 1.17 | 1.23 | 0.649 | 1.79 | 2.05 | 0.258 |
| Pogonion | 1.36 | 1.33 | 0.822 | 2.08 | 2.45 | 0.208 |
| Gnathion | 1.92 | 1.74 | 0.401 | 1.69 | 1.58 | 0.625 |
| Menton | 3.96 | 4.16 | 0.692 | 1.61 | 1.45 | 0.390 |
Stay updated, free dental videos. Join our Telegram channel
VIDEdental - Online dental courses


