Introduction
Our objective was to evaluate the relationship between subjective classification of dental-arch shape, objective analyses via arch-width measurements, and the fitting with the fourth-order polynomial equation.
Methods
Twenty-seven pretreatment mandibular dental casts (from 13 males and 14 females; ages, 12-31 years) were selected. Standardized photographs of the arches were serially organized from tapered to square by 10 examiners. The mean position in the ranking of each cast was calculated as a rank of each arch form. The dental casts were analyzed with a 3-dimensional laser scanning system. Dental-arch widths at the canines and molars were measured, and then a fourth-order polynomial equation was fit to each arch. Correlations between the rank of arch shape and the objective measurements were statistically tested.
Results
The arch forms having the greatest variations among the examiners were those with an intermediate (ovoid) ranking. Statistically significant correlations were found between the ranks of arch shape, arch dimensions, and the polynomial equation analyses.
Conclusions
Subjective clinical assessments were generally in agreement at the extremes of tapered and square arch forms; the exceptions were arches with an ovoid shape. There were statistically significant correlations between subjective dental-arch classifications and dental-arch dimensions, as well as the ratio determined from these variables and polynomial equation analyses. Therefore, fourth-order polynomial equations might be an important factor in the quantitative analysis of dental-arch form in orthodontic patients.
One goal of orthodontic treatment is to create an individualized dental arch that is ideal for the patient. The original dental-arch form of the patient is mimicked to achieve stable treatment results because an arch form that has been orthodontically modified has a tendency to return to its original width. Therefore, reliable evaluation and accurate analysis of the patient’s pretreatment dental-arch form are essential steps for orthodontic diagnosis.
In general, subjective classification methods with 3 or 5 simple shape categories have been commonly applied to evaluate the initial dental-arch form during the orthodontic diagnostic process. For example, the subjective classification method, which uses 3 recommended shapes of tapered, ovoid, and square forms, has been widely used in the clinic to select prefabricated orthodontic archwires for a specific patient.
However, general human error can be expected in subjective analysis; therefore, the intraoperator and interoperator reproducibility of these evaluations might be inaccurate. Additionally, although a mathematical definition of these square, ovoid, and tapered dental-arch forms has been proposed, clinical application of this evaluation method for computer analysis is still rather limited.
Another common analysis of the dental-arch form is measuring canine and molar widths for clinical and research purposes. These transverse dimensions are usually measured at the cusp tips or other anatomic structures of the tooth crown. One considerable advantage of this method is the numeric analysis of the dental-arch form. Additionally, determination of the canine-molar width ratio has been also used as a simple quantification method and has been widely used in a clinical setting.
In comparison, objective numeric analysis methods, which use particular geometric and mathematical models, have been developed to quantitatively describe the dental-arch forms of orthodontic patients. For instance, a parabola or second-order polynomial, beta function, cubic spline function, and fourth-order or larger polynomial equations have all been applied. Recently, AlHarbi et al compared these functions and concluded that the fourth-order polynomial function (y = ax 4 + bx 3 + cx 2 + dx + e) was the most reasonable equation for analysis when the objective was to describe the general smooth curvature of the dental arch.
Application of fourth-order polynomials to represent the dental-arch form has several advantages for dental-arch form analysis. According to Lu, 1 advantage of the fourth-order polynomial curve-fitting method is that the coefficients of each term can be simply associated with specific aspects of the arch form. The coefficients of the fourth (x 4 or quartic) and second (x 2 or quadratic) terms describe the square and tapered shapes of dental-arch forms, respectively. Although a large fourth-order coefficient “a” indicates a square arch form, a large second-order coefficient “c” describes a tapered arch form. Consequently, the fourth-order polynomial equation has been applied extensively on the basis of this hypothesis. For example, Hayama et al evaluated the relationship between maxillary and mandibular dental-arch forms and found statistically significant positive correlations for all coefficients. Richards et al applied the fourth-order polynomial equation to analyze the correlation between twin subjects and concluded that this equation can accurately represent dental-arch shape. Additionally, Ferrario et al investigated dental-arch size differences between the sexes using this equation. However, little research has been conducted to compare the mathematical description of the dental-arch form with the subjective evaluations and the objective width measurements made by clinicians as orthodontic diagnostic tools.
The purpose of this study was to evaluate the relationship between the results of both a subjective classification by human judgment and 2 objective analytic methods by using dental-arch dimension measurements and the fourth-order polynomial equation for analysis of the dental-arch form of orthodontic patients.
Material and methods
A total of 27 pretreatment casts from 13 male and 14 female subjects, ranging in age from 12 to 31 years (mean age, 16.5 ± 5.0 years), were selected from 720 records at the Harvard School of Dental Medicine Teaching Clinic in Boston, Mass. The following inclusion criteria were required: (1) complete dentition, excluding third molars; (2) no prosthetic crowns and minimal restorations; (3) minimal signs of occlusal attrition; and (4) minimal spacing. Subjects with severe crowding (>10 mm) and transposed teeth were excluded from the analysis.
This sample size was first analyzed and determined to provide an adequate statistical power (80%, β = 0.2) for detection of a correlation coefficient of 0.5 for α = 0.05 and 0.6 for α = 0.01.
All selected subjects signed informed consent forms granting permission for their records to be used in research. A detailed protocol of this project was approved by the Committee on Human Studies of Harvard Medical School and Harvard School of Dental Medicine (X040501-1).
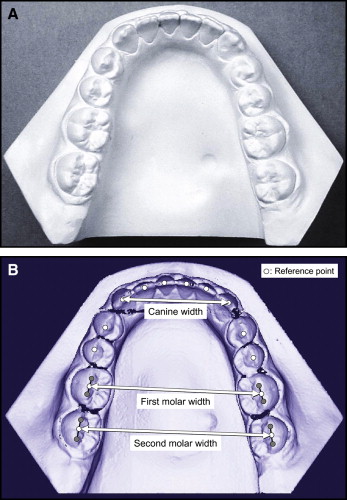
Standardized occlusal photographs of the mandibular dental casts of the 27 mandibular arches were taken with a digital camera (DSC-F55V, Sony, Japan) and printed in actual size ( Fig 1 , A ). Photographs of the mandibular dental arches were organized in a series from tapered to square shapes by 10 members of the Department of Orthodontics (5 teaching staff members and 5 fourth-year and third-year residents) from the Department of Growth and Development, Harvard School of Dental Medicine, Boston, Mass, and Department of Orthodontics, Nippon Dental University, Tokyo, Japan. Each examiner evaluated the 27 dental arches and ranked them from most tapered (1) to most square (27). The average rank given to a particular cast by all 10 examiners was determined to generate a mean rank for the dental arch. The standard deviation of the mean rank was also calculated for each dental arch. For example, a dental cast photograph ranked as most tapered (1) by 7 examiners and the second most tapered (2) by the other 3 examiners would receive an overall mean rank of 1.3 ± 0.5. This dental arch was then placed into the shape continuum near the most tapered side. The examiners were asked to judge the dental-arch form using their usual clinical evaluation method, and no discussion or calibration sessions occurred before the evaluations.
The dental casts were also scanned and analyzed with a 3-dimensional dental cast-measuring system. This system consisted of a laser-scanning unit (Surflacer VMS- 100F/ UNISN, Osaka, Japan) and a computer-aided design (CAD) software program (Surfacer version 9.0. Imageware Inc., Ann Arbor, Mich).
The reference points digitized on the image of each cast were the midpoints of the incisal edges, the canine cusp tips, and the buccal cusps of the premolars and the first and second molars ( Fig 1 , B ). The midpoint between the mesiobuccal and distobuccal cusp tips of the first and second molars was then computed and used to define the molar position. Only 1 point was used for each molar to eliminate the effects of rotation, resulting in a single point for the position of the tooth.
X and y coordinate data were extracted, and the distances between bilateral reference points for the canines and the first and second molars were calculated as canine width, first molar width, and second molar width, respectively. The canine-first molar and canine-second molar ratios (percentages) were also calculated. Then the means and standard deviations of canine width, first molar width, second molar width, canine-first molar ratio, and canine-second molar ratio were calculated.
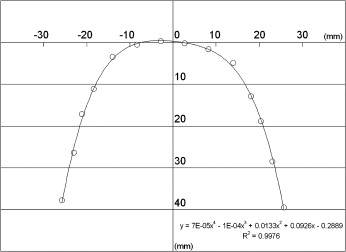
Additionally, these coordinate sets were used to fit a fourth-order polynomial equation (y = ax 4 + bx 3 + cx 2 + dx + e) to the 14 reference points for a dental arch by using the least squares method ( Fig 2 ). Then, the coefficients of fourth-order and second-order terms (“a” and “c,” respectively) could be determined from this equation for each dental arch. The means and standard deviations of the “a” and “c” terms were also calculated.
The nonparametric Spearman rank correlations (r s ) between the mean rankings of the dental-arch forms, the canine and molar widths and ratios, and the “a” and “c” coefficients derived from the equations were statistically analyzed. The Pearson correlation coefficients (r) between the dental-arch width and ratios, as well as the “a” and “c” terms, were also calculated and statistically analyzed with the Fisher z-transformation.
Two statistical analysis methods for correlations were used in this research: (1) the nonparametric Spearman rank correlation to rank data and (2) the Pearson coefficient of correlation for continuous data.
To evaluate the reliability of the dental-arch form ranking, photographs of 10 casts were randomly selected from the sample. These standardized photographs were ranked twice from tapered to square shapes by the same examiner (K.A.), with an interval of 2 weeks between evaluations, to determine intraexaminer reliability. The same determination was made once by another examiner (L.A.W.) to evaluate interexaminer reliability. Nonparametric Spearman rank correlations of intraexaminer and interexaminer reliability were 0.71 ( P = 0.03) and 0.93 ( P <0.01), respectively.
To evaluate the reliability of landmark location, 10 dental casts were randomly selected from the sample. The following 10 reference points were determined: incisal edges of the central incisors, canine cusp tips, buccal cusp tips of the first premolars, and mesial and distal buccal cusp tips of the first molar on the left side of the dental arch. The same examiner (K.A.) determined 100 reference points in duplicate to evaluate intraexaminer reliability, with 2 weeks between evaluations. The same determination was made once by another examiner (L.A.W.) to evaluate interexaminer reliability. The mean differences between the 2 determinations by the same examiner were 0.21 mm (SD, 0.21 mm) in the sagittal plane and 0.17 mm (SD, 0.19 mm) in the transverse plane. The mean differences between the 2 examiners were 0.19 mm (SD, 0.22 mm) in the sagittal plane and 0.21 mm (SD, 0.19 mm) in the transverse plane.
Results
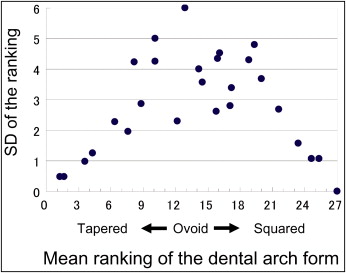
The correlations between the means and standard deviations of the subjective evaluation rankings for all dental-arch forms are shown in Figure 3 . The dental-arch forms ranked as most tapered or most square had small standard deviations, and interexaminer agreement among examiners was obtained. In contrast, the arch forms exhibiting relatively greater standard deviations, indicating interexaminer variation in the evaluation, were those with an intermediate ranking (ovoid arch form).
Statistically significant positive correlations were found between the mean rankings of the dental-arch forms, the widths and ratios of the canine and the first and second molars, and the fourth-order term “a” of the equation. Statistically significant negative correlations were found between the mean rankings, the canine-molar ratios, and the second-order term “c” of the equation ( Table I ). The highest statistically significant positive correlation was observed between the mean rank and canine width. In contrast, the highest negative correlation was obtained between the mean rank and the second-order term “c” ( Table I ).
| Canine width (mm) | First molar width (mm) | Canine-firstmolar ratio (%) | Second molar width (mm) | Canine-second molar ratio (%) | Fourth-order term “a” | Second-order term “c” | |
|---|---|---|---|---|---|---|---|
| Mean | 25.98 | 45.55 | 60.67 | 50.50 | 51.44 | 4.942E-05 | 0.030 |
| SD | 3.02 | 3.49 | 6.37 | 3.45 | 4.77 | 2.649E-05 | 0.019 |
| r s | 0.820 | 0.582 | −0.535 | 0.445 | −0.651 | 0.656 | −0.840 |
| Z-transformation | 4.183 | 2.969 | −2.728 | 2.269 | 3.318 | 3.344 | −4.283 |
| P value | <0.0001 † | 0.0030 † | 0.0064 † | 0.0233 ∗ | 0.0009 † | 0.0008 † | <0.0001 † |
Stay updated, free dental videos. Join our Telegram channel
VIDEdental - Online dental courses


