Introduction
The objective of this study was to compare skeletal maturation in obese patients and in subjects of normal weight to evaluate the best timing for orthopedic and orthodontic treatment. The null hypothesis was that obese and normal-weight patients show similar degrees of skeletal maturation.
Methods
The sample for this retrospective study consisted of 50 white patients (28 boys, 22 girls) whose x-rays (hand-wrist and lateral cephalometric radiographs) were already available. The test group included 25 obese patients (11 girls, 14 boys; average age, 9.8 ± 2.11 years), and the control group included 25 subjects of normal weight (11 girls, 14 boys; average age, 9.9 ± 2.5 years). Skeletal maturation was determined by using the carpal analysis method and the cervical vertebral maturation method.
Results
According to the carpal analysis, there was a significant difference between skeletal and chronologic ages between the test group (11.8 ± 11.4 months) and the control group (–2.9 ± 3.1 months). Furthermore, the obese subjects exhibited a significantly higher mean cervical vertebral maturation score (2.8 ± 0.7) than did the control subjects (2 ± 0.6) ( P <0.05).
Conclusions
Compared with the normal-weight subjects, the obese subjects showed a higher mean discrepancy between skeletal and chronologic ages according to the carpal analysis and had a significantly higher cervical vertebral maturation score. Thus, to account for the growth in obese patients with skeletal discrepancies, it might be necessary to perform examinations and dentofacial and orthopedic treatments earlier than in normal-weight subjects.
Infantile obesity is a pathology that is generating greater interest because of its widespread growth in industrialized countries. Since the 1990s, obesity has been regarded as one of the most serious public health and medical problems of our time. The main causes of obesity are large consumption of high-calorie foods and lack of physical activity; however, obesity can also be the result of genetic conditions, hormone dysfunctions, or even mental disorders.
It is possible to distinguish 2 types of obesity: primary and secondary. Primary obesity is caused by an imbalance between food intake and energy expenditure. Secondary obesity is linked to endocrine and genetic pathologies, such as Cushing’s syndrome, hyperthyroidism, insulinoma, Stein-Leventhal syndrome, and endocrine hypothalamic disorders. Clinically, the subject’s stature is an important element differentiating the 2 types of obesity. Subjects suffering from primary obesity usually have tall or normal heights, whereas subjects affected by secondary obesity are usually characterized by shorter heights, delayed growth, and dysmorphisms.
Genetic factors are an etiologic basis for obesity. Certain monogenic forms of obesity are characterized by defective genes that encode molecules involved in the hypothalamic regulation of energetic balance. Also, epigenetic factors play an important role in activating and silencing genes that have their most critical, although not exclusive, expression during the prenatal period and the first few months of a child’s life.
The etiologic theory that tries to explain the onset of obesity from a genetic point of view is based on the adipostat concept. In other words, an organism has an internal set point that can recognize the amount of adipose deposits and consequently regulate calorie consumption to prevent buildup. Control over an organism’s energetic balance is associated with a complex of messenger molecules that connect the hypophysis and the entire endocrine system with the hepatocytes, adipocytes, and muscles. Alterations in this hierarchy can cause a buildup of fat.
The consequences of obesity are numerous and include metabolic complications, such as diabetes mellitus, hypertension, dyslipidemia, liver disorders, tooth disorders, and nonalcoholic steatohepatitis; mechanical dysfunctions, such as obstructive sleep apnea; and psychological problems.
Furthermore, it has been suggested that early-onset obesity can cause increases in vertebral bone density and bone size, and an acceleration of skeletal growth. In particular, obesity has been hypothesized to impact craniofacial growth and lead to more precocious skeletal maturation of the maxilla and the mandible.
The level of body fat can influence the neuroendocrine events that are responsible for the onset of precocious puberty despite low levels of growth hormone. More specifically, leptin, a hormone mainly produced by white adipose tissue to control appetite and the buildup of adipose tissue reserves, might be directly involved in this process. Leptin accelerates the production of gonadotropin-releasing hormone by the hypothalamus and affects the adenohypophysis, promoting accelerated pubertal development. Moreover, leptin has been hypothesized to act directly at the level of skeletal growth centers by inducing chondrocyte differentiation and proliferation. In addition, some effects on bone growth might be mediated by other hormones, such as insulin-like growth factor 1, a hormone similar in structure to insulin that is produced in hepatocytes, fibroblasts, and chondrocytes.
The biologic aspects of facial skeletal growth are fundamentally important to dentofacial orthopedics. Knowledge of the remaining facial growth potential is essential for correct diagnosis and therapy. Treatment timing can influence therapeutic outcomes aimed to produce orthopedic effects in the craniofacial structures. In particular, the optimal treatment timing for Class II skeletal disharmony with functional appliances is during or slightly after the peak in mandibular growth, because the skeletal responses decrease both before and after maximal pubertal growth. For these reasons, the operator should consider alterations in skeletal maturity when performing orthodontic or orthopedic treatments during the deciduous or mixed dentition period to optimize the therapeutic outcomes.
Carpal analysis is a common method used to determine skeletal age. The relationship between chronologic age and skeletal age is called the carpal index. Various methods are used to determine the carpal index. One of the most popular approaches is the Greulich and Pyle method, which consists of a series of standard x-rays (31 for boys, 29 for girls). The x-rays are carried out in chronologic steps that increase gradually from the prenatal stage up to the ages of 19 years in boys and 18 years in girls. These x-rays cover all the phalanx bones of the hand, including the diaphysis and forearm bone. Each x-ray belongs to a subject of a particular age that is characterized by a specific ossification stage. To determine the skeletal age, the x-ray of the carpus must be compared with the corresponding x-ray in the atlas provided by Greulich and Pyle.
Measuring cervical vertebral maturation from lateral cephalometric radiographs is an alternative to the hand-wrist analysis, and it has proven to be an effective way to assess the adolescent growth peak in both body height and mandibular size. One advantage of using the cervical vertebral maturation method is that a lateral radiograph is routinely required for orthodontic treatment planning. Therefore, no additional radiograph is generally required to use this method. Despite this advantage, the cervical vertebral maturation method is not sensitive enough to detect growth maturity outside the growth spurt period.
The objective of this study was to compare skeletal maturation in obese patients and normal-weight subjects. The null hypothesis was that obese and normal-weight subjects show similar degrees of skeletal maturation.
Material and methods
The sample for this retrospective pilot study consisted of 50 white patients (28 boys, 22 girls) whose x-rays (hand-wrist and lateral cephalometric radiographs) were already available. The subjects were randomly selected from the records at the Department of Paediatrics of the University of Pisa in Italy. The body adiposity status of each subject was evaluated, according to the International Obesity Task Force classification, to allocate the subjects to the test group or the control group: the mean body mass index standard deviations were 2.9 ± 6.6 in the test group and 0.1 ± 0.7 in the control group ( Table I ). The body mass index is used to assess weight status in children, adolescents, and adults. In adults, the body mass index cutoff points that define obesity and overweight are not linked to age and do not differ for men and women; however, in growing children, body mass index varies with age and sex. For these reasons, each body mass index value was matched to the corresponding percentile on the international charts according to the patient’s age and sex to calculate the standard deviation score of the patient’s body mass index. The body mass index standard deviation is based on pooled international data that link the accepted adult cutoff points (a body mass index of 25 kg/m 2 for overweight and 30 kg/m 2 for obese) to body mass index percentiles for children. This can be used to establish cutoff points related to the ages of children.
| Auxologic parameter | Mean and SD |
|---|---|
| Weight (kg) | |
| Obese | 56.8 ± 14.6 |
| Control | 33.6 ± 9.3 |
| Height (cm) | |
| Obese | 143.6 ± 12.5 |
| Control | 140 ± 16.1 |
| BMI SD (percentile) | |
| Obese | 2.9 ± 6.6 |
| Control | 0.1 ± 0.7 |
The test group included 25 obese patients (11 girls, 14 boys; average age, 9.8 ± 2.11 years), and the control group included 25 normal-weight subjects (11 girls, 14 boys; average age, 9.9 ± 2.5 years).
Subjects affected by systemic pathologies or taking medications that might have produced alterations in their growth were excluded from the study. The time between the hand-wrist and the lateral cephalometric radiographs did not exceed 1 month. In addition, the bone structures appeared clearly in the radiographs.
One operator (M.P.) determined the skeletal age in a blind test by comparing the hand-wrist radiographs with the Greulich and Pyle atlas published in 1959. After the skeletal age of each patient was determined, the difference between the skeletal and chronologic ages was evaluated to identify precocious skeletal maturation (positive differences) or delayed maturation (negative differences).
Moreover, the same researcher evaluated the cervical vertebral maturation using the method developed by Baccetti et al. This method visually analyzes the morphology of the 3 cervical vertebrae (C2, C3, C4) in terms of 2 parameters: (1) the presence or absence of concavity of the inferior borders of the C2 (odontoid process), C3, and C4; and (2) the differences in the shape of the cervical vertebral bodies with the progression of age, with 4 shapes considered—trapezoid, rectangular horizontal, square, and rectangular vertical.
The 2 variables were subdivided into 6 consecutive stages of cervical maturation: stage 1, flattened inferior border of the cervical bodies, and the bodies are trapezoid at the superior border; stage 2, a concavity appears at the inferior border of C2 (odontoid process) and increases the anterior vertical height of the bodies, and the bodies are rectangular horizontal in shape; stage 3, a significant concavity appears at the inferior border of C3; stage 4, a concavity appears at the inferior border of C4, and the bodies of all vertebrae are rectangular in shape; stage 5, the concavities are well defined at the inferior borders of all 6 cervical vertebrae, and the bodies are nearly square; and stage 6, there is increased depth in the concavities of all cervical vertebral bodies, and the bodies are rectangular vertical in shape, with no growth remaining.
Statistical analysis
The data were analyzed statistically. The Student t test for independent samples was used to evaluate the statistical significance of the differences for each analyzed parameter between the test and control groups. The significance of the single tests was evaluated by using the Levene exact test. The level of significance selected was P <0.05. Intraobserver variability was calculated by using Pearson’s correlation coefficient between measurements of all subjects with those in the same patients 3 weeks later. The coefficients obtained ranged between 0.99 and 0.97 ( P <0.05).
Results
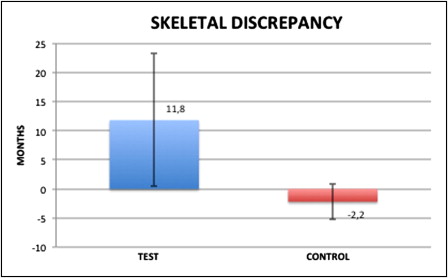
Carpal assessments with the Greulich and Pyle method showed that the skeletal age exceeded the chronologic age in 23 subjects (13 boys, 10 girls) and was the same in 2 subjects (1 girl, 1 boy) in the test group. In the control group, the skeletal age exceeded the chronologic age in 1 subject (a girl), was less than the chronologic age in 7 subjects (5 boys, 2 girls), and was the same in 17 subjects (9 boys, 8 girls). The subjects in the test group showed a mean precocious skeletal maturation of 11.8 ± 11.4 months. In contrast, the control subjects had a mean delayed skeletal maturation of 2.2 ± 3.1 months ( Fig ). There was a statistically significant difference ( P <0.05) in the discrepancy between skeletal age and chronologic age between the test and control groups. In the test group, there were positive discrepancies between the skeletal and chronologic ages of 11.6 ± 12.5 months in boys and 12 ± 10.5 months in girls. In the control group, there were negative mean discrepancies between the skeletal and chronologic ages of −2 ± 3 months in boys and −2.4 ± 3.2 months in girls. There were no statistically significant differences observed between the sexes.