Introduction
Many investigators have studied the cellular organization and the local and systemic factors regulating endochondral bone growth in the growth plate and condylar cartilage. Parathyroid hormone-related protein (PTHrP) and Indian hedgehog protein have been reported to regulate multiple steps during such skeletal morphogenesis. The aims of this study were to quantify serum PTHrP levels at 6 cervical vertebral stages and to correlate serum PTHrP levels to the 6 skeletal maturation stages for use as a biologic indicator of skeletal maturation.
Methods
Mean serum PTHrP levels were measured in 90 subjects categorized into 6 cervical vertebral stages.
Results
Mean serum PTHrP levels were significantly higher in the late pubertal stages than in the early pubertal stages. Pearson correlation showed that serum PTHrP levels had a positive correlation with cervical vertebral maturation stages from the prepubertal to the late pubertal stages, and a negative correlation from the late pubertal to the postpubertal stages.
Conclusions
Peak serum PTHrP levels do not correlate with early pubertal stages characterized by maximum growth increments. Hence, the validity of using serum PTHrP levels to predict peak growth velocity is questionable.
One objective of orthodontic treatment during adolescence in those with skeletal discrepancies is to take advantage of the patient’s residual growth status. It is assumed that through effective management of the growing craniofacial complex during adolescence, optimal results can be achieved within a relatively shorter period of treatment. Adolescence is a period during which the rate of growth accelerates, reaches a peak velocity, and then decelerates until adulthood is achieved. This pattern can be found in all subjects, but there are marked individual variations in the initiation, duration, rate, and amount of growth during this period of life.
Many investigators have shown that human development is best represented by the stages of skeletal maturation. Skeletal maturation refers to the degree of ossification in bones. During growth, every bone goes through a series of consistent changes that can be seen radiographically.
Fishman and Hägg and Taranger developed a system of skeletal maturation assessment based on a sequence of events at different anatomic sites on hand-wrist radiographs. Lamparski introduced a method that used the cervical vertebrae from lateral cephalometric radiographs to assess skeletal maturity, and this has been especially appealing to orthodontists. Baccetti et al used longitudinal data from the Michigan Growth Study and related the timing of peak mandibular growth to the 6 cervical vertebral stages by examining the second, third, and fourth cervical vertebrae.
Skeletal morphogenesis at the growth plate (highly organized cartilage structure), is a result of chondrocyte proliferation, differentiation, and endochondral ossification. It is regulated by many genetic, hormonal, and growth factors, as well as the environment and nutrition.
Stutzmann and Petrovic hypothesized and Rabie and Hägg established the orchestrated influence of various systemic and local factors in the regulation of craniofacial growth, reflecting a close association between growth factors and craniofacial growth.
Systemic factors include growth hormone, insulin-like growth factor (IGF-1), thyroid hormones, glucocorticoids, estrogen, and androgens such as testosterone. IGF-1 was discovered by Salmon and Daughaday as a mediator of growth hormone function and since then has been extensively studied and shown to play a principal role in systemic and local regulation of both prenatal and postnatal longitudinal bone growth. Masoud et al studied serum IGF-1 levels and correlated the values with various skeletal stages as determined by cephalometric radiographic techniques. They concluded that serum IGF-1 level could be used as a skeletal maturity indicator for detecting residual mandibular growth in humans. Juul et al in a cross sectional study found that mean serum IGF-1 levels increased slowly in prepubertal children from 80 to 200 μg per liter, with a further steep increase during puberty to approximately 500 μg per liter. After puberty, circulating IGF-1 levels continued to fall to approximately 250 μg per liter at age 25 years.
However, there is still a debate about the effect of IGF-I, IGF-II, and growth hormone on the growth plate chondrocytes and the somatotrophic axis in the regulation of longitudinal bone growth; it is still unclear to what extent local IGF-1 contributes to longitudinal bone growth. Furthermore, it was summarized that systemic hormones involved in the regulation of the growth plate exert their influence on the growth plate and condylar cartilage chondrocytes by influencing the expression or the activity of locally active growth factors, stressing the importance of local factors in orchestrating the skeletal morphogenesis at the growth plate.
Local factors involved in regulation of chondrocyte activity and subsequent endochondral bone growth include Indian hedgehog protein (Ihh); parathyroid hormone-related protein (PTHrP); FGF; BMPs; VEGF; Wnt5a; Wnt5b; SOX 5, 6, and 9; Runx2; HIF-1 alpha; RANKL; and OPG, of which the biochemical signaling pathway of PTHrP-Ihh is the best known system.
PTHrP, initially purified from a lung cancer cell line, has been identified as the primary mediator of humoral hypercalcemia of malignancy. PTHrP is translated as a preprohormone that is posttranslationally processed to yield a family of mature secretary hormones that subserve different biologic functions through autocrine, paracrine, and classic endocrine functions.
PTHrP and Ihh have been reported to regulate multiple steps in the development of the growth plate and the secondary cartilage at the head of the condyle during skeletal morphogenesis.
Kindblom et al reported increased levels of expression of Ihh and PTHrP in the early stages of puberty than in the later stages in the postnatal human growth plate. However, the relationship between circulating PTHrP levels and the various stages of circumpubertal development for skeletal maturation assessment has not been examined. A biologic indicator required for the appraisal of individual skeletal maturity and consequently for the detection of the pubertal growth spurt should satisfy the following criteria : (1) the method should have biologic validity in describing individual skeletal maturity, (2) the information provided should agree with that derived from a reliable indicator, and (3) it should be efficient in detecting the peak in mandibular growth.
Hence, we hypothesized that correlating serum PTHrP levels and the cervical vertebral maturation stages of Baccetti et al could establish the usefulness of serum PTHrP levels as biomarkers in assessing the various stages of the circumpubertal growth spurt period.
The purposes of this cross-sectional study were to assess the serum levels of PTHrP at different pubertal stages, to correlate the PTHrP levels to skeletal maturity by using the the cervical vertebral maturation stages of Baccetti et al, and to evaluate the viability of serum PTHrP levels as skeletal maturity indicators in regular orthodontic practice.
Material and methods
The sample size in this cross-sectional study consisted of 90 subjects who visited the Department of Orthodontics, Narayana Dental College, in Nellore, India. Male and female subjects between 5 and 20 years who were to begin treatment or were already being treated, and for whom lateral cephalograms were regularly taken, were included in the study. Patients were excluded if they had a growth abnormality, bleeding disorder, syndrome, endocrinal disturbance, or malignancy, or took long-term medication.
The study protocol was approved by the institutional ethical committee of Narayana Dental College (project number 28/62/10). Written informed consent was signed by each subject or his or her guardian in English as well as the patient’s local language after translation before continuing with the test procedures.
A power analysis established that a total sample of 90 subjects would give 80% power to detect a difference of 0.5 ng per milliliter in the mean serum PTHrP levels at the 6 cervical vertebral stages and to establish a correlation between the mean PTHrP serum levels and the 6 cervical vertebral maturation stages at the α = 0.05 level. Cervical staging of orthodontic patients satisfying the inclusion criteria was evaluated by 2 examiners (A.K.T., M.Z.H.) independently on their respective lateral cephalograms by using the modified cervical vertebral maturation method of Baccetti et al. After cervical vertebral maturation evaluation, 90 subjects selected for the study from the screened patients were grouped into 6 cervical stage (CS) groups of 15 per group. We matched the sex distribution between the groups ( Table I ). The mean (SD) ages of the subjects were 8.67 years (1.4) in the CS 1 group, 11 years (2.14) in the CS 2 group, 12.6 years (0.63) in the CS 3 group, 14.13 years (0.52) in the CS 4 group, 15 years (0.85) in the CS 5 group, and 18.33 years (0.9) in the CS 6 group ( Table II ).
| Cervical vertebral stage | Male | Female |
|---|---|---|
| CS 1 | 8 | 7 |
| CS 2 | 8 | 7 |
| CS 3 | 8 | 7 |
| CS 4 | 7 | 8 |
| CS 5 | 8 | 7 |
| CS 6 | 8 | 7 |
| CS 1 | CS 2 | CS 3 | CS 4 | CS 5 | CS 6 | |
|---|---|---|---|---|---|---|
| Mean (y) | 8.67 | 11.00 | 12.60 | 14.13 | 15.00 | 18.33 |
| SD (y) | 1.40 | 2.14 | 0.63 | 0.52 | 0.85 | 0.90 |
The kappa statistic was used to measure interexaminer and intraexaminer reliability at 0.794 and 0.824, respectively. There was no statistically significant difference between the examiners’ readings. Both examiners staged all x-rays, and, if there was disagreement, they were recalibrated regarding the stages in conflict; then the films were reviewed and remeasured by both examiners until consensus was reached.
Three milliliters of blood was collected from the median cubital vein through venipuncture, and the samples from all 90 subjects were stored in vials. Each sample from the vial was subjected to centrifugation to segregate the serum. The serum was stored at −20°C to ensure the stability of the serum and subjected to an enzyme-linked immunosorbant assay test (ELISA) to measure the serum PTHrP levels (WKEA Med Supplies, Changchun, China). The minimal level of detection is 0.5 ng per milliliter, and the normal assay range is 0.5-15 ng per milliliter.
Statistical analysis
The statistical analysis was executed by means of GraphPad Prism software (version 4; Sigma Software Distribution, Ashburton, Devon, United Kingdom). Continuous data were presented as means, medians, ranges, and standard deviations. Between-group analyses was carried out by using analysis of variance (ANOVA). If the P value in ANOVA was less than 0.05, post hoc Bonferroni analysis was performed to detect differences between the 2 groups. The Pearson correlation test was done to study the relationship between mean serum PTHrP levels and the various cervical stages, and the relationship between age and mean serum PTHrP levels in each cervical stage.
Results
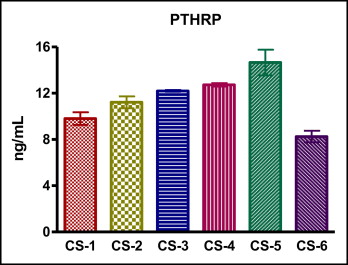
Mean (SD) values of serum PTHrP were 9.8 (0.5) ng per milliliter in the CS 1 group, 11.2 (0.5) ng per milliliter in the CS 2 group, 12.2 (0.1) ng per milliliter in the CS 3 group, 12.7 (0.1) ng per milliliter in the CS 4 group, 14.7 (1.1) ng per milliliter in the CS 5 group, and 8.3 (0.5) ng per milliliter in the CS 6 group ( Table III ). The serum PTHrP values increased progressively from CS 1 to CS 5. However, there was a sudden decline in CS 6, with the values comparatively less than those at CS 1. The Figure shows the mean serum PTHrP levels and 95% confidence intervals plotted against the cervical stages.
| CS 1 | CS 2 | CS 3 | CS 4 | CS 5 | CS 6 | |
|---|---|---|---|---|---|---|
| n | 15 | 15 | 15 | 15 | 15 | 15 |
| Mean | 9.8 | 11.2 | 12.2 | 12.7 | 14.7 | 8.3 |
| SD | 0.5 | 0.5 | 0.1 | 0.1 | 1.1 | 0.5 |
| Median | 9.7 | 11.3 | 12.2 | 12.8 | 14.5 | 8.3 |
| Maximum | 10.8 | 11.9 | 12.3 | 12.9 | 18.2 | 9.1 |
| Minimum | 9.1 | 10.2 | 12.1 | 12.5 | 13.4 | 7.4 |
One-way ANOVA post hoc Bonferroni analysis showed that mean serum PTHrP levels at CS 5 were significantly greater than the corresponding values at CS 1, CS 2, CS 3, CS 4, and CS 6 ( P <0.001), and there was an insignificant difference between the PTHrP levels at CS 3 and CS 4 ( Table IV ).
| Bonferroni multiple comparison test for PTHrP | Mean difference between 2 groups | P value |
|---|---|---|
| CS 1 vs CS 2 | −1.40 | <0.001 |
| CS 1 vs CS 3 | −2.39 | <0.001 |
| CS 1 vs CS 4 | −2.92 | <0.001 |
| CS 1 vs CS 5 | −4.84 | <0.001 |
| CS 1 vs CS 6 | 1.55 | <0.001 |
| CS 2 vs CS 3 | −0.98 | <0.001 |
| CS 2 vs CS 4 | −1.51 | <0.001 |
| CS 2 vs CS 5 | −3.44 | <0.001 |
| CS 2 vs CS 6 | 2.96 | <0.001 |
| CS 3 vs CS 4 | −0.52 | >0.05 |
| CS 3 vs CS 5 | −2.45 | <0.001 |
| CS 3 vs CS 6 | 3.94 | <0.001 |
| CS 4 vs CS 5 | −1.92 | <0.001 |
| CS 4 vs CS 6 | 4.47 | <0.001 |
| CS 5 vs CS 6 | 6.4 | <0.001 |
Stay updated, free dental videos. Join our Telegram channel
VIDEdental - Online dental courses


