Introduction
Our objective was to investigate potential associations between maxillary sinus floor extension and inclination of maxillary second premolars and second molars in patients with Class II Division 1 malocclusion whose orthodontic treatment included maxillary first molar extractions.
Methods
The records of 37 patients (18 boys, 19 girls; mean age, 13.2 years; SD, 1.62 years) treated between 1998 and 2004 by 1 orthodontist with full Begg appliances were used in this study. Inclusion criteria were white patients with Class II Division 1 malocclusion, sagittal overjet of ≥4 mm, treatment plan including extraction of the maxillary first permanent molars, no missing teeth, and no agenesis. Maxillary posterior tooth inclination and lower maxillary sinus area in relation to the palatal plane were measured on lateral cephalograms at 3 time points: at the start and end of treatment, and on average 2.5 years posttreatment. Data were analyzed for the second premolar and second molar inclinations by using mixed linear models.
Results
The analysis showed that the second molar inclination angle decreased by 7° after orthodontic treatment, compared with pretreatment values, and by 11.5° at the latest follow-up, compared with pretreatment. There was evidence that maxillary sinus volume was negatively correlated with second molar inclination angle; the greater the volume, the smaller the inclination angle. For premolars, inclination increased by 15.4° after orthodontic treatment compared with pretreatment, and by 8.1° at the latest follow-up compared with baseline. The volume of the maxillary sinus was not associated with premolar inclination.
Conclusions
We found evidence of an association between maxillary second molar inclination and surface area of the lower sinus in patients treated with maxillary first molar extractions. Clinicians who undertake such an extraction scheme in Class II patients should be aware of this potential association and consider appropriate biomechanics to control root uprighting.
The maxillary sinus, the largest of the paranasal sinuses, begins to develop at the ethmoidal infundibulum in the third month of fetal life. After birth, it undergoes rapid growth, extending both laterally and inferiorly, during the first 3 years and from 7 to 12 years of age. In approximately 50% of the adult population, the sinus invades the maxillary alveolar process, coming in close proximity to the roots of the second premolar and the first and second permanent molars. Occasionally, the sinus floor can extend as far as the region of the canine root. Tooth roots that protrude into the maxillary sinus can cause complications in extractions, implantation, endondontic procedures, and orthodontic mechanics.
Orthodontic intrusion and bodily movement of teeth across the sinus floor have been found to cause moderate apical root resorption and variable degrees of tipping in experimental and clinical studies. To date, the interaction of maxillary sinus development and posterior tooth axial inclinations has not been assessed longitudinally in orthodontic patients. Therefore, the aim of this cephalometric study was to investigate the possible association between maxillary sinus extent and the inclinations of the maxillary second molars and second premolars in Class II adolescents before and after active orthodontic treatment with extraction of maxillary first molars.
Material and methods
The records of 37 patients (18 boys, 19 girls; mean age, 13.2 years; SD, 1.62 years) treated between 1998 and 2004 with extraction of the maxillary first permanent molars and full Begg appliances in 1 orthodontist practice were collected. They represented a subsample from a prospective clinical study with the following inclusion criteria: white patient, Class II Division 1 malocclusion, sagittal overjet ≥4 mm, no missing teeth, or no agenesis, including maxillary third molars. Standardized lateral cephalograms before and after treatment, and for an average follow-up period of 2.5 years were evaluated by 1 author (C.L.).
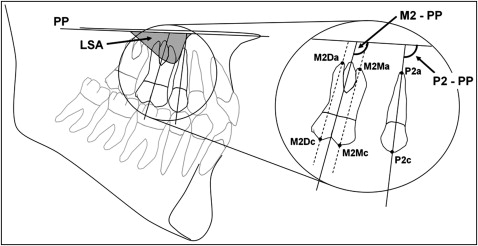
The scanning and digitization of all available lateral headfilms were carried out with cephalometric analysis software (Viewbox 3.0; dHAL Software, Kifissia, Greece). Preselected anatomic and dental landmarks were digitized to enable the calculation of the maxillary second premolar (P2) and second molar (M2) inclinations, and lower sinus area (LSA) in relation to the palatal plane (PP). These measurements were defined as follows ( Fig 1 ): P2-PP, the angle between the long axis of P2 and the PP; M2-PP, the average of the angles constructed by lines crossing the mesiobuccal and distobuccal root apexes and the respective occlusal cusps, and PP; and LSA, the area established by the outline of the inferior wall of the sinus and PP.
To assess intraexaminer reliability, 30 randomly selected cephalograms were retraced and remeasured by the same investigator after a 2-week interval.
Statistical analysis
Summary values (means, standard deviations) were calculated for age, M2-PP, P2-PP, and LSA for the 3 time points. The effects on tooth inclination, age, and lower sinus size on the 3 points (before and after treatment, and at follow-up) were investigated by using multilevel modeling, where level 1 was the 3 time points and level 2 was the patients. Multilevel modeling allows for the correlated nature of the data resulting from multiple measurements in the same patients to be considered during the analysis. Statistical significance was set at 5%. All analyses were undertaken by using a statistical software package (version 12.1; StataCorp, College Station, Tex).
Results
Random errors, calculated according to the method of Houston, were 1.08°, 1.48°, and 21.69 mm 2 for P2, M2, and LSA, respectively. Paired t tests on the repeated tracings showed no systematic errors ( P >0.05).
Table I displays mean values and standard deviations for age, M2-PP, P2-PP, and LSA by sex and for the 3 time points.
| T0 mean (SD) | T1 mean (SD) | T2 mean (SD) | T1-T0 mean (SD) | T2-T1 mean (SD) | |
|---|---|---|---|---|---|
| Boys (n = 18) | |||||
| Age (y) | 13.2 (1.3) | 16.1 (1.5) | 18.6 (1.5) | ||
| M2-PP (°) | 112.3 (5.1) | 101.1 (5.4) | 96.5 (3.5) | −11.2 (4.7) | −4.6 (3.3) |
| P2-PP (°) | 98.4 (5.0) | 106.2 (4.0) | 103.8 (3.8) | 7.8 (4.0) | −2.4 (3.0) |
| LSA (mm 2 ) | 48.7 (38.6) | 91.6 (33.3) | 108.4 (40.1) | 42.9 (35.1) | 16.8 (14.3) |
| Girls (n = 19) | |||||
| Age (y) | 13.2 (1.9) | 15.6 (2.1) | 18.1 (2.2) | ||
| M2-PP (°) | 112.4 (4.5) | 101.0 (5.5) | 97.1 (5.6) | −11.4 (5.8) | −3.9 (4.3) |
| P2-PP (°) | 97.4 (5.1) | 106.9 (6.1) | 103.7 (5.4) | 9.5 (6.5) | −3.2 (3.3) |
| LSA (mm 2 ) | 62.0 (43.7) | 100.5 (43.5) | 123.0 (47.3) | 38.5 (26.6) | 22.5 (18.5) |
Table II shows the results of the statistical analyses for M2 and P2. Figure 2 displays individual trends for M2 and P2 inclinations at the 3 time points (T0-T2).
| M2 | P2 | |||||
|---|---|---|---|---|---|---|
| β | 95% CI | P value | β | 95% CI | P value | |
| Fixed effects | ||||||
| Time | ||||||
| T0-T1 | −7.02 | −19.64 to 5.59 | 0.28 | 15.43 | 2.45 to 28.41 | 0.02 |
| T1-T2 | −11.52 | −25.46 to 2.42 | 0.11 | 8.09 | −6.32 to 22.49 | 0.27 |
| Male | 0.22 | −1.85 to 2.29 | 0.83 | 0.30 | −2.27 to 2.87 | 0.82 |
| Age_T0 | −0.94 | −1.73 to −0.15 | 0.02 | −0.27 | −1.15 to 0.61 | 0.54 |
| Age_T1 | −0.69 | −1.41 to 0.03 | 0.06 | −0.70 | −1.50 to 0.10 | 0.09 |
| Age_T2 | −0.62 | −1.30 to 0.07 | 0.08 | −0.39 | −1.15 to 0.37 | 0.32 |
| LSA_T0 | −0.01 | −0.03 to 0.01 | 0.54 | 0.00 | −0.02 to 0.03 | 0.84 |
| LSA_T1 | −0.05 | −0.08 to −0.03 | 0.00 | 0.01 | −0.02 to 0.03 | 0.55 |
| LSA_T2 | −0.04 | −0.07 to −0.02 | 0.00 | 0.01 | −0.02 to 0.04 | 0.43 |
| _cons∗ | 125.12 | 114.66 to 135.58 | 0.00 | 101.16 | 89.53 to 112.79 | 0.00 |
| Random effects | ||||||
| Level 2 (subjects) | 2.62 | 0.47 | 3.50 | 0.54 | ||
| Level 1 (residuals) | 3.16 | 0.26 | 3.24 | 0.27 | ||
Specifically for molars, the inclination angles decreased by 7° from before to after treatment, and by 11.5° at the latest follow-up. The difference in baseline angles between boys and girls was small (0.22°; P = 0.83). Age had a negative relationship to the inclination angles: ie, older children tended to have smaller inclination angles. The volume of the maxillary sinus had a negative association with the inclination angles at each time point, and those associations were statistically significant before and after treatment. This suggests that the greater the volume, the smaller the inclination angles.
For premolars, the inclination angles increased by 15.4° after active treatment compared with baseline angles, and by 8.1° at posttreatment. The difference in baseline angles between boys and girls was small (0.3°; P = 0.82).
Age also had a negative relationship to premolar inclination angles, meaning that older patients had smaller premolar angles. However, no association was statistically significant. The volume of the maxillary sinus did not seem to be associated with premolar axial inclination.
The higher level in the multilevel models was patients whose number was 37, and each patient had 3 repeated observations (the lower level). These are usually sufficient to estimate the random effects at both levels, and Table II shows that the standard errors for the random effects in both models are relatively small, indicating that the random-effects estimation is robust.
Stay updated, free dental videos. Join our Telegram channel
VIDEdental - Online dental courses


