Proper sample size estimation is an important part of clinical trial methodology and closely related to the precision and power of the trial’s results. Trials with sufficient sample sizes are scientifically and ethically justified and more credible compared with trials with insufficient sizes. Planning clinical trials with inadequate sample sizes might be considered as a waste of time and resources, as well as unethical, since patients might be enrolled in a study in which the expected results will not be trusted and are unlikely to have an impact on clinical practice. Because of the low emphasis of sample size calculation in clinical trials in orthodontics, it is the objective of this article to introduce the orthodontic clinician to the importance and the general principles of sample size calculations for randomized controlled trials to serve as guidance for study designs and as a tool for quality assessment when reviewing published clinical trials in our specialty. Examples of calculations are shown for 2-arm parallel trials applicable to orthodontics. The working examples are analyzed, and the implications of design or inherent complexities in each category are discussed.
Clinical trials in orthodontics aim to assess prospectively associations between treatment interventions and outcomes, and to determine which is the better intervention for the desired outcome. For example, failure rates of brackets bonded with different composites, survival of different types of lingual retainers over several years, treatment efficiency of bracket systems, effectiveness of various functional appliances, and combinations of treatments with fixed and removable appliance can be compared.
It is important that a certain methodology is followed so that the trial possesses what is called in clinical trial language “internal validity” and produces precise results. Some important aspects of internal validity or methodologic quality are randomization, blinding, and reduction of loss to follow-up. Additionally, for the results to be credible, it is necessary to have enough participants in the trial to have a good chance of detecting a clinically important treatment difference if there is one, or to conclude with reasonable confidence that there is no difference if the results do not show it. Often, trials fail to show an effect of a particular intervention, even when an effect exists, because of the small size of the trial; this leads to low power, and, as it has been argued, “absence of evidence is no evidence of absence.”
Every clinical trial should have good power, and there is a close relationship between power and sample size. Usually, as the sample size increases, study power is also expected to increase; however, a balance between power, a clinically important difference, trial feasibility, and credibility is required.
It has been reported that in medical and dental journals reporting for sample size calculation is suboptimal. Because of the low emphasis on sample size calculation in dental medicine, it is our objective to introduce the orthodontic clinician to the importance and the general principles of sample size calculations for clinical trials as guidance for study designs and as a tool for quality assessment when reviewing published clinical trials in our specialty. This article is by no means exhaustive. It focuses on trial designs applicable to orthodontics and presents sample size calculations with only proportions or means. Sample calculations with risk, odds, and hazard ratios are not included.
The key factors for sample size determination will be introduced, and then sample size calculations with examples of common trial designs used in orthodontic research will be presented.
Key factors in determining sample size
Before we proceed with sample calculations we must define the following : (1) the research question, (2) the principal outcome measure of the trial (ie, continuous or categorical), (3) the type of analysis and study design that will be used, (4) the expected proportion or mean value of the selected outcome in the comparison or control group, (5) the minimum clinically important difference between treatment arms that we would like to detect, (6) the variance (for continuous outcomes), and (7) the significance level (α) and the degree of certainty (β) that we want to detect for the treatment difference.
We must accept some risks of a false-negative result (type II error) and also of a false-positive result (type I error); otherwise, we would need an infinitely large study. Sample calculations involve some judgment, and some compromise is required between strict statistical criteria and practicality.
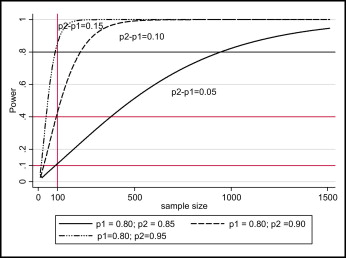
As the minimum clinically important difference to be detected decreases, the sample size increases and vice versa. Figure 1 shows the effect of the size of the difference to be detected between treatment arms on the required sample size and power using simulated data.
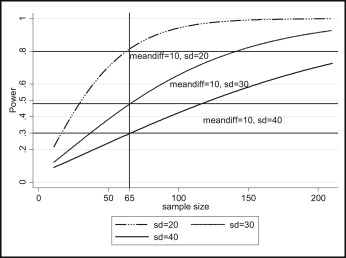
As the variance (for continuous outcomes) increases, the required sample size increases. Figure 2 shows the effect of the variance on the required sample size and power using simulated data.
As the number of events (outcomes) become rare, the required sample increases.
As the desired power level increases (power = 1 − β) or the probability of type II error (β) and type I error (α) decreases, the required sample size increases and vice versa.
Sample calculations are performed at the design stage of the trial, and beforehand knowledge of the range of values for some calculation parameters is required. Information on those parameter values might be obtained from previous research, publications, or pilot studies. Sample calculations are meaningless after trial conclusion; at this stage, power and precision can be assessed by using the produced confidence intervals.
Sample calculations for clinical trials: Parallel arm designs
First we will conduct a sample calculations for a trial with qualitative outcomes, a 1:1 allocation ratio, and a 2-sided test.
We are interested in conducting a trial to compare failures of lingual retainers bonded with chemically cured or a light-cured adhesive, and to determine whether there is a difference at the 0.05 statistical level with 90% power. The procedure for sample calculation for such a study will be as follows.
- 1.
We must decide what is an acceptable difference to be observed that is of clinical importance. Selecting a difference that is too small and not clinically important will increase the required sample size to impractical levels; at the same time, the trial will give results that, although significant, might have no clinical importance. Let us assume that we consider a 10% difference in the proportion of failures to be an important clinical difference.
- 2.
We must make assumptions regarding the expected proportion of failures in the control arm, the chemically cured adhesive in this example. Sources that will help us to determine the expected proportion of failures in the control arm could be published studies or a pilot of the trial we are designing. Let us assume that we have found a study that reported on the proportion of failures for the chemically cured adhesive we are planning to use and that this proportion of failures is 20%.
So far, we have the proportion of failures in the control arm (20%), the minimum difference (10%) to be detected, and the desired significance and power levels (5% and 90%). To carry out this calculation, we will use the formula described by Pocock that assumes independently distributed outcomes, equal numbers of participants per arm, no losses to follow-up, and no continuity corrections:
Formula 1 is for sample calculation for proportions, where n is the required sample size per trial arm, π1 is the expected percentage of failures in those on standard treatment, π2 is the expected percentage of failures in those on the new treatment, and f (α, β) is a function of α and β derived from the standard normal distribution, with its values given in the Table .
| β | ||||
|---|---|---|---|---|
| 0.05 (95% power) | 0.1 (90% power) | 0.2 (80% power) | 0.5 (50% power) | |
| α | ||||
| 0.05 | 13.0 | 10.5 | 7.85 | 3.84 |
| 0.01 | 17.8 | 14.9 | 11.7 | 6.63 |
By substituting the selected values in formula 1 above:
This indicates that the required sample size would be 263 (rounded up) per treatment arm, for a total of 526 patients. If we reduce the power to 80%, the required sample size would be:
By playing with different scenarios, we can see that the required number of patients increases as the proportion of the events in the 2 arms is closer to the 0.5 value, the difference to be detected decreases, the level of significance decreases, and the power increases.
Next we will perform a sample calculation for a trial with normally distributed quantitative outcomes, a 1:1 allocation ratio, and a 2-sided test.
In this example, we are interested in comparing the number of days it takes to reach dental arch alignment with a conventional appliance and a self-ligating appliance. For the sample calculations for comparison of proportions, certain assumptions and decisions should be made. We assume that, for the conventional bracket, 200 days are needed to reach alignment (μ1, comparison or control group), with a standard deviation (sd) of 50 days. We want to calculate the required sample to be able to detect a difference of 40 days between the 2 bracket systems at significance level α = 0.05 and power = 1 − β = 90%. The extra parameter that must be defined in this scenario is the standard deviations of the means to be compared.
Formula 2 is for sample calculation for 2 means according to Pocock : μ1 is the expected mean number of days to reach alignment with the standard treatment, μ2 is the expected mean number of days to reach alignment with the alternative treatment, sd is the standard deviation of the response (assumed to be the same on both arms), α is type I error (significance level), and β is type II error (1 − β = power) and f (α, β) is a function of α and β derived from the standard normal distribution, with its values given in the Table .
By substituting the appropriate values into formula 2, we get:
We assume that observations are independent, the numbers of participants per trial arm are the same, and there are no losses to follow-up. By experimenting with the formula, we can see that the required sample size increases when the required difference to be detected is decreased, the power level is increased, the α level is decreased, or the variance is increased and vice versa.
When patients are lost during follow-up, apart from the possibility of postrandomization bias, the power of the trial decreases. Therefore, it would be prudent to account for the expected losses to follow-up by appropriately increasing the initial sample size accordingly.
Stay updated, free dental videos. Join our Telegram channel
VIDEdental - Online dental courses


