Introduction
In this study, we evaluated the reproducibility of the lip position at rest in 3 dimensions using reverse engineering software and stereophotogrammetric images.
Methods
We used 3dMD Flex (3dMD, Atlanta, Ga) to obtain 60 stereophotogrammetric images from the same participant. Thirty images were obtained in 3 sessions on the same day, and the procedure was repeated 6 weeks later for 30 more images. The surface-base registration, the segmentation of the upper and lower lips, and the 3-dimensional deviation analysis were performed with Geomagic Control (3D Systems, Rock Hill, SC) software. The Shapiro-Wilk test, paired sample t test, Bland-Altman plots, and Wilcoxon signed rank test were used for statistical analysis at a significance level of P <0.05.
Results
The deviations of the upper lip on the first images were between 0.16 and 1.39 mm. The mean total deviation was 0.25 ± 0.12 mm. The mean deviation of the lower lip was 0.34 ± 0.17 mm. The deviations were observed between −1.96 and 1.97 mm. When the mean positive ( P = 0.633 and P = 0.171, respectively) and the mean negative ( P = 0.771 and P = 0.842, respectively) deviations of the upper and lower lips were analyzed, there was no significant difference between the 2 time points.
Conclusions
The results suggest that the rest position can be reproduced within a small range both on the same day and between the sessions. More research with larger samples is needed to confirm these results.
Highlights
- •
We assessed the reproducibility of the rest position using 3D soft tissue images.
- •
3D stereophotogrammetry images of a participant were acquired using 3dMD flex.
- •
The reproducibility was assessed on the same day and 6 weeks later.
- •
The rest position can be reproduced within a small range both on the same day and between the sessions.
The recent shift to the soft tissue paradigm has been adopted by many clinicians. With such a paradigm shift, orthodontic diagnosis and treatment planning, based on dental and skeletal structures, were superseded by orthodontic approaches built on the positive and negative characteristics of the soft tissues. Spear et al suggested beginning orthodontic treatment planning with an esthetic evaluation, which should be followed by evaluations of function, structure, and biology. Arnett and Gunson summarized this paradigm shift by stating, “The bite indicates a problem; the face indicates how to treat the bite.”
The soft tissue analyses begin with the evaluation of the positive and negative characteristics of the facial soft tissues. Based on these evaluations, clinicians decide how to correct the bite to reach the desired facial esthetic goals. According to Zachrisson, if esthetics are the starting point, the evaluation starts at the position of the maxillary central incisors to the upper lip.
Which expression should be used periodically by the orthodontist as a guide in orthodontic treatment for incisor positioning in orthodontic treatment: rest, speech, posed social smile, or spontaneous smile? The real problem is focused on reproducibility. Zachrisson reported that the most important position for planning the diagnosis and treatment was the full front facial image taken while the patient’s lips were in the rest position. He used the rest position, achieved with the pronunciation of the words “Emma” and “Mississippi,” as a guide to positioning the teeth because of the high reproducibility of this method. According to Burstone, the rest position of the lips is the functional position with the highest reproducibility. While the lips are in the rest position, maxillary incisor display should be used as a guide to determine how to move the teeth during orthodontic treatment. Sarver and Ackerman use the social smile as a guide when planning soft tissue facial treatment. It was demonstrated that the reproducibility of the smile varied, and the rest position had the highest level of reproducibility, whereas the natural and maximal smile was less reproducible. Rigsbee et al established that the posed social smile was reproducible photographically when compared with the Duchenne smile. Ackerman et al reported that the reproducibility of the posed smile was disputable in children. They stated that adolescents are likely to develop a maturational sequence in a reproducible smile. Campbell et al found that the effect of increased overjet on smiling was statistically significant; however, there was no effect on the reproducibility of the natural or maximal smile when compared with the controls. Ekman suggested that the posed smile might be affected by the person’s social abilities and emotional background, leading to an unnatural or asymmetric smile. Van der Geld et al asserted that the guide might be the spontaneous smile during the assessment of the association between the lips and teeth via dynamic records. Walder et al evaluated reproducibility in objective and subjective terms. They concluded that the reproducibility of the posed smile might be reliable if the measurement was objective.
The most significant disadvantage of 2-dimensional (2D) imaging methods is the evaluation of 3-dimensional (3D) objects by degrading them into 2 dimensions. Adequate details cannot be achieved with 2D radiographic techniques when seeking to comprehend the face and skull in terms of an accurate and reliable 3D configuration. With the rapid shift from 2D to 3D imaging and the progress from analog to digital technology, more details have become available than those in 2D records, allowing broader diagnosis and treatment planning for clinical orthodontics. With 3D images, the orthodontist can have a more accurate demonstration of the facial soft tissues and morphologies and can also predict orthodontic outcomes by comparing various types of faces and outcomes of the treatment. With the success of integrating the progress in the software field with 3D imaging in orthodontic applications, it will be possible to evaluate these images in a more productive and understandable manner and to approach patients with more quantitative results.
In this study, we aimed to evaluate the reproducibility of the rest position 3 dimensionally using engineering software on 3D stereophotogrammetric images.
Material and methods
This study was conducted on 60 3D stereophotogrammetric images of the same participant with the approval of the clinical research ethics committee of Gulhane Military Medical Academy in Turkey. The participant was selected randomly from adult patients referred to our department for orthodontic treatment. The male participant was 32 years old, and his upper and lower lips had normal tonicity and morphology determined by inspection and palpation clinically. He had no muscular anomalies, no history of facial surgical treatments, or no trauma or facial defect.
The acquisition of the 3D surface images from the subject was performed by a qualified technician using the 3dMD Flex system (3dMD, Atlanta, Ga), and it took 1.5 milliseconds to obtain full cranial images.
The images were acquired in 3 sessions, 3 hours apart on the same day; 30 images were obtained in total, with 10 images in each session. The procedure was repeated 6 weeks later to obtain 30 more 3D images. The participant was positioned in a back-supported chair that could be adjusted before every image acquisition. There were 2 minutes between the acquisitions at each session to process the obtained images, and the images were checked using the 3dMDpatient software. Improper images were reacquired. The participant left his place and repositioned after every acquisition.
The subject was informed verbally and visually before the rest positioning, and 2 test acquisitions were performed. A mirror was placed facing him, and the records were taken in natural head position. The technique adopted in the literature was used for positioning the subject at rest, and the rest position was achieved upon full relaxation for 1 or 2 seconds and then by pronouncing the word “Emma.”
The images of the participant were viewed using the 3dMDpatient software, and 1 image was taken as the reference by an investigator (F.D.); it was considered to be the guide for treatment. The remaining images were compared with the reference image to evaluate the positive and negative deviations. This guide image acquired at the start of the study (T0) was again used as a guide for the stereophotogrammetric images taken 6 weeks later (T1), and the deviations from this image were analyzed and compared with those from T0.
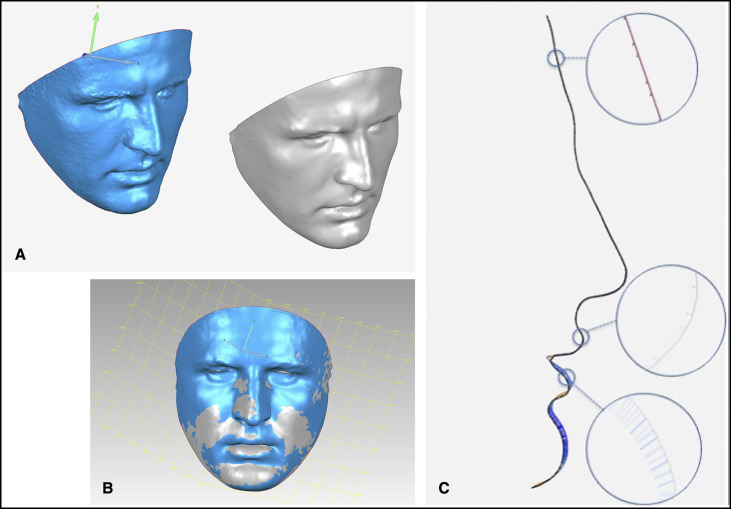
Polygon meshes were created from the data transferred into the Geomagic Control (3D Systems, Rock Hill, SC) software in .stl format. Two planes were drawn over the meshes to remove hair, ears, and the region below the neck. The first plane passed through the right and left tragus points and trichion points, and the second plane passed through the right and left tragus points and the soft tissue menton. The regions outside these intersecting planes were removed ( Fig 1 , A ). For better and more uniform tessellation, the images were retriangulated, and the surface detailing was increased. For the facial images acquired, the test image was aligned with the reference image under the sample size of 20,000 points, and the initial alignment phase was implemented. Two meshes at a time were trimmed to remove the minimal mismatches between the meshes after this alignment, and the alignment was repeated ( Fig 1 , B ). An area in the forehead region was identified on the aligned images. The last alignment procedure was performed on this area, and the process was completed. The root mean square (RMS) error that was obtained after the last alignment was noted to measure the alignment sensitivity ( Fig 1 , C ).
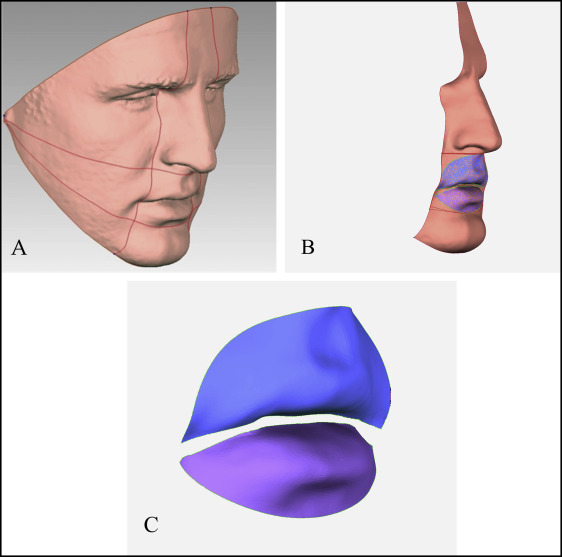
For the face, 4 planes were designated as shown in Figure 2 , A , and the segmentation of the lower and upper lips was implemented. Plane 1 passed through the right and left tragus and subnasale points; plane 2 passed through the right and left tragus and the soft tissue B-point; planes 3 and 4 passed through the right and left endocanthion points and 3 mm from the right and left chelion. Across the mouth region that remained between the planes, a standard elliptical area was obtained, which was tangent to these planes ( Fig 2 , B ). Finally, the interlabial gap was removed because of the imperfections in the tooth area, as a result of reduced image definition; the segmentation was completed in this way ( Fig 2 , C ).
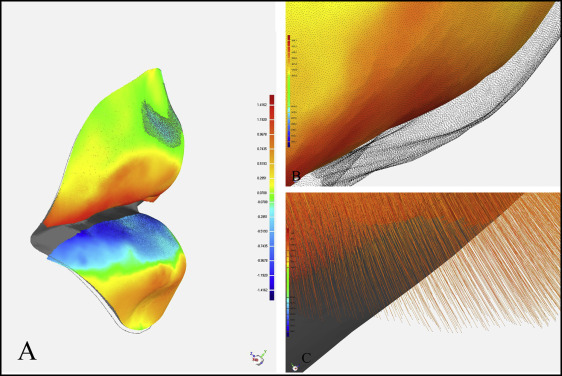
The 3D deviation analysis was completed between the meshes in the upper and lower lips, and the percentages of the meshes evaluated in the lower and upper lips, the percentage distributions of the points by the different millimetric distances, the maximum positive and negative deviations, the means of the negative and positive deviations within their own contexts, and the total mean deviation and the standard deviations were obtained ( Fig 3 ).
Statistical analysis
The power analysis was made using the 2-sample Satterthwaite t test. With the intermeasurement ratio of 1:1, it was established that a sample size of 5 produced a power greater than 90% at a significance level of P <0.05. The first standard deviation was 0.26, and the second standard deviation was 0.11; the true difference of the means was 0.5 mm.
The deviations between 20 randomly selected images and the guide image were reanalyzed by the same investigator 20 days later to evaluate the intraexaminer reliability of the measurements with intraclass correlation coefficients. The normality of the distribution was tested with the Shapiro-Wilk analysis. The differences between T0 and T1 were evaluated using the paired sample t test for the parameters with normal distributions, and the consistency between these 2 measurements was supported by the Bland-Altman plot. The Wilcoxon signed rank test was used for the parameters without normal distribution. The significance level was considered to be 0.05 in all statistical analyses. The differences between T0 and T1, and the descriptive statistics of the parameters were analyzed using the Statistical Package for Social Sciences software (version 20; IBM, Armonk, NY).
Results
For all alignments with the reference image, the calculated parameters included the RMS error value of the alignment in the forehead region, the percentages of the meshes evaluated, the means of the total negative and total positive deviations, and the lowest negative and the highest positive deviations. The descriptive statistics of the parameters and the results of the comparison between T0 and T1 are presented in Tables I and II .
| T0 | T1 | Mean difference (95% CI) | t | P | |||||||
|---|---|---|---|---|---|---|---|---|---|---|---|
| Minimum | Maximum | Mean | SD | Minimum | Maximum | Mean | SD | ||||
| RMS error (forehead) (mm) | 0.03 | 0.09 | 0.046 | 0.018 | 0.02 | 0.07 | 0.051 | 0.015 | −0.004 (−0.01, 0.005) | −0.94 | 0.301 |
| Percentage of mesh (%) | 97.89 | 99.57 | 98.74 | 0.55 | 97.84 | 99.69 | 98.78 | 0.52 | −0.04 (−0.33, 0.24) | −0.30 | 0.762 |
| Maximum negative deviation (mm) | −1.39 | −0.22 | −0.64 | 0.25 | −1.6 | −0.21 | −0.67 | 0.29 | 0.032 (−0.12, 0.19) | 0.42 | 0.676 |
| Maximum positive deviation (mm) | 0.16 | 1.09 | 0.64 | 0.23 | 0.16 | 1.57 | 0.65 | 0.29 | −0.01 (−0.17, 0.13) | −0.21 | 0.828 |
| Mean negative deviation (mm) | −0.58 | −0.02 | −0.23 | −0.13 | −0.58 | −0.02 | −0.23 | 0.13 | −0.011 (−0.09, 0.06) | −0.29 | 0.771 |
| Mean positive deviation (mm) | 0.09 | 0.51 | 0.26 | 0.11 | 0.08 | 0.74 | 0.28 | 0.16 | −0.01 (−0.1, 0.06) | −0.48 | 0.633 |
| Mean total deviation (mm) | 0.02 | 0.58 | 0.25 | 0.12 | 0.02 | 0.74 | 0.25 | 0.15 | −0.004 (−0.059, 0.051) | −0.14 | 0.884 |
| T0 | T1 | Mean difference (95% CI) | t | P | |||||||
|---|---|---|---|---|---|---|---|---|---|---|---|
| Minimum | Maximum | Mean | SD | Minimum | Maximum | Mean | SD | ||||
| RMS error (forehead) (mm) | 0.03 | 0.09 | 0.046 | 0.018 | 0.02 | 0.07 | 0.051 | 0.015 | −0.004 (−0.01, 0.005) | −0.94 | 0.301 |
| Percentage of mesh (%) | 97.1 | 99.45 | 98.61 | 0.82 | 96.89 | 99.66 | 98.82 | 0.74 | −0.207 (−0.59, 0.18) | −1.08 | 0.287 |
| Maximum negative deviation (mm) | −1.96 | −0.35 | −0.87 | 0.42 | −1.62 | −0.14 | −0.9 | 0.37 | 0.036 (−0.18, 0.25) | 0.33 | 0.739 |
| Maximum positive deviation (mm) | 0.37 | 1.97 | 0.84 | 0.34 | 0.21 | 2.03 | 0.87 | 0.4 | −0.071 (−0.24, 0.1) | −0.83 | 0.413 |
| Mean negative deviation (mm) | −0.84 | −0.07 | −0.35 | 0.19 | −0.84 | −0.04 | −0.36 | 0.21 | 0.011 (−0.1, 0.12) | 0.20 | 0.842 |
| Mean positive deviation (mm) | 0.14 | 0.69 | 0.33 | 0.16 | 0.05 | 1.43 | 0.42 | 0.27 | −0.08 (−0.20, 0.03) | −1.40 | 0.171 |
| Mean total deviation (mm) | 0.07 | 0.84 | 0.34 | 0.17 | 0.04 | 1.45 | 0.39 | 0.24 | −0.04 (−0.12, 0.03) | −1.18 | 0.242 |
Stay updated, free dental videos. Join our Telegram channel
VIDEdental - Online dental courses


