Introduction
Root resorption is a side effect of orthodontic treatment that occurs with the removal of hyalinized tissue. Studies have shown that a reparative process in the periodontium begins when the applied orthodontic force is discontinued or reduced below a certain level. However, quantitative 3-dimensional evaluation of root resorption repair has not been done. The aim of this study was to quantitatively assess the 2- and 3-dimensional changes of root resorption craters after 2 weeks of continuous mesially applied orthodontic forces of 50 g on rat molars and 2- to 16-week retention periods.
Methods
We used 60 male Wistar rats (10 weeks old). Nickel-titanium closed-coil springs were used to apply 50-g mesial forces for 2 weeks to move the maxillary left first molars. The rats were randomly allocated to 6 groups. Those in the zero-week retention group were killed after force application. In the remaining 5 groups, the interdental spaces between the maxillary first and second molars were filled with resin to retain the molars. The molars were extracted after periods of retention from 2 and 16 weeks. The maxillary right molars were used as the controls. Mesial and distal roots (distobuccal and distopalatal) were examined by using scanning electron and 3-dimensional scanning laser microscopes. The surface area, depth, volume, and roughness of the root resorption craters were measured.
Results
The area, depth, and volume of the craters decreased gradually and showed similar trends over the retention time, approaching a plateau at the 12th week. After 16 weeks of retention, the volumes of the resorption craters of the distobuccal and distopalatal roots reached recovery peaks of 69.5% and 66.7%, respectively. Small pits on the mesial roots showed recovery of 62.5% at the 12th week. The healing patterns in distal roots with severe resorption and mesial roots with shallow resorption had no significant differences.
Conclusions
The resorption and repair processes during the early stages of retention are balanced, and most of the reparative process occurs after 4 weeks of passive retention after the application of orthodontic force. Frequent orthodontic reactivations should be avoided to allow recovery and repair of root surface damage.
Root resorption is a common side effect of orthodontic treatment; it can occur during and at the end of treatment. With severe root resorption, it is recommended to stop the application of force to prevent worsening of iatrogenic sequelae. It is believed that the healing process of a resorption cavity starts as early as the first week of retention after treatment when the orthodontic force is discontinued or reduced below a certain level. Many studies have shown that resorptive defects are repaired by deposition of new cementum and reestablishment of a new periodontal ligament. Schwarz considered the possibility that fibers of the periodontal ligament incorporated in the new cementum during repair to some extent might compensate for the loss of root substance. Correspondingly, Langford found that much new cementum can be deposited in the resorption crater under repair.
Several qualitative studies have evaluated resorption repair by using light microscopy, scanning electron microscopy (SEM), and transmission electron microscopy. Radiographic, 2-dimensional, evaluation studies were limited to measuring only the amount of root apex loss and were highly inaccurate because of magnification errors and low reproducibility. Histologic studies were technique sensitive, and quantitative measurement of root resorption was not reliable because material is lost during histologic sectioning. Three-dimensional (3D) reconstructions of small specimens such as root resorption craters with high spatial resolution were recently created by using microcomputed tomography and used to quantify root resorption in human and animal samples. However, these studies did not quantify the root resorption healing.
The aim of this investigation was to evaluate the amount of repair by quantitative assessment of the dimensional and volumetric changes of root resorption craters at 2 to 16 weeks of retention after 2 weeks of continuous 50-g mesially applied orthodontic forces on rat molars by using SEM and laser microscope.
Material and methods
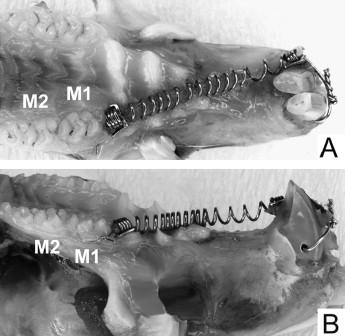
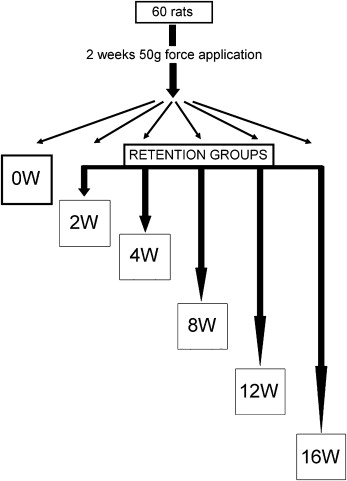
Sixty 10-week-old male Wistar rats were used (ethics approval, Animal Welfare Committee of Nagasaki University, No. 0603170498). The rats (SLC, Shizuoka, Japan; weight, 230-250 g) were allowed 1 week to acclimatize to their new laboratory environment. The appliance was set under anesthesia by using intraperitoneal injection of pentobarbital at a dosage of 60 mg per kilogram of body weight. The posterior end of the coil spring was tied around the first molar with a 0.1-mm diameter stainless steel ligature wire. The anterior end of the coil spring was fixed to a hole drilled through the incisors at the alveolar bone level with a 0.008-in diameter ligature wire ( Fig 1 ). The appliance was activated by pulling to a triple deflection (9 mm) to produce a nearly constant force. The force magnitude was measured with a tension gauge (DTN-150, Teclock, Okaya, Nagano, Japan) in a water bath at 37.5°C. The procedure was accomplished when the appliance was set and at the end of the experimental time. The measurements before and after the experiments were 49.1 ± 2.4 g and 53.6 ± 5.8 g, respectively (n = 20). The contralateral molars served as the controls. After 2 weeks of orthodontic force application, the amount of tooth movement was measured on cephalometric radiographs, as previously reported. Briefly, a cephalostat was specially constructed to standardize the rats’ head position. The distance between the x-ray tube and the film was 50 cm. The cephalometric radiographs were digitized with a film scanner at 600 dpi. Tooth movement was measured on the digitized images with imaging software (Scion, Frederick, Md). The appliance was removed, and self-cured resin (Super Bond, Sun Medical, Shiga, Japan) was placed in the interdental spaces between the left first and second molars to maintain the tooth movement until the rats were killed. The rats were then randomly divided into 6 groups (10 animals each) according to the retention time. One randomly selected group of rats was killed after 2 weeks of force application and served as the zero-week retention group. The other 5 groups of rats were killed after 2, 4, 8, 12, and 16 weeks of retention ( Fig 2 ). The left (experimental) and right (control) maxillary first molars including the surrounding bone were cut as a block, followed by delicately removing the alveolar bone to prevent root-surface damage. The molars were submerged in 1% sodium hypochlorite for more than 10 minutes to remove periodontal ligament remnants. The molars were kept in separate, labeled storage containers without storage media. They were then sectioned buccolingually through the crown near the cementoenamel junction with a thin diamond disk. Root resorption craters on the apical region were not evaluated because of anatomic variations and difficulties in delimiting the craters.
The mesial and distal surfaces of distobuccal, distopalatal, and mesial roots were evaluated with a scanning electron microscope (TM-1000, Hitachi, Tokyo, Japan) and a 3D laser scanning microscope (VK-9500, Keyence, Kyoto, Japan). Since resorption craters in the distal surfaces of the roots were scarcely detectable, they were also excluded from the study. All craters scattered on the cervical and middle thirds of the roots (mesial side) were digitally obtained and stored as bit map images. The surface areas were measured with commercial software (Mimics, Materialise, Tokyo, Japan). The deepest point and the surface roughness of the resorption craters were calculated with the laser microscope program (VK-9500). The average depth was verified by the software. With a resolution of 0.01 μm, the microscope enabled measurement of the root-surface profile as well as observation. It was a noncontact and nondestructive measurement with no marks left on the surface of the roots. The crater edges were determined by a numerical value of roughness over 10 μm and confirmed by exploring the surface roughness of the root by observing the images obtained by the scanning electron microscope. The cervical edge of a root was determined at the cementoenamel junction. The measured value of the crater area was multiplied by the average depth to give the volume. The same investigator (C.G.) made all measurements, and every measurement was repeated 3 times. The mean value was used as the final measurement. To assess measurement reproducibility, serial measurements of area, depth, surface roughness, and volume were made 10 times in 1 randomly selected distobuccal root. The means and standard deviations were 28.1 ± 0.4 % for area, 147.5 ± 0.37 μm for depth, 18.7 ± 0.5 μm for surface roughness, and 10.9 ± 0.05 × 10 6 μm 3 for volume.
Statistical analysis
Statistical analysis was performed with SPSS software (version 16.0, SPSS, Chicago, Ill). Univariate analysis of variance (ANOVA) and pairwise comparisons between the groups were performed. Bonferroni adjustments were made for multiple comparisons. The Pearson correlation coefficient was used to calculate the correlations between retention duration and root resorption crater volume.
Results
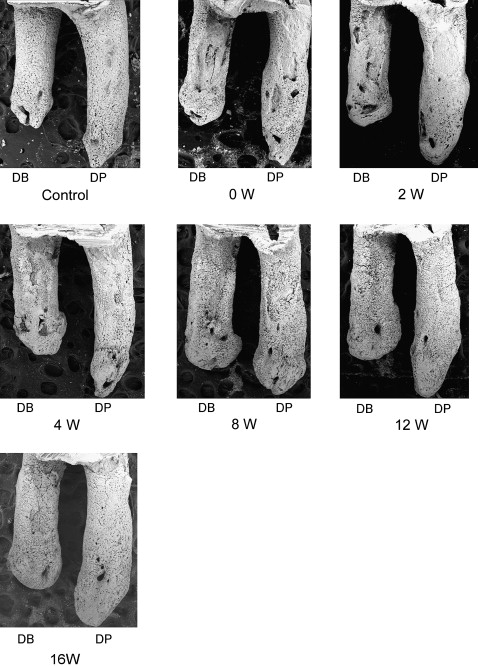
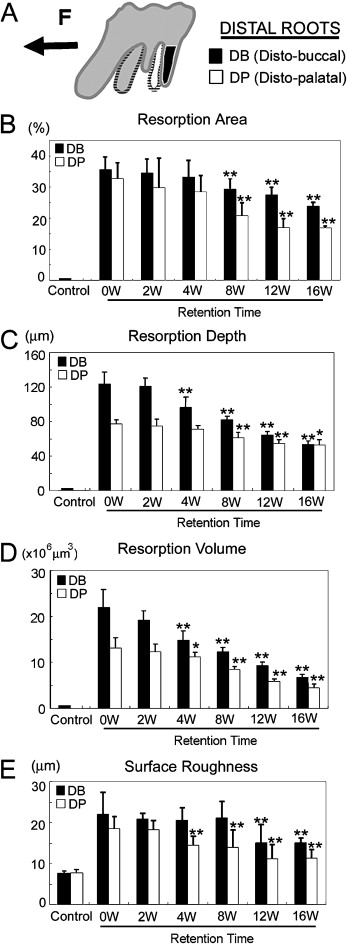
After 2 weeks, the rats’ teeth moved 0.24 ± 0.07 mm. Most control roots had areas covered by undamaged cementum with a characteristic smooth surface. The apical third of the control roots was covered by thick cementum with a rough and irregular surface that occasionally contained resorption craters. The zero-week group had resorption craters with well-defined margins. Three types of craters were clearly identified: isolated lacunae, wide and shallow resorption pits, and deep resorption craters. Small isolated lacunae were mainly seen scattered on the mesial roots (cervical half of the mesial surface). Wide and shallow, and deep resorption craters were observed on the distal roots covering the cervical and middle portions of the root. In the mesial roots, small resorption pits were distributed mostly on the cervical portion of the root. In the retention groups’ molars, the healing process was evaluated after 2, 4, 8, 12, and 16 weeks of retention. Examination of the root surfaces in the retention groups with SEM showed that the resorption craters gradually became smaller, more even, and smoother with time ( Fig 3 ). The surface area recovered noticeably after 8 weeks. The tendency of the resorption craters to diminish in area continued until the end of the experiments at 16 weeks ( Table I ). The resorption areas of the distal roots at 16 weeks were not significantly smaller than at 12 weeks ( Fig 4 , B ). At that point, light depressions, remaining as scars of root resorption, were still shown by SEM ( Fig 3 , 16 weeks). The depth of the resorption craters in the distal roots also showed gradual and significant decrease from the fourth week of retention ( Table II ; Fig 4 , C ). The area and depth measurements were consistent with their volumes; this was also shown by the high correlation coefficient between the values and retention times ( Table III ). The distobuccal roots had gradual reductions in volume: 12.7% after 2 weeks, 33.2% after 4 weeks, 44.1% after 8 weeks, 57.7% after 12 weeks, and 69.5% after 16 weeks ( Table I ; Fig 4 , D ). A significant volume recovery was observed from the 4th week of retention until the end of the experiments. In the distopalatal roots, volume recovery rates were 55.4% and 66.7% after 12 and 16 weeks, respectively. With regard to surface roughness, the bottom of the root resorption cavities showed extensive, irregular, disorganized, and rough layers with irregular borders in the zero-week group. The surface roughness in the distopalatal roots had a significant decrease after 4 weeks of retention, continuing until the end of the experiments. In the distobuccal roots, smoothing of the bottom of the craters was clearly observed from the eighth week of retention. At this time, shown by SEM, the reparative cementum surface had an even and smooth structure. The borders of the resorption craters became round and less sharp ( Fig 4 , E ).
| Control (n = 10) | 0 W (n = 10) | 2 W (n = 10) | 4 W (n = 10) | 8 W (n = 10) | 12 W (n = 10) | 16 W (n = 10) | ||||||||
|---|---|---|---|---|---|---|---|---|---|---|---|---|---|---|
| Mean | ±SD | Mean | ±SD | Mean | ±SD | Mean | ±SD | Mean | ±SD | Mean | ±SD | Mean | ±SD | |
| Distobuccal root | ||||||||||||||
| Area (%) | 1.2 | 0.0 | 35.6 | 4.0 | 34.5 | 4.6 | 33.2 | 5.4 | 29.4 | 3.4 | 27.6 | 2.5 | 24.0 | 1.3 |
| Depth (μm) | 2.5 | 0.4 | 123.7 | 13.3 | 120.4 | 9.9 | 96.3 | 12.3 | 82.3 | 3.6 | 64.1 | 4.2 | 53.4 | 4.1 |
| Volume (×10 6 μm 3 ) | 0.9 | 0.1 | 22.0 | 3.8 | 19.2 | 2.0 | 14.7 | 2.2 | 12.3 | 0.9 | 9.3 | 0.7 | 6.7 | 0.7 |
| Roughness (μm) | 7.2 | 0.6 | 22.1 | 5.4 | 20.8 | 1.4 | 20.5 | 3.0 | 21.1 | 4.1 | 15.0 | 4.5 | 15.0 | 1.2 |
| Distopalatal root | ||||||||||||||
| Area (%) | 1.1 | 0.2 | 32.8 | 5.1 | 29.7 | 9.6 | 28.5 | 5.2 | 20.7 | 4.5 | 20.0 | 2.9 | 16.8 | 0.6 |
| Depth (μm) | 2.3 | 0.4 | 77.1 | 5.2 | 74.4 | 8.3 | 71.4 | 3.9 | 61.2 | 6.2 | 54.1 | 4.7 | 52.8 | 6.5 |
| Volume (×10 6 μm 3 ) | 0.8 | 0.1 | 13.2 | 2.3 | 12.3 | 1.7 | 11.2 | 1.1 | 8.4 | 0.7 | 5.9 | 0.5 | 4.4 | 0.7 |
| Roughness (μm) | 7.4 | 0.6 | 18.5 | 3.1 | 18.2 | 2.4 | 14.5 | 2.1 | 13.9 | 4.2 | 11.2 | 3.4 | 11.3 | 2.1 |
| Mesial root | ||||||||||||||
| Area (%) | 0.3 | 0.2 | 4.2 | 1.4 | 2.2 | 1.3 | ||||||||
| Depth (μm) | 2.2 | 0.4 | 23.2 | 8.4 | 8.9 | 9.3 | ||||||||
| Volume (×10 6 μm 3 ) | 0.3 | 0.1 | 0.8 | 0.4 | 0.3 | 0.1 | ||||||||
| Roughness (μm) | 1.4 | 0.3 | 7.2 | 1.1 | 3.1 | 0.7 | ||||||||
| 95% CI for difference ‡ | ||||||
|---|---|---|---|---|---|---|
| Group (I) | Group (J) | Mean difference (I – J) | SE | Significance ‡ | Lower bound | Upper bound |
| Distobuccal root | ||||||
| Area (%) | ||||||
| 0 W | 2 W | 1.16 | 1.46 | 1.00 | −3.31 | 5.64 |
| 4 W | 3.24 | 1.46 | 0.45 | −1.23 | 7.71 | |
| 8 W | 6.20 † | 1.46 | 0.00 | 1.74 | 10.68 | |
| 12 W | 8.09 † | 1.46 | 0.00 | 3.62 | 12.56 | |
| 16 W | 11.73 † | 1.46 | 0.00 | 7.26 | 16.20 | |
| Depth (μm) | ||||||
| 0 W | 2 W | 3.36 | 3.98 | 1.00 | −8.86 | 15.59 |
| 4 W | 27.42 † | 3.98 | 0.00 | 15.20 | 39.65 | |
| 8 W | 41.39 † | 3.98 | 0.00 | 29.17 | 53.62 | |
| 12 W | 59.61 † | 3.98 | 0.00 | 47.38 | 71.84 | |
| 16 W | 70.30 † | 3.98 | 0.00 | 58.08 | 82.53 | |
| Volume (×10 6 μm 3 ) | ||||||
| 0 W | 2 W | 1.68 | 0.91 | 1.00 | −1.12 | 4.48 |
| 4 W | 5.35 † | 0.91 | 0.00 | 2.55 | 8.16 | |
| 8 W | 7.91 † | 0.91 | 0.00 | 5.11 | 10.71 | |
| 12 W | 11.03 † | 0.91 | 0.00 | 8.24 | 13.84 | |
| 16 W | 12.99 † | 0.91 | 0.00 | 10.19 | 15.79 | |
| Roughness (μm) | ||||||
| 0 W | 2 W | 1.32 | 1.40 | 1.00 | −2.97 | 5.61 |
| 4 W | 1.58 | 1.40 | 1.00 | −2.71 | 5.86 | |
| 8 W | 1.44 | 1.40 | 1.00 | −2.85 | 5.72 | |
| 12 W | 7.04 † | 1.40 | 0.00 | 2.76 | 11.33 | |
| 16 W | 6.99 † | 1.40 | 0.00 | 2.71 | 11.28 | |
| Distopalatal root | ||||||
| Area (%) | ||||||
| 0 W | 2 W | 3.07 | 2.07 | 1.00 | −3.28 | 9.43 |
| 4 W | 4.78 | 2.07 | 0.37 | −1.58 | 11.13 | |
| 8 W | 12.07 † | 2.07 | 0.00 | 5.72 | 18.43 | |
| 12 W | 15.78 † | 2.07 | 0.00 | 9.43 | 22.14 | |
| 16 W | 15.96 † | 2.07 | 0.00 | 9.61 | 22.32 | |
| Depth (μm) | ||||||
| 0 W | 2 W | 2.75 | 2.67 | 1.00 | −5.45 | 10.95 |
| 4 W | 5.74 | 2.67 | 0.54 | −2.46 | 13.95 | |
| 8 W | 15.97 † | 2.67 | 0.00 | 7.77 | 24.18 | |
| 12 W | 23.03 † | 2.67 | 0.00 | 14.83 | 31.24 | |
| 16 W | 24.32 ∗ | 2.67 | 0.00 | 16.12 | 32.53 | |
| Volume (×10 6 μm 3 ) | ||||||
| 0 W | 2 W | 1.27 | 0.59 | 0.54 | −0.54 | 3.08 |
| 4 W | 1.81 ∗ | 0.59 | 0.05 | 0.01 | 3.63 | |
| 8 W | 4.17 † | 0.59 | 0.00 | 2.36 | 5.98 | |
| 12 W | 6.79 † | 0.59 | 0.00 | 4.98 | 8.60 | |
| 16 W | 8.23 † | 0.59 | 0.00 | 6.43 | 10.05 | |
| Roughness (μm) | ||||||
| 0 W | 2 W | 0.20 | 1.15 | 1.00 | −3.31 | 3.72 |
| 4 W | 4.12 † | 1.15 | 0.01 | 0.61 | 7.64 | |
| 8 W | 4.09 † | 1.15 | 0.01 | 0.58 | 7.61 | |
| 12 W | 7.30 † | 1.15 | 0.00 | 3.79 | 10.82 | |
| 16 W | 7.18 † | 1.15 | 0.00 | 3.67 | 10.71 | |
Stay updated, free dental videos. Join our Telegram channel
VIDEdental - Online dental courses


