Introduction
The purpose of this study was to examine the relationship of the 3-dimensional (3D) posterior occlusal plane (POP) and the mandibular 3D spatial position. The relationship of the POP to mandibular morphology was also investigated.
Methods
Retrospective data from a convenience sample of pretreatment diagnostic cone-beam computed tomography scans were rendered using InVivo software (Anatomage, San Jose, Calif). The sample consisted of 111 subjects (51 male, 60 female) and included growing and nongrowing subjects of different races and ethnicities. The 3D maxillary POP was defined by selecting the cusp tips of the second premolars and the second molars on the rendered images of the subjects. The angles made by this plane, in reference to the Frankfort horizontal plane, were measured against variables that described the mandibular position in the coronal, sagittal, and axial views. The POP was also compared with bilateral variables that described mandibular morphology.
Results
There were significant differences of the POP among the different skeletal malocclusions ( P <0.0001). The POP showed significant correlations with mandibular position in the sagittal ( P <0.0001), coronal ( P <0.05), and axial ( P <0.05) planes. The POP also showed a significant correlation with mandibular morphology ( P <0.0001).
Conclusions
These findings suggest that there is a distinct and significant relationship between the 3D POP and the mandibular spatial position and its morphology.
Highlights
- •
Posterior occlusal plane (POP) differed significantly among different skeletal malocclusions.
- •
POP was correlated with mandibular position in sagittal, coronal, and axial planes.
- •
POP showed significant correlation with mandibular morphology.
- •
3D POP and mandibular spatial position and morphology were significantly related.
Early in the history of our specialty, both clinicians and researchers were aware of the relevance of the occlusal plane in the diagnosis and treatment of malocclusions. References to the occlusal plane can be found throughout the orthodontic literature. In 1947, Björk mentioned in his textbook that the steepness of the occlusal plane diminishes with prognathism. Bushra stated that the flatter the occlusal plane, “the more forward the face.” Downs, in 1948, noted that Class II malocclusions tend to have steeper occlusal planes, and Class III malocclusions have flatter occlusal planes. Riedel observed an apparent perpendicular relationship between the occlusal plane and the A-B plane in normal occlusions. Schudy, in 1963, mentioned the relationship of the occlusal plane to function and its significance in treatment. Several authors stated that Tweed obtained more favorable profiles because of his control of the occlusal plane by minimizing the untoward effects of Class II mechanics with his anchorage preparation.
The relationship of the occlusal plane to mandibular position continued to be observed as numerous studies, starting in the 1970s, began to show that during normal dentofacial development, both the occlusal plane and the mandibular plane flattened as the mandible rotated forward with growth. Sato et al demonstrated that the occlusal plane flattened excessively in growing patients with skeletal Class III malocclusions.
Traditionally, the occlusal plane was defined as a line from the incisors to the first molars. In a 1996 study, the authors proposed an alternative way to describe the curvature of the occlusal plane. They divided it into anterior and posterior components, with the anterior occlusal plane defined as a line drawn from the incisal edge of the maxillary central incisor to the cusp tip of the mandibular second premolar, and the posterior occlusal plane (POP) as a line from the cusp tip of the mandibular second premolar to the midpoint of the mandibular second molar at the occlusal surface.
These investigations have shown that the 2-dimensional (2D) POP correlates with anteroposterior mandibular position and predicts both Class II and Class III malocclusions. More recently, Tanaka and Sato conducted a longitudinal study using data from the Burlington Growth Center on white subjects and concluded that during normal Class I growth, the 2D POP flattens with age along with a concomitant decrease in the mandibular plane angle, as well as an increase in forward mandibular position. These findings are similar to previous studies with Japanese and African American samples. The occlusal plane has also been implicated in the different mandibular morphologies of high-angle Class II malocclusions compared with normal Class I and low-angle Class II malocclusions. A recent study with 3-dimensional (3D) cone-beam computed tomography (CBCT) data also found significant differences in the POP between Class II and Class III subjects.
From the coronal perspective, the cant of the POP has shown a distinct and significant relationship with a deviation of the chin from the midline and the mandibular lateral deviation. Researchers have found that the most common trait in facial asymmetries is a mandibular midline deviation. Most studies on mandibular lateral deviation have been conducted using posteroanterior cephalograms, which are reliable in evaluating asymmetries but have inherent inaccuracies because of difficulties in identifying anatomic structures, projection errors, and lack of reproducibility. There are also limitations to conventional 2D lateral cephalograms such as superimposition of bilateral structures and the inherent distortion of the radiograph. To improve on these limitations, CBCT can be used to more accurately analyze and study the 3D relationships of the various craniofacial structures. CBCT scans are on a 1:1 scale; therefore, there are no distortions associated with the data, and anatomic landmarks can more accurately be identified 3 dimensionally; this then provides the ability to select and measure bilateral structures with greater precision.
The purpose of this study was to examine the relationship of the 3D POP to mandibular spatial positioning as well as its morphology using CBCT data.
Material and methods
Three-dimensional data were obtained from CBCT scans taken of patients at the principal investigator’s private orthodontic practice (J.C.C.) as part of their pretreatment diagnostic records. The retrospective convenience sample consisted of 111 subjects (51 male, 60 female) and included growing and nongrowing subjects of different ethnicities. The selection criteria for the sample were patients (1) who signed the consent to use records section in the Informed Consent Form provided by the American Association of Orthodontists, (2) with fully erupted permanent dentition including maxillary second molars, (3) without syndromes or craniofacial anomalies, and (4) with no previous orthodontic treatment.
The sample was divided into Class I, Class II, and Class III based on the anteroposterior dysplasia indicator developed by Kim. The anteroposterior dysplasia indicator was selected over the more commonly used ANB angle because it considers both dentoalveolar and skeletal relationships that cannot be described by 1 measurement. The anteroposterior dysplasia indicator has been shown to have more diagnostic significance when comparing anteroposterior discrepancies. To take the vertical dimension into consideration, the Class II and Class III samples were further divided into high-angle and low-angle classifications based on the Frankfort horizontal plane to mandibular plane angle ( Table I ). Age and sex characteristics of the 5 groups were as follows: Class I (13 female, 10 male; mean age, 16.6 years; range, 11-41 years), high-angle Class II (14 female, 0 male; mean age, 17.2 years; range, 11-45 years), low-angle Class II (12 female, 14 male; mean age, 14.8 years; range, 11-39 years), high-angle Class III (11 female, 13 male; mean age, 20.5 years; range, 9-39 years), and low-angle Class III (10 female, 14 male; mean age, 20.7 years; range, 11-53 years).
| Class type | APDI | FMA (°) |
|---|---|---|
| Class I | 78-82 | |
| Class II, high angle | <78 | >25 |
| Class II, low angle | <78 | <25 |
| Class III, high angle | >83 | >25 |
| Class III, low angle | >83 | <25 |
The DICOM data were obtained using a Kodak 9500 Cone Beam 3D System (90 kW, full field of view: 200 × 184 mm, 0.3-mm voxel resolution, and 2-15 mA; Kodak, Rochester, NY) and was imported into and rendered with InVivo software (version 5.3.1; Anatomage, San Jose, Calif) to create a 3D image of the patient. The CBCT scans were taken with the patients standing up, with their heads positioned in Frankfort horizontal plane. The use of a custom-made cephalostat ensured that the interporion line was oriented parallel to the floor. This provided a standardized method for stabilizing the patient and diminished the need to reorient the scans in the software later.
All subjects were anonymized, and all patient identifiers were deleted. New InVivo files were created for each subject and assigned an identification number. The corresponding chronologic age and sex were recorded. Therefore, the retrospective research data did not contain any identifiable protected health information. The institutional review board of the University of Florida Health Center approved the research protocol.
Using the InVivo software, a 3D denture frame cephalometric analysis was developed with 33 landmarks ( Table II ). These landmarks were selected on the reconstructed 3D volume and then refined in the axial, coronal, and sagittal slices using the slice locator feature in the software. Landmarks were selected using an optical mouse on a 27-in iMac computer (Apple, Cupertino, Calif). Since the InVivo program was not yet available for Macintosh software, Boot Camp, a multiboot utility included in the Apple Operating System, version OS X 10.9, assisted in installing a 64-bit version of the Windows 7 operating system (Microsoft, Redmond, Wash). An operator (J.C.C.), who was previously calibrated, selected the anatomic landmarks and performed the cephalometric analysis.
| Landmark | Abbreviation | Definition |
|---|---|---|
| Nasion | N | Midpoint of the frontonasal suture |
| Right orbitale | Or R | Most inferior point on the right infraorbital rim of the maxilla |
| Left orbitale | Or L | Lowest point on the left infraorbital rim of the maxilla |
| Medial orbitale | Med Or | Computer-generated medial (mean) point between the right and left orbitales |
| Right porion | Po R | Highest point on the upper margin of the right external auditory meatus |
| Left porion | Po L | Highest point on the upper margin of the left external auditory meatus |
| Sella turcica | S | Midpoint of the pituitary fossa |
| Basion | Ba | Midpoint of the anterior-inferior border of foramen magnum |
| Anterior nasal spine | ANS | Most anterior midpoint of the anterior nasal spine |
| Posterior nasal spine | PNS | Most posterior midpoint of the posterior nasal spine |
| A-point | A | Midpoint of the anterior limits of the apical base of the maxilla |
| Right condylion | Co R | Uppermost midpoint of the right condyle |
| Left condylion | Co L | Uppermost midpoint of the left condyle |
| Right gonion | Go R | Most lateral point on the right mandibular angle close to the bony gonion |
| Left gonion | Go L | Most lateral point on the left mandibular angle close to the bony gonion |
| Medial gonion | Med Go | Computer-generated medial (mean) point between the right and left gonions |
| Menton | Me | Midpoint of the lowest point on the mandibular symphysis |
| B-point | B | Midpoint of the anterior limits of the apical base of the mandible |
| Suprapogonion | PM | Midpoint of protuberance menti |
| Pogonion | Pog | Midpoint of the most anterior point of the mandibular symphysis |
| Right Xi point | Xi R | Point located on the geometric center of the right mandibular ramus |
| Left Xi point | Xi L | Point located on the geometric center of the left mandibular ramus |
| Medial Xi point | Med Xi | Computer-generated medial (mean) point between the right and left Xi points |
| U1 root tip | U1 root R | Maxillary right central incisor root tip |
| U1 incisal edge | U1 crown R | Midpoint on the incisal edge of the maxillary right central incisor |
| L1 root tip | L1 root R | Mandibular right central incisor root tip |
| L1 incisal edge | L1 crown R | Midpoint on the incisal edge of the mandibular right central incisor |
| Upper incisor point | U1 | Most mesial and incisal point of the maxillary left central incisor |
| U5 cusp tip | U5 R | Buccal cusp tip of the maxillary right second premolar |
| U7 cusp tip | U7 R | Distobuccal cusp tip of the maxillary right second molar |
| U5 cusp tip | U5 L | Buccal cusp tip of the maxillary left second premolar |
| U7 cusp tip | U7 L | Distobuccal cusp tip of the maxillary left second molar |
| Medial U5 | Med U5 | Computer-generated medial (mean) point between the right and left maxillary second premolar buccal cusp tips |
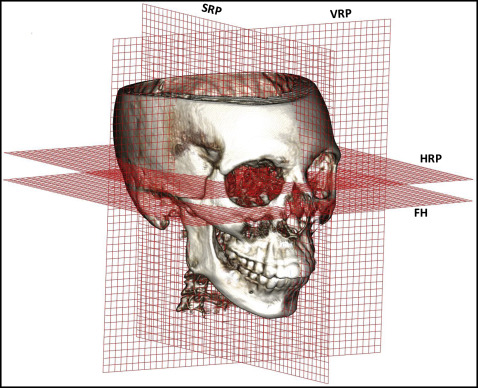
A coordinate system was defined using a plane parallel to the Frankfort horizontal but going through sella as the horizontal reference plane. Since 3 points define 3D planes, a computer-generated medial point (mean) between the right and left orbitales was created. The right and left porions completed the definition of the Frankfort horizontal plane. Authors of a recent study found that there tends to be less variation in natural head posture in the coronal axis, possibly because the temporal bones house the organs of equilibrium, which impart the sensory input for the spatial orientation of the head. This makes the Frankfort horizontal plane a logical starting reference plane on the coronal axis. The sagittal reference plane is defined as a plane perpendicular to the horizontal reference plane passing through sella and nasion. The vertical reference plane is perpendicular to both the horizontal reference plane and the sagittal reference plane passing through sella ( Fig 1 ). The analysis consisted of 20 angular and 6 linear measurements ( Tables III and IV , respectively).
| Angular measurement | Abbreviation | Definition |
|---|---|---|
| Facial plane | FP | Na-Pog line and Frankfort horizontal (FH) plane |
| Line from A-point to B-point to mandibular plane | AB-MP | A-B line and Me-Med Go line |
| Sella to nasion to A-point angle | SNA | S-N line and Na-A point line |
| Sella to nasion to B-point angle | SNB | S-N line and N-B point line |
| A-point to nasion to B-point angle | ANB | N-A line and Na-B-point line |
| Anteroposterior dysplasia indicator | APDI | FP angle ± AB plane angle ± FH-PP |
| Mandibular lateral deviation | MLD | ANS-Me line and Ba-N-ANS plane |
| Frankfort horizontal to the mandibular plane angle | FMA | Me-Med Go line and FH plane |
| Gonial angle right | Go R | 3D angle made by the right Co-right Go line and right Go-Me line ∗ |
| Gonial angle left | Go L | 3D angle made by the left Co-left Go line and left Go-Me line ∗ |
| Condylar axis right | Co axis R | 3D angle made by the right Co-Xi point line and right Xi point- Me line ∗ |
| Condylar axis left | Co axis L | 3D angle made by the left Co-Xi point line and left Xi point-Me line ∗ |
| Palatal plane to Frankfort horizontal | PP-FH | ANS-PNS line and FH plane |
| Lower facial height | LFHt | ANS-Med Xi point and Med Xi point-PM line |
| Palatal plane to mandibular plane | PP-MP | ANS-PNS line and FMA line |
| Right posterior occlusal plane to Frankfort horizontal | POP_R | 3D angle made by the line formed by the points Med U5 point-U7 cusp tip _R line and FH plane ∗ |
| Left posterior occlusal plane to Frankfort horizontal | POP_L | 3D angle made by the line formed by the points Med U5 point-U7 cusp tip_L line and FH plane ∗ |
| Posterior occlusal plane cant | POP cant | 3D angle made by the line formed by the points U7 cusp tip _R –U7 cusp tip _L line and FH plane † |
| Condylar cant | Co cant | 3D angle made by the Co_R-Co_L line and FH plane † |
| Gonial cant | Go cant | 3D angle made by the Go_R-Go_L line and FH plane † |
| Linear measurement | Abbreviation | Definition |
|---|---|---|
| Mandibular length right | MdL_R | Distance between Go_R and Me ∗ |
| Mandibular length left | MdL_L | Distance between Go_L and Me ∗ |
| Ramus height right | RamHt_R | Distance between Co_R and Go_R ∗ |
| Ramus height left | RamHt_L | Distance between Co_L and Go_L ∗ |
| Condylar deviation | Co dev | Distance between the anteroposterior position of the right (−) vs the left (+) condylions, measured perpendicular to the vertical reference plane † |
| Gonial deviation | Go dev | Distance between the anteroposterior position of the right (−) vs the left (+) gonions, measured perpendicular to the vertical reference plane † |
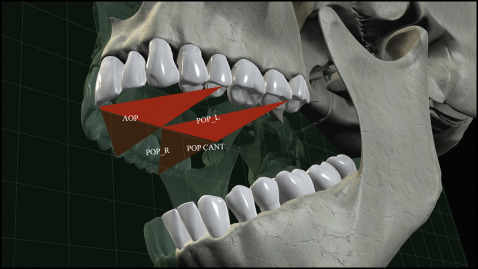
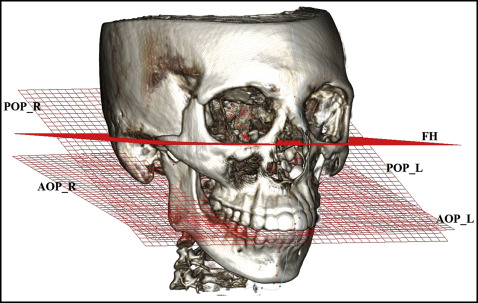
To define the 3D curved surface orientation of the maxillary occlusal plane, it was divided into anterior and posterior occlusal planes as described by Okuhashi et al. Occlusal landmarks were selected on the maxillary arch of the rendered 3D image as shown in Figure 2 . The POP was defined by 3 points. The first point was a computer-generated medial (mean) point between the right and left second premolar buccal cusp tips. The other 2 points were the distobuccal cusp tips of the second molars. To measure its effect on the right and left sagittal views, 2 lines were created from the medial point between the right and left second premolar buccal cusp tips to the distobuccal cusp tips of the second molars. These were defined as POP right and POP left. To measure this plane’s effect in the coronal and axial views, a third line was constructed from the distobuccal cusp tips of the second molars and named the POP cant ( Figs 2 and 3 ). This 3D definition of the POP measured against the Frankfort horizontal plane was then used to analyze its relationship to mandibular position and morphology ( Figs 2 and 3 ).
To determine the spatial position of the mandible in the coordinate system, several variables were selected or created. The variables describing the mandibular anteroposterior, vertical, and transverse dimensions are listed in Table V . The anteroposterior and vertical variables were borrowed from conventional 2D analyses and projected onto the sagittal and vertical reference planes accordingly.
| Variable | Class I Mean ± SD (n = 23) |
HA Class II Mean ± SD (n = 14) |
LA Class II Mean ± SD (n = 26) |
HA Class III Mean ± SD (n = 24) |
LA Class III Mean ± SD (n = 24) |
Shapiro-Wilk P value |
ANOVA P value |
|---|---|---|---|---|---|---|---|
| Age (y) | 16.5 ± 6.9 | 17.2 ± 9.3 | 14.8 ± 5.1 | 20.5 ± 11.3 | 20.7 ± 7.0 | 0.7 | 0.053 |
| Anteroposterior | |||||||
| Facial plane | 89.9 ± 2.0 | 85.3 ± 2.3 | 87.1 ± 2.5 | 92.6 ± 3.2 | 96.5 ± 3.2 | 0.1 | <0.0001 |
| APDI | 80.6 ± 1.6 | 74.3 ± 2.7 | 74.0 ± 2.4 | 93.9 ± 7.5 | 99.2 ± 5.9 | 0.1 | <0.0001 |
| SNA | 82.9 ± 2.0 | 82.6 ± 2.9 | 81.9 ± 3.5 | 81.6 ± 3.9 | 82.9 ± 3.1 | 0.9 | 0.481 |
| SNB | 79.3 ± 1.9 | 76.2 ± 2.1 | 76.5 ± 2.8 | 82.7 ± 4.0 | 85.7 ± 3.8 | 0.9 | <0.0001 |
| ANB ∗ | 3.6 ± 1.1 | 6.4 ± 1.1 | 5.4 ± 1.5 | −1.2 ± 2.5 | −2.7 ± 2.2 | 0.9 | <0.0001 |
| Vertical | |||||||
| FMA | 22.4 ± 5.3 | 31.9 ± 4.9 | 20.1 ± 4.0 | 29.7 ± 5.0 | 19.8 ± 3.1 | 0.1 | <0.0001 |
| PP-MP | 24.3 ± 5.3 | 32.0 ± 4.9 | 22.5 ± 3.6 | 29.3 ± 4.9 | 20.6 ± 4.1 | 1.0 | <0.0001 |
| AB-MP | 74.5 ± 5.2 | 73.3 ± 4.5 | 82.5 ± 2.9 | 56.5 ± 6.9 | 59.9 ± 5.3 | 0.1 | <0.0001 |
| LFHt | 42.9 ± 4.5 | 47.2 ± 4.3 | 40.8 ± 3.8 | 48.5 ± 4.6 | 40.8 ± 3.9 | 0.1 | <0.0001 |
| Transverse | |||||||
| MLD | −0.1 ± 3.6 | −0.5 ± 2.1 | −0.8 ± 3.1 | −0.1 ± 2.9 | −0.4 ± 3.8 | 0.1 | 0.63 |
| Co cant | 1.6 ± 1.4 | 0.3 ± 1.5 | 0.3 ± 1.7 | 0.3 ± 1.6 | 0.6 ± 1.9 | 0.4 | 0.05 |
| Go cant | 1.6 ± 1.9 | 0.5 ± 2.0 | 0.2 ± 2.1 | 0.4 ± 2.1 | 0.2 ± 1.8 | 0.3 | 0.06 |
| Co dev | 0.3 ± 2.7 | 0.2 ± 2.2 | 0.6 ± 2.0 | −0.4 ± 5.8 | 1.3 ± 2.4 | 0.1 | 0.56 |
| POP_L ∗ | 14.3 ± 5.3 | 19.9 ± 5.3 | 15.8 ± 5.6 | 13.2 ± 6.0 | 9.9 ± 4.2 | 0.8 | <0.0001 |
| POP_R ∗ | 17.3 ± 5.1 | 20.6 ± 3.4 | 15.6 ± 4.7 | 14.6 ± 6.2 | 9.6 ± 5.6 | 0.2 | <0.0001 |
| POP cant | 0.3 ± 1.8 | 0.3 ± 1.7 | 0.1 ± 1.5 | 0.0 ± 2.0 | −0.3 ± 2.6 | 0.5 | 0.62 |
Stay updated, free dental videos. Join our Telegram channel
VIDEdental - Online dental courses


