Introduction
The cervical vertebrae have been proposed as a method of determining biologic maturity. The purposes of this study were to establish a pattern of mandibular growth and to relate this pattern to the stages of cervical vertebral maturation.
Methods
Cephalometric radiographs, taken annually from ages 9 to 18 years, were evaluated for 90 boys from the Burlington Growth Center, Toronto, Ontario, Canada. Mandibular lengths were measured from articulare to gnathion, and incremental growth was determined. Cervical vertebral maturation stages were assessed by using a 6-stage method. Advanced, average, and delayed maturation groups were established.
Results
The prepubertal mandibular growth minimum velocity occurred during cervical stages 1 through 4 ( P = 0.7327). Peak mandibular growth velocity occurred most frequently during stage 4 in all 3 maturation groups, with a statistical difference in the average and delayed groups ( P <0.0001) and the advanced group ( P = 0.0143). The average number of years spent in stage 4 was 3.79 ( P <0.0001). The average amount of mandibular growth occurring during stage 4 was 9.40 mm ( P <0.0001). The average amount of growth in stages 5 and 6 combined was 7.09 mm.
Conclusions
Progression from cervical stages 1 through 6 does not occur annually; time spent in each stage varies depending on the stage and the maturation group. Cervical vertebral maturation stages cannot accurately identify the mandibular prepubertal growth minimum and therefore cannot predict the onset of the peak in mandibular growth. The cervical vertebral maturation stages should be used with other methods of biologic maturity assessment when considering both dentofacial orthopedic treatment and orthognathic surgery.
The timing of facial growth is an important factor in achieving optimal orthodontic treatment through dentofacial orthopedics and orthognathic surgery. Treatment planning and retention decisions are influenced by the amount of remaining growth, necessitating a need to accurately assess levels of skeletal maturity.
Numerous methods have been proposed to assess biologic maturity. Chronologic and dental ages are considered poor indictors of skeletal and craniofacial maturity. The appearance of secondary sex characteristics is a solid indicator that the ideal time for treatment involving growth modification has passed.
Skeletal age, as assessed by hand-wrist radiographs, provides an accurate determination of biologic maturity. Important differences exist between early, average, and late maturing children. Children with advanced skeletal age have a corresponding early circumpubertal growth spurt, and those with delayed skeletal development experience their spurt later. Children with average skeletal development show significant growth spurt variations. Late maturers demonstrate greater growth increments in all mandibular and maxillary measurements when compared with the average and early maturers, whereas average maturing children show greater mandibular growth than do early maturing children. During high-velocity periods of adolescent growth, advanced maturers express significantly more growth over shorter periods of time.
Skeletal maturation determination with cervical vertebrae uses radiographic images without the need for additional exposure to radiation. The process of assessing cervical vertebral maturation (CVM) is consistent among patients and between various ethnic groups.
There are 4 recognized methods of assessing CVM. The original Lamparski method is more effective in girls than in boys but incorporates vertebrae that can be obscured by the thyroid collar. The Hassel and Farman and the 5-stage CVM methods rely heavily on comparisons, making stage determination from a single radiograph difficult. The 6-stage cervical stage (CS) method better defines the cervical stages and relies less on interstage comparisons. Peak mandibular growth occurs between stages 3 and 4 in the 6-stage method.
All methods were previously considered reproducible, although there were great intraexaminer and interexaminer variations. However, Gabriel et al found the reproducibility of the CVM method to be poor. When comparisons between skeletal age assessment with the cervical vertebrae and assessments with hand-wrist x-rays were made, some investigators found the CVM method to be as accurate as the hand-wrist methods, but others found superiority in the hand-wrist method.
The optimal time to commence treatment is difficult to determine. No single method of assessing maturity level has been shown to be effective and accurate in all patients. The purposes of this study were to establish a definable pattern of mandibular growth and to relate this pattern to the stages of CVM.
Material and methods
The sample consisted solely of male subjects chosen from the longitudinal records of the Burlington Growth Center at the Faculty of Dentistry, University of Toronto Canada. To be included in the study, each subject had to have lateral cephalometric films, taken in centric occlusion, from chronologic ages 9 to 18 years. To maintain information relevance, any subject with greater than a 2-year span between available records was eliminated from the study. No other limitations were placed on the subjects, thereby eliminating the risk of bias. Eight hundred ninety radiographs from 90 subjects were evaluated. The same investigator (G.B.) made the cervical vertebral assessments and completed all tracings and measurements for mandibular length determinations.
Measurements of mandibular length, from articulare to gnathion, were made using a digital caliper accurate to within 0.01 mm. Incremental mandibular growth was determined by subtracting the previous year’s mandibular length from the next year’s length. For any record period missing annual data, the resulting mandibular measurement was divided in half to represent the 2 years in that record set.
Cervical vertebral stages were determined by using the method described by Baccetti et al. Before any stage determinations were made, an initial calibration session was held, first with Drs Franchi, Baccetti, and McNamara, followed by a second with Dr McNamara. All readings were made directly from the radiographs to eliminate tracing errors. Only the cervical vertebrae were visible at this time to ensure maximum contrast of the film.
Seventy-two randomly selected subjects had 4 films retraced and remeasured, and the vertebral stages were reread 2 months after the initial tracings. The number of subjects to be retraced was determined by using the 6 cervical vertebral stages with the formula, 6 × 6 × 2. The investigator was consistently blinded to subject and chronologic age. Reliability tests included the intraclass correlation (ICC) for continuous data (mandibular measurements) and kappa tests for the categorical data (vertebral stages). A second identification of the prepubertal minimum (PPM) and the peak mandibular growth (PMdG) velocities was done on these 72 subjects. Statistical analyses of the data included chi-square, Fisher exact, least squares means, 1-way analysis of variance (ANOVA), and repeated measures of ANOVA tests. Differences were deemed significant if the P values were less than 0.05.
Results
Kappa testing for cervical vertebral stage identification resulted in values ranging from 1.00 (perfect agreement) at age 9, .979 at age 18, .943 at PMdG, and .980 at the age just before PMdG. Although the results were in the “very good” range, they were less reproducible during PMdG and later ages. ICC testing was done for the continuous measurements of mandibular length. The measurements were considered identical if they were within 0.5 mm of each other. Results of .98 to .99 agreement were considered “excellent.”
ICC testing was also done for the identification of PPM and PMdG, resulting in a correlation of .936 for PPM with a 95% confidence interval of .897 to .960. The identification of PMdG showed a correlation of .987 with a confidence interval of .979 to .992. The wider confidence interval for PPM indicated less reproducible identification compared with PMdG.
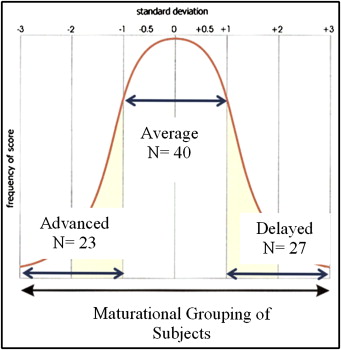
PMdG occurred at chronologic age 14.4 years with a standard deviation of 1.4 years. Based on this standard deviation, the sample was further divided into advanced, average, and delayed maturation groups ( Fig 1 ). The mean ages at PPM were 11.1 ± 0.69, 12.2 ± 0.93, and 13.2 ± 0.82 years for the advanced, average, and the delayed groups, respectively. The average time lapse between PPM and PMdG is shown in Table I .
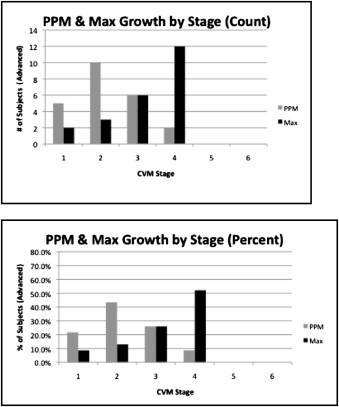
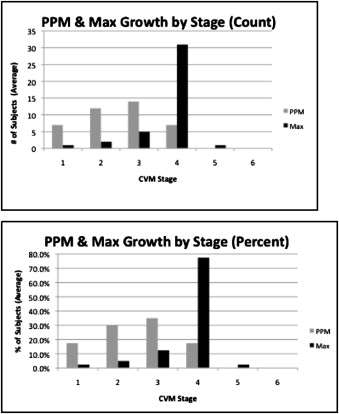
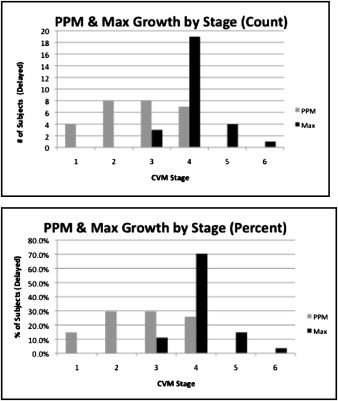
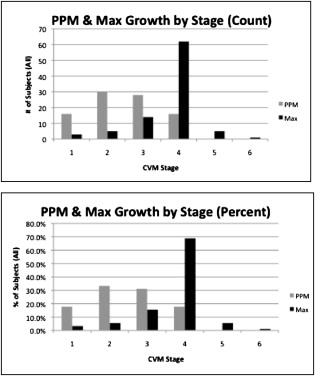
Figures 2 through 5 represent the cervical stages where the PPM and the PMdG occurred in the 3 maturation groups, both individually and combined. When the groups were combined, the Fisher exact test indicated no significant difference between the stages with regard to the probability that PPM would occur in any of the first 4 stages ( P = 0.7327). The test further indicated that a significant difference in the probability that the PMdG would occur in any of the 6 stages ( P = 0.0349), with CS 4 being the most common. When we evaluated the 3 maturation groups individually, the chi-square test indicated significant differences (advanced group, P = 0.0143; average and delayed groups, P <0.0001) in the stage at which PMdG occurred; CS 4 was the most common stage for the attainment of PMdG.
ANOVA and repeated-measures ANOVA analyses indicated significant differences between the 3 maturation groups with regard to the time spent in each of the 6 vertebral stages ( P <0.0001) ( Table II ). At CS 3, the advanced group was significantly different from the delayed group ( P = 0.018) but not from the average group, whereas the average group was significantly different from the delayed group ( P = 0.035). At CS 4, the advanced group was significantly different from both the average and delayed groups, ( P = 0.038 and 0.033, respectively) with no differences between the average and delayed groups at CS 4.
| Data | Advanced/delayed | Total |
|---|---|---|
| Average of CS 1 | Advanced | 1.51 |
| Average | 1.54 | |
| Delayed | 2.51 | |
| Average of CS 2 | Advanced | 1.75 |
| Average | 2.08 | |
| Delayed | 1.87 | |
| Average of CS 3 | Advanced | 1.53 |
| Average | 1.63 | |
| Delayed | 2.25 | |
| Average of CS 4 | Advanced | 2.77 |
| Average | 4.07 | |
| Delayed | 4.24 | |
| Average of CS 5 | Advanced | 2.71 |
| Average | 3.12 | |
| Delayed | 2.93 | |
| Average of CS 6 | Advanced | 3.59 |
| Average | 3.32 | |
| Delayed | 3.10 | |
| Total average of CS 1 | 1.82 | |
| Total average of CS 2 | 1.92 | |
| Total average of CS 3 | 1.77 | |
| Total average of CS 4 | 3.79 | |
| Total average of CS 5 | 2.94 | |
| Total average of CS 6 | 3.39 |
ANOVA indicated a significant difference in the amount of growth that occurred during each of the 6 cervical stages ( P <0.0001) ( Table III ). The repeated measures ANOVA test indicated significant differences at CS 4 between the advanced group and both the average and the delayed groups ( P = 0.001 and 0.0002, respectively), but no difference was found between the average and delayed groups.
| Data | Advanced/delayed | Total |
|---|---|---|
| Average of CS 1 | Advanced | 4.21 |
| Average | 3.25 | |
| Delayed | 4.77 | |
| Average of CS 2 | Advanced | 3.82 |
| Average | 4.37 | |
| Delayed | 3.47 | |
| Average of CS 3 | Advanced | 4.83 |
| Average | 3.92 | |
| Delayed | 5.10 | |
| Average of CS 4 | Advanced | 7.06 |
| Average | 9.96 | |
| Delayed | 10.57 | |
| Average of CS 5 | Advanced | 3.28 |
| Average | 4.04 | |
| Delayed | 4.70 | |
| Average of CS 6 | Advanced | 3.08 |
| Average | 3.53 | |
| Delayed | 2.77 | |
| Total average of CS 1 | 3.89 | |
| Total average of CS 2 | 3.92 | |
| Total average of CS 3 | 4.47 | |
| Total average of CS 4 | 9.40 | |
| Total average of CS 5 | 3.95 | |
| Total average of CS 6 | 3.14 |
Results
Kappa testing for cervical vertebral stage identification resulted in values ranging from 1.00 (perfect agreement) at age 9, .979 at age 18, .943 at PMdG, and .980 at the age just before PMdG. Although the results were in the “very good” range, they were less reproducible during PMdG and later ages. ICC testing was done for the continuous measurements of mandibular length. The measurements were considered identical if they were within 0.5 mm of each other. Results of .98 to .99 agreement were considered “excellent.”
ICC testing was also done for the identification of PPM and PMdG, resulting in a correlation of .936 for PPM with a 95% confidence interval of .897 to .960. The identification of PMdG showed a correlation of .987 with a confidence interval of .979 to .992. The wider confidence interval for PPM indicated less reproducible identification compared with PMdG.
PMdG occurred at chronologic age 14.4 years with a standard deviation of 1.4 years. Based on this standard deviation, the sample was further divided into advanced, average, and delayed maturation groups ( Fig 1 ). The mean ages at PPM were 11.1 ± 0.69, 12.2 ± 0.93, and 13.2 ± 0.82 years for the advanced, average, and the delayed groups, respectively. The average time lapse between PPM and PMdG is shown in Table I .


