Introduction
The purpose of this study was to develop the use of a biologic marker, insulin-like growth factor (IGF-1), as an indicator for the timing and intensity of mandibular growth. This was done by measuring annual changes in mandibular length and studying how they relate to blood-spot IGF-1 measurements and cervical stages.
Methods
Twenty-five patients (12 female, 13 male) from an orthodontic population were longitudinally evaluated for annual IGF-1 level, cervical stage, and mandibular length. The patients’ follow-up periods ranged between 1 and 5 years. A total of 43 annual time intervals were gathered (17 female, 26 male). Annual mandibular growth was related to changes in blood-spot IGF-1 levels over each observation period.
Results
When the whole sample was pooled into 1 group, we found a statistically significant mild to moderate correlation between the percentages of change in mandibular length and in IGF-1 levels (r = 0.4, P = 0.008). When the sample was divided based on whether the IGF-1 levels were increasing or decreasing at each yearly interval, the group with ascending IGF-1 levels had significantly more mandibular growth than did the group with descending IGF-1 levels (3.5 and 1.3 mm, respectively; P = 0.026). The ascending group had a moderate to high correlation between average IGF-1 levels and the amount of mandibular growth for each observation period. Observation periods with ascending IGF-1 levels and an average level greater than 250 μg per liter had significantly greater annual mandibular growth than did the rest of the patients with ascending IGF-1 levels (5.6 and 2.1 mm, respectively).
Conclusions
Blood-spot IGF-1 testing is a promising tool for predicting the timing and the intensity of the mandibular growth spurt without the restrictions involved with radiographic techniques for assessing skeletal maturity. More research is necessary to validate these results in a different population by using more advanced imaging tools and a larger sample size. The relationship between IGF-1 levels and mandibular growth after the pubertal growth spurt is not fully understood.
Successful treatment of many orthodontic problems depends to a great extent on the amount of mandibular growth patients experience during treatment. Traditionally, evaluations of hand-wrist radiographs and cervical vertebrae have been used to predict the timing of the mandibular growth spurt to either take advantage of it or plan to start treatment before or after it. Several studies have shown that the treatment of skeletal Class II patients with functional appliances is more successful when initiated during the adolescent growth spurt. Because of the radiographic nature of these techniques, they often cannot be performed more than once a year. In addition to the potential harm from radiographic exposure, these techniques cannot determine the intensity of the mandibular growth spurt in a particular patient.
Insulin-like growth factor 1 (IGF-1) is a growth hormone-dependent peptide that locally and systemically stimulates growth. Before puberty, IGF-1 levels depend on growth hormone levels, but, with the onset of puberty, their production can also be directly stimulated by androgens such as testosterone. In-vivo and in-vitro studies have also demonstrated the sensitivity of mandibular condylar growth to changes in IGF-1 levels.
Because growth hormone levels fluctuate throughout the day, IGF-1 is often used in the medical profession to diagnose growth hormone disturbances and assess their severity and response to treatment. More recently, blood-spot IGF-1 testing has been used as an alternative to traditional serum testing, since it provides greater patient comfort and easier handling, and can be performed by the patient at home and sent to a laboratory. The process involves a small finger prick identical to what would be necessary for a blood-sugar test. Moreover, studies have shown that this form of testing provides results that accurately reflect serum IGF-1 levels. Masoud et al cross-sectionally demonstrated the relationship between blood-spot IGF-1 levels and traditional radiographic techniques of determining skeletal maturity (cervical vertebrae, hand-wrist radiographs). Despite great individual variations, IGF-1 levels tended to be higher in patients who were in their radiographically determined growth spurt. This held true for both the hand-wrist and the cervical vertebral maturation techniques.
The purposes of this study were to longitudinally study the relationship between IGF-1 levels and mandibular length, and to propose a method for predicting the timing and intensity of the mandibular growth spurt.
Material and methods
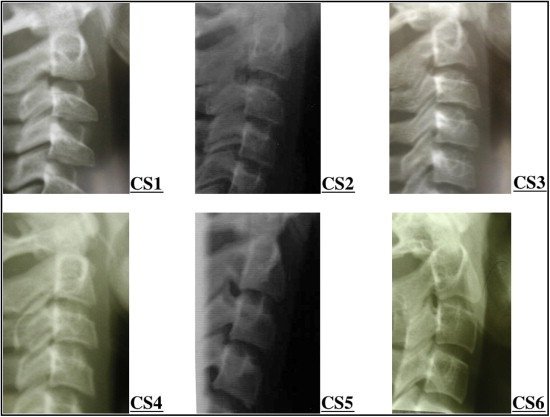
The sample included 43 time intervals of 12 months (± 2 months) (17 female and 26 male intervals) gathered from 25 subjects (12 female, 13 male) between the ages of 9 and 18 years. The inclusion criteria were patients who were about to begin orthodontic treatment, in active treatment, or in posttreatment follow-up. Exclusion criteria included patients with systemic diseases, growth abnormalities, or bleeding disorders. Eighty-seven patients were initially enrolled in the study, but, over the 5-year follow-up period, the sample size experienced gradual attrition until it reached 5 subjects at the sixth time point when the 5-year follow-up period was over. The study protocol was approved by the ethical committee at the faculty of dentistry at King Abdulaziz University in Jeddah, Saudi Arabia, and the institutional review board at the Harvard School of Dental Medicine, Boston, Mass. True randomization of the population was ethically impossible, but any orthodontic patient who satisfied the inclusion criteria and agreed to participate in the study during our enrollment period was included without further selection. As a part of standard orthodontic records, lateral cephalomteric radiographs were obtained and questions regarding age, puberty, and history of blood disorders were answered by the parents or the patients. Each patient had his or her lateral cephalometric radiograph, height and weight measurements, and a blood-spot sample obtained within 1 week of each other for each time interval. The blood-spot samples were collected by using kits donated by ZRT laboratories (Beaverton, Ore) and were stored in sealed plastic bags in a freezer (−18°C) for no more than 6 months. The samples were sent to ZRT Laboratory and assayed by radioimmunoassay. All the patients’ cephalometric radiographs were traced by an author (H.Y.A.M.) using VistaDent OC (version 4.2.28; Dentsply GAC, Homewood, Ala). Calibration of the radiographs was performed by using a metal ruler that was positioned at the top right corner of the film and exposed with the patient. The mandibular length was measured from condylion (most superior posterior point on the condyle) to gnathion (most anterior inferior point on the hard tissue chin). The traced condyle was always the one that resulted in the greatest the mandibular length. The same author traced 5 cephalometric radiographs and then traced the same radiographs 1 week later to evaluate intraexaminer reliability. The intraclass correlation coefficient for the mandibular length measurement was 0.984. If there was doubt about the position of the condyle, the radiographs were shown to another author (M.I.M.) for a second opinion. The cervical vertebrae were staged by using the 6 stages described by Bacetti et al, and the images in Figure 1 were used as references for each stage to assist in the staging. The laboratory that measured the IGF-1 levels ,and both authors who were involved in evaluating the radiographs were blinded to each other’s results to eliminate bias. The data were entered into SPSS software (version 18; SPSS for Windows, SPSS, Chicago, Ill) and analyzed.
Results
Table I shows the numbers of subjects for each cervical stage and the average amount of mandibular growth observed during the year after the appearance of each cervical stage. This table shows 44 data sets (not 43, as in the rest of our results), since 1 patient had missing IGF-1 measurements for 1 time point.
| Cervical stage | n | Female | Male | Mean mandibular growth (mm) | SD | SE | 95% CI for mean | Minimum | Maximum | |
|---|---|---|---|---|---|---|---|---|---|---|
| Lower bound | Upper bound | |||||||||
| 1 | 10 | 0 | 10 | 2.6000 | 1.34990 | 0.42687 | 1.6343 | 3.5657 | 0.00 | 4.00 |
| 2 | 9 | 2 | 7 | 2.8889 | 2.97676 | 0.99225 | 0.6007 | 5.1770 | 0.00 | 9.00 |
| 3 | 4 | 1 | 3 | 3.5000 | 3.10913 | 1.55456 | −1.4473 | 8.4473 | 1.00 | 8.00 |
| 4 | 17 | 11 | 6 | 1.5882 | 2.15229 | 0.52201 | 0.4816 | 2.6948 | −1.00 | 8.00 |
| 5 | 4 | 3 | 1 | 1.5000 | 1.73205 | 0.86603 | −1.2561 | 4.2561 | 0.00 | 4.00 |
| 6 | 0 | 0 | 0 | – | – | – | – | – | – | – |
| Total | 44 | 17 | 27 | 2.2500 | 2.26320 | 0.34119 | 1.5619 | 2.9381 | −1.00 | 9.00 |
Table II shows the relationship between the percentages of change in mandibular length and blood-spot IGF-1 level. There was a significant, mild to moderate, positive correlation between the 2 values (r = 0.4; P = 0.008). The intervals with IGF-1 levels that increased over the 12-month follow-up period (ascending group) had a mean mandibular growth of 3.4615 mm (± 2.93301 mm), and those with IGF-1 levels decreasing over the follow-up period (descending group) had an average annual growth of 1.3077 mm (± 1.18213 mm). The difference between these means was statistically significant ( P = 0.026). The ascending and descending groups had unequal sample sizes, so 13 patients were randomly selected from the descending group for comparison with the ascending group to equalize the variances of the 2 groups ( Table III ). Moreover, the ascending group had a moderate to high correlation coefficient (r = 0.655; P = 0.015) between the average IGF-1 level for each interval and the amount of mandibular growth measured over the same observation period ( Table IV ). The ascending group was further subdivided into intervals with average IGF-1 values of less than 250 μg per liter and 250 μg per liter and above. The group with average IGF-1 levels of 250 μg per liter and above had a mean annual mandibular growth of 5.6 mm. This was significantly greater than the group with average IGF-1 measurements below 250 μg per liter; this group had a mean annual mandibular growth of 2.125 mm ( Table V ). The descending group had no statistically significant correlation between the mean IGF-1 levels for each interval and the amount of mandibular growth. However, unlike the rest of groups we looked at, this group had enough patients to divide it into male and female groups. When this was done, the females were found to have a significant negative correlation between changes in IGF-1 levels and mandibular lengths ( Table VI ).
| Change in IGF-1 (%) | Change in mandibular length (%) | |
|---|---|---|
| IGF increase (%) | ||
| Pearson correlation | 1 | 0.400 ∗ |
| Sig (2-tailed) | 0.008 | |
| n | 43 (F, 17; M, 26) | 43 (F, 17; M, 26) |
| Group statistics | |||||
|---|---|---|---|---|---|
| IGF group | n | Mean mandibular growth (mm) | SD | SEM | |
| Mandibular growth | Ascending levels | 13 | 3.4615 | 2.93301 | 0.81347 |
| Descending levels | 13 | 1.3077 | 1.18213 | 0.32786 | |
| Independent samples test | |||||||||
|---|---|---|---|---|---|---|---|---|---|
| Levene test for equality of variances | t test for equality of means | ||||||||
| F | Sig | t | df | Sig (2-tailed) | Mean difference | SE difference | 95% CI of the difference | ||
| Lower bound | Upper bound | ||||||||
| Mandibular growth | |||||||||
| Equal variances assumed | 8.229 | 0.008 | 2.456 | 24 | 0.022 | 2.15385 | 0.87706 | 0.34369 | 3.96400 |
| Equal variances not assumed | 2.456 | 15.798 | 0.026 | 2.15385 | 0.87706 | 0.29264 | 4.01506 | ||
| Correlations ∗ | ||
|---|---|---|
| Mandibular growth | Average IGF-1 levels | |
| Mandibular growth | ||
| Pearson correlation | 1 | 0.655 † |
| Sig (2-tailed) | 0.015 | |
| n | 13 | 13 |
| Average IGF-1 levels | ||
| Pearson correlation | 0.655 † | 1 |
| Sig (2-tailed) | 0.015 | |
| n | 13 | 13 |
| Group statistics | ||||||
|---|---|---|---|---|---|---|
| IGF group | Avg IGF group | n | Mean mandibular growth (mm) | SD | SEM | |
| Ascending levels | Mandibular growth | ≥250 μg/L | 5 | 5.6000 | 2.88097 | 1.28841 |
| <250 μg/L | 8 | 2.1250 | 2.16712 | 0.76619 | ||
| Independent samples test | |||||||||||
|---|---|---|---|---|---|---|---|---|---|---|---|
| IGF group | Levene test for equality of variances | t test for equality of means | |||||||||
| F | Sig | t | df | Sig (2-tailed) | Mean difference | SE difference | 95% CI of the difference | ||||
| Lower bound | Upper bound | ||||||||||
| Ascending levels | MndLG | Equal variances assumed | 0.866 | 0.372 | 2.487 | 11 | 0.030 | 3.47500 | 1.39722 | 0.39975 | 6.55025 |
| Equal variances not assumed | 2.318 | 6.841 | 0.054 | 3.47500 | 1.49902 | −0.08643 | 7.03643 | ||||
| IGF-1 group | Sex | Mandibular growth (mm) | Change in IGF-1 (%) | ||
|---|---|---|---|---|---|
| Descending levels | Male | MndLG | Pearson correlation | 1 | 0.239 |
| Sig (2-tailed) | 0.339 | ||||
| n | 18 | 18 | |||
| IGF change (%) | Pearson correlation | 0.239 | 1 | ||
| Sig (2-tailed) | 0.339 | ||||
| n | 18 | 18 | |||
| Female | MndLG | Pearson correlation | 1 | −0.640 ∗ | |
| Sig (2-tailed) | 0.025 | ||||
| n | 12 | 12 | |||
| IGF change (%) | Pearson correlation | −0.640 ∗ | 1 | ||
| Sig (2-tailed) | 0.025 | ||||
| n | 12 | 12 | |||
Stay updated, free dental videos. Join our Telegram channel
VIDEdental - Online dental courses


