Introduction
In this study, we aimed to compare treatment efficacy and postsurgical stability between minimal presurgical orthodontics and conventional presurgical orthodontics for patients with skeletal Class III malocclusion.
Methods
Forty patients received minimal presurgical orthodontics (n = 20) or conventional presurgical orthodontics (n = 20). Lateral cephalograms were obtained before treatment, before orthognathic surgery, and at 1 week, 3 months, 6 months, and 12 months after surgery.
Results
Changes of overjet and mandibular incisal angle before surgery were greater in the conventional presurgical orthodontics group than in the minimal presurgical orthodontics group. Postsurgical horizontal changes in Points A and B, overjet, and mandibular incisal angle showed significant differences among the time points. Most of the horizontal and vertical relapses in the maxilla and the mandible occurred within the first 6 months in both groups.
Conclusions
Minimal presurgical orthodontics and conventional presurgical orthodontics showed similar extents and directions of skeletal changes in patients with Class III malocclusion. However, orthodontists and surgeons should preoperatively consider the postsurgical counterclockwise rotation of the mandible when using minimal presurgical orthodontics. Close and frequent observations are recommended in the early postsurgical stages.
Highlights
- •
Minimal and conventional presurgical orthodontics for skeletal Class III patients were compared.
- •
Treatment outcomes were assessed after a year.
- •
Skeletal changes were similar in the groups.
- •
Counterclockwise rotation of the mandible should be considered for minimal presurgical orthodontics patients.
Severe skeletal Class III malocclusions are commonly corrected by combined orthognathic surgery and orthodontic treatment. To show the true severity of the skeletal discrepancies and maximize the stability of the postsurgical occlusion, conventional presurgical orthodontic treatment (CPO), which involves aligning, leveling, decompensating, and coordinating the 2 arches, is performed. However, this is a time-consuming process. Luther et al reported that the average presurgical treatment duration was 17 months (range, 7-47 months). It is characterized by progressive deterioration of facial esthetics and dental function because of decompensation of the anterior teeth. Although patients are motivated by the thought of eventual improvement in their facial appearance, presurgical treatment can result in poor compliance and negative effects on patients’ self-confidence and social interactions.
Recently, the surgery-first approach was introduced to correct skeletal problems without presurgical orthodontic treatment. The surgery-first approach clearly has the advantages of an initial improvement in facial esthetics, patient satisfaction, and a positive influence on psychosocial aspects. However, it can increase the risk of relapse with a relatively unstable postsurgical occlusion. Facial esthetics and surgical stability should carry the same weight as the fundamental prerequisites for orthodontic-orthognathic treatment. Therefore, a new method of minimal presurgical orthodontics (MPO) not longer than 6 months has been proposed for patients who received orthognathic surgery. MPO focuses on eliminating or minimizing surgical occlusal interferences by intruding the overerupted teeth and coordinating the maxillary and mandibular arches. In addition to the advantage of initially improved facial esthetics, the postsurgical phenomenon of rapid regional movement results in a significantly shorter time for patients treated with MPO. Moreover, the modified position of soft tissues can provide a better environment and less resistance for tooth movement.
Although the popularity of the surgery-first approach and MPO has recently increased, relatively few reports based on homogeneous samples are available. Some reports have involved multisegmental LeFort I osteotomies or buccal interdental corticotomies. Those procdures may complicate the surgery, prolong the surgical duration, raise the risk of blood transfusion, and increase the surgical failure rate. Moreover, they can even create complications such as a palatal fistula during osteogenesis. Some studies evaluating the surgery-first approach and MPO did not include controls or patients who underwent CPO for comparison. In addition, serial lateral cephalograms traced in most of the published studies were completed at the debonding stage and showed large interindividual variations. Moreover, most studies on postsurgical stability of surgery-first approach and MPO did not include close and strict postsurgical monitoring at specific time points, except for 1 study that evaluated the postsurgical stability of surgery-first approach with intraoral vertical ramus osteotomy for 12 months.
In this study, we aimed to compare the treatment efficacy, and postsurgical dental and skeletal stability between MPO and CPO for patients with skeletal Class III malocclusion who had orthognathic surgery. The null hyotheses were that MPO and CPO have similar efficacy, and that dental and skeletal stabilities in the MPO group are not worse compared with the CPO group.
Material and methods
This retrospective cohort study included consecutive patients who underwent orthognathic and orthodontic treatment at Peking University School and Hospital of Stomatology in Beijing, China, from 2010 to 2014. The inclusion criteria were as follows: skeletal Class III malocclusion (ANB, ≤0°, with or without facial asymmetry); no extractions, except for the third molars; history of bimaxillary surgery (1-piece LeFort I osteotomy, bilateral sagittal split ramus osteotomy, and genioplasty, if required) with rigid fixation; and a complete series of identifiable lateral cephalograms. Patients with cleft lip or palate, syndromic craniofacial deformities, or a history of correction of Class III deformities by other techniques or genioplasty only were excluded. This study was approved by the institutional review board of Peking University School and Hospital of Stomatology (RB00001052-11039). Orthodontic treatment and orthognathic surgery were performed by 2 orthodontists (Y.Z., Y.Z.) and 2 surgeons (Z.L., X.W.). The orthodontists used the same archwire procedures (0.014-in, 0.016-in, 0.016 × 0.022-in, and 0.019 × 0.025-in nickel-titanium; and 0.019 × 0.025-in stainless steel). Two surgeons with more than 20 years of orthognathic surgical experience (150-200 patients per year) performed the surgeries. Every surgical plan was determined in team discussions.
A total of 40 patients received MPO (n = 20) or CPO (n = 20). All patients were assessed to be suitable for MPO, but those in the MPO group were more eager for better and faster esthetic improvement without progressive deterioration. The MPO group included 14 female and 6 male patients aged 15 to 25 years (mean, 20.9 ± 2.1 years); the CPO group included 8 female and 12 male patients aged 16 to 34 years (mean, 22.5 ± 4.9 years). In the MPO group, the average presurgical treatment duration was 3.3 months (range, 0.5-6 months). Active orthodontic treatment was performed to eliminate surgical interferences. In the CPO group, the presurgical phase, including leveling and alignment, space consolidation, and general coordination of both arches, spanned an average of 18.1 months (range, 16-34 months). No expansion protocol except orthodontic wires (associated with miniscrews when necessary) was performed in either group. Face-bow transfer, dental cast mounting, and paper surgery were performed for all patients. In addition to the LeFort I osteotomy and the bilateral sagittal split ramus osteotomy, 19 patients in the MPO group and 16 in the CPO group had undergone genioplasty. Rigid internal fixation with 4 microplates at the bilateral pyriform aperture and zygomaticomaxillary crest and 2 miniplates at the mandibular osteotomy site, together with monocortical screws, were inserted during the LeFort I osteotomy and the bilateral sagittal split ramus osteotomy. Another 2 miniplates were added to patients having genioplasty. All patients had braces during the whole treatment. Patients in the MPO group had surgery with nickel-titanium wires, which allowed postsurgical orthodontic treatment to start as soon as possible. Because the stiffness of nickel-titanium archwires is relatively too low to bear the intermaxillary fixation force, intermaxillary fixation with miniscrews was routinely used to maintain the maxillary and mandibular positions before and after wafer removal, whereas elastics between the stainless steel wires were used in the CPO group.
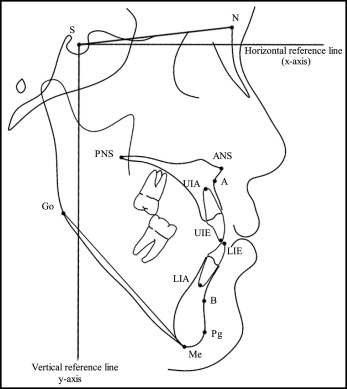
Lateral cephalography (OP100; Instrumentarium Tuusula, Finland) was performed before treatment (T0), before surgery (T1), and 1 week (T2), 3 months (T3), 6 months (T4), and 12 months (T5) after surgery. All cephalograms were digitized for cephalometric analysis with Ceph_analysis software (developed by Peking University) by the same observer blinded to the clinical progress of patients. The horizontal reference line passed through sella turcica and 7° below the sella-nasion plane, and the vertical reference line was perpendicular to horizontal reference line at sella ( Fig 1 ). The definitions of the measured variables are summarized in Table I .
| Measurement | Definition |
|---|---|
| HRL | Line through sella and 7° below the SN plane |
| VRL | Line through sella and perpendicular to HRL |
| A-x (mm) | Perpendicular distance from A-point to VRL |
| B-x (mm) | Perpendicular distance from B-point to VRL |
| ANS-y (mm) | Perpendicular distance from ANS to HRL |
| PNS-y (mm) | Perpendicular distance from PNS to HRL |
| Me-y (mm) | Perpendicular distance from Me to HRL |
| ANS-Me (mm) | Distance between ANS and Me parallel to VRL |
| Overjet (mm) | Distance between UIE and LIE parallel to VRL |
| Overbite (mm) | Distance between upper UIE and LIE parallel to HRL |
| MP/HRL (°) | Angle between the mandibular plane (Go-Me line) and HRL |
| UI/PP (°) | Angle between the UI axis (UIA-UIE line) and palatal plane (PNS-ANS line) |
| IMPA (°) | Angle between the mandibular incisor axis (LIA-LIE line) and the mandibular plane |
Statistical analysis
Statistical analyses were performed using SPSS software (version 16.0; SPSS, Chicago, Ill). To evaluate intraexaminer reliability, 10 randomly selected films from the 40 patients were retraced and digitized at 4-week intervals. Intraclass correlation coefficients were calculated and showed intraexaminer reliability of more than 0.997. The independent-sample t test was used to compare the initial measurements, presurgical treatment durations, and progressive changes between the MPO and CPO groups at the serial time points (significant at P <0.05).
Results
There were no significant differences in the initial skeletal and dental measurements between the MPO and CPO groups ( Table II ).
| MPO | CPO | P | |||
|---|---|---|---|---|---|
| Mean | SD | Mean | SD | ||
| SNA (°) | 81.11 | 3.99 | 80.15 | 2.79 | 0.38 |
| SNB (°) | 85.02 | 4.19 | 85.44 | 4.01 | 0.75 |
| ANB (°) | −3.90 | 2.83 | −5.30 | 2.86 | 0.13 |
| SNPg (°) | 85.34 | 4.71 | 86.11 | 4.27 | 0.59 |
| ANS-Me (mm) | 69.65 | 4.66 | 70.44 | 6.74 | 0.67 |
| MP/HRL (°) | 29.10 | 7.66 | 28.23 | 4.69 | 0.67 |
| Overjet (mm) | −2.17 | 2.75 | −1.58 | 2.56 | 0.49 |
| Overbite (mm) | −0.20 | 1.99 | −0.07 | 3.28 | 0.88 |
| Maxillary crowding (mm) | 1.63 | 1.44 | 1.30 | 1.30 | 0.46 |
| Mandibular crowding (mm) | 1.85 | 2.03 | 2.25 | 1.45 | 0.48 |
| UI/PP (°) | 59.99 | 6.33 | 63.02 | 4.77 | 0.10 |
| IMPA (°) | 77.55 | 8.00 | 75.08 | 7.26 | 0.31 |
As shown in Table III , the presurgical and total durations in the MPO group were significantly shorter than those in the CPO group ( P <0.001). A comparison of the mean changes in the cephalometric parameters from initial treatment to orthognathic surgery (T0-T1) between the MPO and CPO groups is given in Table IV . The changes in IMPA (MPO, 0.41°; CPO, 7.72°; P <0.01) and overjet (MPO, −0.08 mm; CPO, −3.14 mm; P <0.001) were significantly different between the groups. However, there was no statistically significant difference in the skeletal and dental changes from T1 to T2 between the MPO and CPO groups ( Table IV ). The maxilla in the MPO group showed an average forward movement of A-point by 3.05 mm. Meanwhile, the anterior nasal spine in the maxilla moved slightly downward by 0.25 mm, whereas the posterior nasal spine in the maxilla moved upward by 1.18 mm. The CPO group achieved surgical correction of the maxilla by a 3.24-mm forward movement of A-point, a 0.56-mm downward movement of anterior nasal spine, and a 0.29-mm upward movement (slight) of posterior nasal spine. The mandible was set back by movements in B-point of 5.25 mm in the MPO group and 6.57 mm in the CPO group. In addition, menton in the mandible tended to move 0.38 mm upward in the MPO group and 0.57 mm downward in the CPO group, with no significant differences between the groups. With regard to changes from T0 to T2 ( Table IV ), there were no significant differences in any parameter except IMPA (MPO, 0.20°; CPO, 8.80°; P <0.001) between the groups. At T5, there were 14 patients in the MPO group and 9 in the CPO group with Class I molar relationships, closed bites anteriorly, and coincident midlines at 1 year.
| MPO | CPO | P | |||
|---|---|---|---|---|---|
| Mean | SD | Mean | SD | ||
| Presurgical duration | 3.30 | 1.98 | 18.10 | 5.61 | <0.001 ∗ |
| Total duration | 20.40 | 6.37 | 27.50 | 4.51 | <0.001 ∗ |
| T0-T1 | T1-T2 | T0-T2 | |||||||||||||
|---|---|---|---|---|---|---|---|---|---|---|---|---|---|---|---|
| MPO | CPO | P | MPO | CPO | P | MPO | CPO | P | |||||||
| Mean | SD | Mean | SD | Mean | SD | Mean | SD | Mean | SD | Mean | SD | ||||
| Horizontal changes (mm) | |||||||||||||||
| A-x | 0.60 | −1.18 | 0.11 | 1.95 | 0.34 | 3.05 | 2.22 | 3.24 | 1.98 | 0.78 | 3.65 | 2.15 | 3.35 | 2.43 | 0.68 |
| B-x | 0.22 | 2.40 | 0.06 | 2.13 | 0.83 | −5.25 | 3.21 | −6.57 | 3.02 | 0.19 | −5.03 | 3.50 | −6.51 | 3.99 | 0.22 |
| Pg-x | 0.17 | 2.37 | −0.04 | 2.36 | 0.77 | −2.87 | 4.38 | −4.73 | 4.00 | 0.17 | −2.69 | 4.66 | −4.77 | 5.15 | 0.19 |
| Overjet | −0.08 | 1.14 | −3.14 | 1.84 | <0.001 ∗ | 6.73 | 3.72 | 8.61 | 2.78 | 0.08 | 6.66 | 3.04 | 5.47 | 3.10 | 0.23 |
| Vertical changes (mm) | |||||||||||||||
| ANS-y | −0.13 | 1.02 | 0.07 | 1.20 | 0.58 | 0.25 | 2.13 | 0.56 | 2.12 | 0.64 | 0.12 | 2.34 | 0.63 | 2.31 | 0.49 |
| PNS-y | −0.02 | 0.73 | −0.11 | 0.66 | 0.69 | −1.18 | 1.25 | −0.29 | 1.67 | 0.06 | −1.20 | 1.47 | −0.39 | 1.55 | 0.10 |
| B-y | 1.12 | 2.54 | 1.25 | 2.39 | 0.87 | −0.20 | 3.80 | 0.05 | 3.82 | 0.84 | 0.92 | 3.98 | 1.30 | 3.70 | 0.76 |
| Me-y | 1.03 | 2.68 | 0.61 | 1.68 | 0.55 | −0.38 | 2.51 | 0.57 | 3.31 | 0.31 | 0.65 | 3.27 | 1.18 | 3.22 | 0.61 |
| Overbite | −0.21 | 0.84 | −0.50 | 2.13 | 0.57 | 1.32 | 1.91 | 1.41 | 2.29 | 0.89 | 1.11 | 2.29 | 0.91 | 3.23 | 0.82 |
| Angular changes (°) | |||||||||||||||
| SNA | −1.58 | 1.31 | 0.18 | 1.59 | 0.28 | 2.44 | 2.38 | 2.95 | 2.33 | 0.56 | 4.02 | 2.09 | 3.13 | 2.04 | 0.18 |
| SNB | −0.01 | 0.85 | 0.03 | 1.28 | 0.90 | −2.62 | 1.85 | −3.61 | 1.72 | 0.09 | −2.63 | 1.89 | −3.58 | 2.10 | 0.14 |
| ANB | 0.66 | 0.84 | 0.15 | 1.20 | 0.13 | 6.00 | 2.62 | 6.56 | 2.75 | 0.51 | 6.65 | 2.52 | 6.71 | 2.59 | 0.95 |
| MP/HRL | 0.37 | 1.79 | 0.05 | 1.47 | 0.54 | −1.38 | 4.02 | −0.84 | 2.26 | 0.60 | −1.01 | 3.68 | −0.78 | 2.53 | 0.82 |
| UI/PP | 1.93 | 3.74 | 1.02 | 7.71 | 0.64 | 0.57 | 4.19 | 2.08 | 3.29 | 0.21 | 2.51 | 5.59 | 3.11 | 6.86 | 0.76 |
| IMPA | 0.41 | 3.08 | 7.72 | 7.02 | <0.001 ∗ | −0.21 | 6.23 | 1.08 | 3.16 | 0.42 | 0.20 | 5.04 | 8.80 | 7.38 | <0.001 ∗ |
The postsurgical stability of the different dentoskeletal characteristics in the MPO and CPO groups were closely observed and measured at the consecutive time points up to 12 months ( Table V ). Horizontal changes in A-point were significantly different between the 2 groups at 3 months after surgery (T2-T3; MPO, 0.47 mm; CPO, −1.00 mm; P <0.05) and were maintained until the sixth month (T3-T4; MPO, −1.12 mm; CPO, 0.63 mm; P <0.05). Significant differences in SNA (MPO, −0.91°; CPO, 0.85°; P <0.01) and ANB (MPO, −0.93°; CPO, −0.05°; P <0.01) were also observed between the 2 groups from T3 to T4. On the other hand, there were no significant differences in the horizontal movement of B-point and pogonion in the mandible and the vertical relapse of anterior nasal spine and posterior nasal spine in the maxilla and menton in the mandible. All parameters were stable from T4 to T5 in both groups, with no significant differences.
| T2-T3 | T3-T4 | T4-T5 | T2-T5 | |||||||||||||||||
|---|---|---|---|---|---|---|---|---|---|---|---|---|---|---|---|---|---|---|---|---|
| MPO | CPO | P | MPO | CPO | P | MPO | CPO | P | MPO | CPO | P | |||||||||
| Mean | SD | Mean | SD | Mean | SD | Mean | SD | Mean | SD | Mean | SD | Mean | SD | Mean | SD | |||||
| Horizontal changes (mm) | ||||||||||||||||||||
| A-x | 0.47 | 2.35 | −1.00 | 1.95 | 0.04 ∗ | −1.12 | 2.41 | 0.63 | 0.64 | 0.01 † | −0.27 | 1.37 | 0.05 | 1.87 | 0.55 | −0.91 | 1.35 | −0.32 | 2.06 | 0.29 |
| B-x | 0.80 | 3.30 | −0.50 | 1.85 | 0.14 | −0.07 | 3.73 | 1.20 | 1.40 | 0.17 | 0.55 | 2.15 | 0.03 | 1.03 | 0.35 | 1.28 | 2.44 | 0.73 | 2.25 | 0.47 |
| Pg-x | 0.69 | 3.69 | −0.56 | 2.04 | 0.19 | −0.05 | 4.24 | 1.40 | 1.53 | 0.16 | 0.77 | 2.08 | 0.00 | 1.07 | 0.15 | 1.42 | 2.63 | 0.84 | 2.36 | 0.47 |
| Overjet | −0.97 | 1.73 | 0.19 | 0.79 | 0.01 ∗ | −0.27 | 0.82 | −0.02 | 0.82 | 0.33 | 0.01 | 1.10 | −0.26 | 0.79 | 0.37 | −1.23 | 1.90 | −0.09 | 1.19 | 0.03 ∗ |
| Vertical changes (mm) | ||||||||||||||||||||
| ANS-y | 0.26 | 2.43 | 0.30 | 1.38 | 0.95 | −0.44 | 1.54 | 0.14 | 1.42 | 0.22 | 0.32 | 1.28 | 0.11 | 0.98 | 0.56 | 0.13 | 2.52 | 0.55 | 1.48 | 0.53 |
| PNS-y | 0.08 | 0.88 | 0.04 | 0.62 | 0.87 | −0.08 | 1.14 | −0.01 | 0.74 | 0.82 | 0.45 | 1.02 | −0.04 | 0.77 | 0.09 | 0.46 | 0.86 | −0.01 | 0.84 | 0.09 |
| B-y | −2.33 | 2.19 | −1.88 | 1.51 | 0.46 | −1.32 | 2.85 | 0.58 | 1.50 | 0.01 ∗ | 1.04 | 3.26 | 0.94 | 1.57 | 0.90 | −2.60 | 2.17 | −0.36 | 2.04 | 0.00 † |
| Me-y | −2.05 | 2.51 | −1.69 | 1.29 | 0.57 | −0.42 | 2.33 | −0.31 | 1.06 | 0.85 | 0.41 | 1.95 | 0.04 | 0.81 | 0.43 | −2.06 | 1.63 | −1.96 | 1.45 | 0.84 |
| Overbite | 1.12 | 0.94 | 1.08 | 0.55 | 0.85 | 0.04 | 0.77 | 0.16 | 0.55 | 0.57 | −0.27 | 0.75 | 0.01 | 0.58 | 0.20 | 0.88 | 1.33 | 1.24 | 0.76 | 0.31 |
| Angular changes (°) | ||||||||||||||||||||
| SNA | −0.57 | 1.89 | −1.21 | 1.93 | 0.06 | −0.91 | 1.74 | 0.85 | 1.24 | 0.00 † | −0.57 | 1.89 | 0.00 | 1.07 | 0.25 | −1.58 | 1.31 | −0.36 | 2.06 | 0.03 ∗ |
| SNB | 0.16 | 1.41 | −0.50 | 1.26 | 0.13 | 0.03 | 1.67 | 0.90 | 1.09 | 0.06 | 0.12 | 1.41 | −0.10 | 0.77 | 0.56 | 0.30 | 1.45 | 0.31 | 1.38 | 0.99 |
| ANB | −0.26 | 1.05 | −0.71 | 1.37 | 0.25 | −0.93 | 0.98 | −0.05 | 0.94 | 0.01 † | −0.69 | 1.24 | 0.10 | 1.17 | 0.05 ∗ | −1.88 | 0.78 | −0.67 | 1.79 | 0.01 † |
| MP/HRL | 0.22 | 2.48 | 1.14 | 1.68 | 0.18 | −0.16 | 2.27 | −0.57 | 1.25 | 0.49 | 0.07 | 1.52 | −0.10 | 0.89 | 0.67 | 0.13 | 2.04 | 0.47 | 1.66 | 0.56 |
| UI/PP | −2.80 | 4.45 | −2.82 | 2.75 | 0.99 | 0.73 | 3.33 | −1.17 | 2.75 | 0.06 | −0.39 | 4.15 | 0.00 | 2.29 | 0.72 | −2.47 | 6.51 | −3.98 | 3.50 | 0.37 |
| IMPA | −0.21 | 6.23 | −0.53 | 3.62 | 0.07 | 1.15 | 3.40 | −0.55 | 3.40 | 0.12 | 0.40 | 2.80 | 1.13 | 2.30 | 0.38 | 4.04 | 5.19 | 0.05 | 4.43 | 0.01 ∗ |
Stay updated, free dental videos. Join our Telegram channel
VIDEdental - Online dental courses


