Introduction
A digital plaque image analysis system was developed to objectively assess dental plaque formation and coverage in patients treated with fixed orthodontic appliances.
Methods
The technique was used to assess plaque levels of 52 patients undergoing treatment with fixed appliances in the Department of Orthodontics at Johannes Gutenberg University in Mainz, Germany.
Results
Plaque levels ranged from 5.1% to 85.3% of the analyzed tooth areas. About 37% of the patients had plaque levels over 50% of the dentition, but only 10% exhibited plaque levels below 15% of tooth coverage. The mean plaque coverage was 41.9% ± 18.8%. Plaque was mostly present along the gum line and around the orthodontic brackets and wires.
Conclusions
The digital plaque image analysis system might provide a convenient quantitative technique to assess oral hygiene in orthodontic patients with multi-bracket appliances. Plaque coverage in orthodontic patients is extremely high and is 2 to 3 times higher than levels observed in high plaque-forming adults without appliances participating in clinical studies of the digital plaque image analysis system. Improved hygiene, chemotherapeutic regimens, and compliance are necessary in these patients.
Orthodontic treatment can improve the self-image of patients through the provision of better esthetics and a more attractive smile. In addition, orthodontics can in principle have long-term health advantages for patients, since crooked and crowded teeth are difficult to clean and maintain. Despite the posttherapy health advantages of orthodontics, the treatment regimen itself creates obstacles for patients, because orthodontic brackets create plaque-retentive sites that impede tooth cleaning. Dental plaque is a causative factor for oral disease, and thus its removal and control are important aspects of oral health maintenance. This plaque can lead to enamel demineralization and gingivitis. Previous studies have shown that the rate of decalcification in orthodontic patients is higher than in patients without orthodontic treatment. White spots have been reported in as many as 50% of teeth treated with brackets and in up to 50% of orthodontic patients.
Although various studies have evaluated fluoride treatments for their effects in reducing white spot formation associated with orthodontic treatment, surprisingly only a few studies have assessed plaque prevention by antimicrobials. Most of those studies that investigated plaque focused on hygiene aids. One reason for the limited number of studies of antimicrobial plaque control in orthodontic populations might be due to the lack of qualified, simple, and convenient measurement methods. Most traditional plaque scoring systems applied to unnbracketed dentitions, such as the Löe and Silness index, the Turesky modification of the Quigley and Hein index, or the Navy index are difficult to use in orthodontic populations. This is because they are based on a nonlinear (categorical) scale focused on plaque along the gum line; even after modifications, they lack sensitivity when applied to orthodontic populations. Planimetry-based scales would probably be more appropriate for orthodontic patients, whose plaque accumulates in a variety of orientations driven by the presence of appliances.
In recent years, several objective plaque evaluation methods with digital image analysis have been developed. However, none of these planimetric-based methods has been applied or validated in orthodontic population. One technique, called digital plaque image analysis (DPIA), has proven to be an effective means for the assessment of in-vivo plaque levels. This technique has been successfully applied to many clinical evaluations of hygiene methods and antiplaque chemotherapeutics. In patients without orthodontic appliances, plaque levels average 10.3% to 13.3%, depending on the population. The technique provides excellent reproducibility (relative standard deviation, 3.77%). The objective DPIA method allows for rapid data collection and archiving of a database of images, which can be particularly important in an orthodontic population when teeth are constantly migrating.
The aims of this study were to develop the DPIA technique for use with orthodontic patients, measure quantity and variation in average plaque levels in patients with fixed appliances, and assess the reproducibility and sensitivity of the DPIA method in this population.
Material and methods
Fifty-two patients (32 boys, 20 girls) undergoing orthodontic treatment with fixed appliances participated in this study. All patients were treated at the Department of Orthodontics at Johannes Gutenberg University of Mainz in Germany. These patients received special oral hygiene instructions and prevention of tooth demineralization at the beginning of their orthodontic treatment. The instructions included a detailed brushing protocol with a demonstration of the Bass brushing technique and the use of an interdental brush between the brackets. The patients were advised to brush their teeth 3 times a day for 5 minutes and to brush their teeth after snacks.
Before the study, the patients and parents or guardians received written informed consent describing the study procedures and requirements. The study was approved by the ethics committee of Rheinland-Pfalz, Mainz, Germany.
The inclusion criteria required that patients (1) were at least 12 years old, (2) were in good general physical health, (3) had no oral disease including caries and oral soft-tissue disease, and (4) had fixed orthodontic appliances in both dental arches. Patients with a history of medication-related allergies or allergies to food dyes (especially fluorescein) and those taking antibiotics 2 weeks before the imaging visit were excluded.
All study visits occurred in the afternoon. Before each visit, the patients were instructed to refrain from oral hygiene after morning brushing and from eating and drinking 1 hour before image capture. DPIA data collection followed the standard technique procedures described previously.
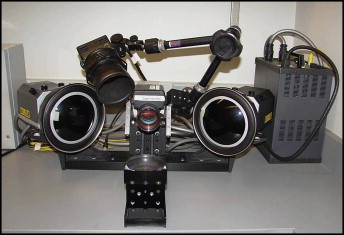
The imaging system used in this study was similar to that previously described by White et al and White. It consisted of 2 long-wave UV flash units (model FX60, Balcar Company, Strasburg, France) and a powerpack (Starflash 2, Balcar) equipped with filters to remove most of the visible light. The filters had a peak light pass at 365 nm. The flashes were commercial units fitted with filters that do not emit light in the harmful short UV wavelengths of the light spectrum. The flash units were positioned at a 45° angle to the patient to reduce reflection to a minimum. The centrally mounted digital camera (HC2500 3CCD, Fuji, Tokyo, Japan), fitted with a lens (Fujinon, A4 × 7.5BMD, f2.8, 7.5-30 mm, Fuji), was entirely controlled by computer. Figure 1 shows the system configuration. Upon startup and hourly thereafter, the flash illumination level was checked via a Macbeth color chart (GretagMacbeth, New Windsor, NY) that included a chip excited by UV illumination. This ensured consistency of system conditions. All images were automatically downloaded to a computer immediately after capture, since the camera has no integral data-storage device. The computer maintained the database of images and a log of capture time, date, operator, patient, visit number, and standardization checks. All images were captured under standardized room conditions, excluding all other light sources.
The patients disclosed their plaque with fluorescein solution using the following rinsing sequence including (1) rinse for 10 seconds with 25 mL of phosphate buffer, (2) rinse for 1 minute with 5.0 mL of 1240-ppm fluorescein in phosphate buffer, and (3) rinse 3 times for 10 seconds with 25 mL of phosphate buffer.
The phosphate buffer comprised 3.62 g of monosodium phosphate and 0.349 g of disodium phosphate diluted to 2 L with deionized water. The final pH of this mixture was 5.5. The solution was prepared fresh each day. The buffer rinse was used to stabilize temporarily the pH of the mouth and to ensure reproducible dye fluorescence.
Immediately after plaque disclosure, a digital image was taken. All images were captured within 2 minutes of disclosure to minimize fluorescence variation. The patient was placed by the system operator (A.B.) directly in front of the camera. The patient’s chin was positioned in the fixed chin rest to ensure stability and reproducibility of positioning. The camera also provided a “live” video frame to the monitor with a white-light lamp (switched off during actual image capture) to help with accurate positioning. Lip retractors were used to allow a good view of the front teeth. The patients were instructed in the use of the retractors before positioning and capture of an image. After the first images were taken, a subset of the patients was repositioned, and a second image was taken to evaluate the reproducibility of repositioning.
The images were analyzed by using Optimas software (version 6.5.1, Media Cybernetics, Silver Spring, Md) with custom macros. Initially, all images had the region of interest masked, including the facial surfaces of the 12 front teeth (6 maxillary, 6 mandibular), excluding gingiva, tongue, and retractors ( Fig 2 ).
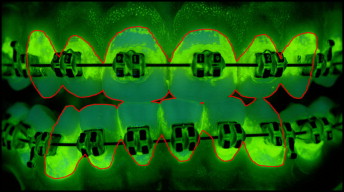
A computerized decision rule was created to analyze the images. This rule was based on the least-square distance pixel classification and was accomplished by calculating the scalar distance in RGB (red, green, blue) color space from the pixel to be classified to the median RGB (red, green, blue) color of each predefined class. The pixel was classified in the group to which the scalar distance was least. Generally, the rule was created to demarcate key areas such as teeth and plaque on teeth. In this study, the method was adapted to additionally analyze bracket areas. The modified computer rule was created by an expert analyst based on the images of the first 10 patients. The computer was “trained” (using least-square distance pixel classification) to recognize all key features (classes) in the image: teeth, and plaque on the teeth and the fixed orthodontic appliance. This was done by picking many representative pixels of each class from every image. Automated classification analysis was then performed on these 10 images to ensure that the computer was analyzing the images accurately and reproducibly. Once this had been achieved, all images in the database were analyzed by using automated batch classification. Figure 3 shows the overlay of an orthodontic patient with all representative classes. The results of the analysis were all visually checked by the analyst to verify the accuracy of the rule. For every image, the computer reported the number of pixels in each class directly to an Excel spreadsheet (Microsoft, Redmond, Wash). From this data, it was possible to calculate the percentage of tooth area covered with plaque. After masking all of the images, all of the images were remasked to evaluate the reproducibility of masking.
Compared with the application of the DPIA method on patients without orthodontic appliances, the tooth area was decreased by the bracket area that was excluded from analysis. Although plaque on brackets is obviously not desirable, it is not in direct contact with teeth and therefore not as critical for oral health. Consistent with previous research, it was considered that the measurement should primarily focus on plaque in contact with the hard tissues. Calculated plaque levels were normalized to the uncovered tooth area, and plaque was reported as a percentage of tooth-area coverage.
Statistical analysis
Summary statistics (means, standard deviations, frequencies, and so on) of the demographic characteristics were calculated overall, and summary statistics of the plaque measurements were calculated overall and for each breakout. In addition, intraclass correlations (ICC) and 95% lower confidence bounds were calculated by using a 0-to-1 scale, with 0 representing no agreement and 1 representing perfect agreement for the remasking and repositioning breakouts relative to the original. All statistical analyses were run by using SAS software (SAS Institute, Cary, NC).
Results
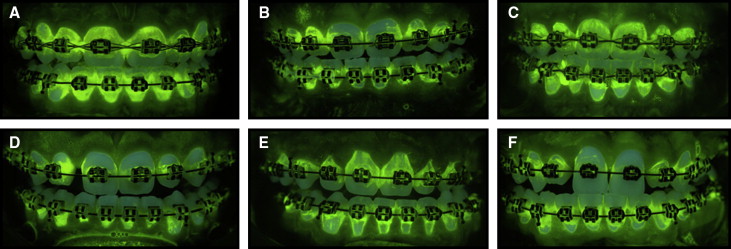
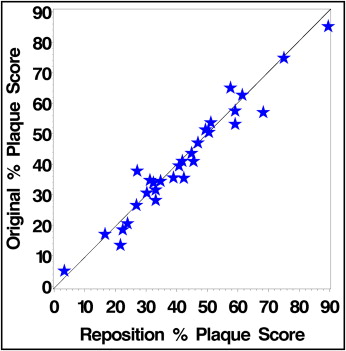
The demographics of the study population are shown in Table I . Representative images of plaque formation in the orthodontic patients are shown in Figure 4 . As illustrated, it was easy to qualitatively visualize plaque on and around the brackets because of the fluorescence from the fluorescein dye. As described previously in detail, a quantitative analysis of plaque coverage was achieved by the creation of a rule that ensured an imaging classification appropriate for orthodontic populations. During this process, it was found that patients with translucent brackets needed to be excluded from the survey, because the automated computer analysis did not reliably determine which areas were teeth and which areas were brackets. Additionally, standardization of the color of the retaining rubber bands was necessary to enable accurate computer classification. To show the image reproducibility between patients, a subset of 30 patients was repositioned, and a second DPIA image was taken and analyzed. Figure 5 shows the reproducibility of plaque scores after patient repositioning. The ICC was 0.970.
| Subjects (N) | 52 |
| Age (y) | |
| Mean (SD) | 13.33 (1.31) |
| Minimum-maximum | 12-18 |
| Sex | |
| Female (%) | 20 (38.5) |
| Male (%) | 32 (61.5) |
Stay updated, free dental videos. Join our Telegram channel
VIDEdental - Online dental courses


