Introduction
Transverse maxillary deficiency is frequently observed in patients who seek orthodontic treatment. In skeletally mature patients, transverse maxillary deficiency can be treated with surgically assisted rapid palatal expansion (SARPE). Forces delivered by the expander produce areas of compression in the periodontal ligament, which could lead to alveolar bone resorption and possible changes in the attachment level. The aim of this prospective clinical study was to evaluate the periodontal effects of SARPE by means of a complete clinical evaluation and cone-beam computerized tomography (CBCT) evaluation.
Methods
The sample included 14 patients (5 males, 9 females), with a mean age of 23.0 ± 1.9 years (range: 16.4 to 39.7 years). All patients were treated using a bonded Hyrax-type expander, and the mean expansion was 9.82 mm (7.5 to 12.0 mm). All patients had a 1-year retention period. CBCT scans were taken, and periodontal charts were completed at time points T0 (initial) and T1 (6 months after expansion).
Results and Discussion
SARPE seemed to have little detrimental clinical effects on the periodontium. Radiographic data demonstrated statistically significant changes: a significant decrease in the buccal alveolar bone thickness on most teeth, a significant increase in the palatal alveolar bone thickness on most teeth, a decrease in the buccal alveolar crest level of all canines and posterior teeth, and a tendency toward a decrease in the interproximal alveolar crest level on the mesial aspect of both central incisors.
Conclusions
SARPE seems to have little detrimental effects on the periodontium clinically. However, radiographic data demonstrated some statistically significant changes, which could eventually have a significant clinical impact on the periodontium.
Transverse maxillary deficiency is frequently observed in patients who seek orthodontic treatment and is often characterized by unilateral or bilateral crossbite as well as anterior crowding. There are different treatment approaches, depending on the skeletal maturity, the amount of desired expansion, and the presence of a concomitant sagittal or vertical problem.
In skeletally immature patients, rapid orthopedic palatal expansion (RPE) is a common method of treatment. However, as the patient matures and circummaxillary sutures offer more and more resistance to expansion, this procedure produces predominantly dentoalveolar expansion and may cause periodontal complications.
In skeletally mature patients, the deficiency can be corrected by segmental LeFort I osteotomy or surgically assisted rapid palatal expansion (SARPE). When compared with RPE, SARPE is believed to limit the amount of tooth movement from dentoalveolar expansion, as it eliminates the sutural resistance to expansion and therefore produces few periodontal side effects. Nevertheless, forces delivered by the expander still produce areas of compression in the periodontal ligament, which could lead to alveolar bone resorption and possible changes at the attachment level.
Some studies have evaluated periodontal effects of orthopedic RPE, yet limited information exists concerning SARPE. The protocols used in past studies have been highly variable: clinical measurements, radiographic measurements, and measurements on models and/or pictures. To date, no study has employed complete clinical and 3D radiographic evaluation of posterior teeth as well as central incisors. Only 2 published studies used tomography, which is known to provide better quantitative 3D images of osseous changes. Developed 2 decades ago, cone-beam computerized tomography (CBCT) is a multiplanar imaging technique that allows visualization of slices as well as 3D reconstructions like medical CT scanning does, with a better resolution and a far lower ionizing radiation dose.
The purpose of this prospective and comparative clinical study was to evaluate the periodontal effects of SARPE by means of a complete clinical evaluation and a CBCT evaluation. The working hypothesis was that SARPE has no detrimental effect on the periodontium.
Material and methods
This study was approved by the ethics committee of the Hôpital du Sacré-Coeur de Montréal. The sample included 14 patients (5 males, 9 females), with a mean age of 23.0 years ± 1.9 years (range: 16.4 to 39.7 years). Subjects were selected from among the patients who sought orthodontic treatment at the Faculté de médecine dentaire, Université de Montréal. The inclusion criteria were severe transverse maxillary deficiency (> 7 mm) ; advanced skeletal maturity as assessed by chronological age, cervical vertebral maturation, and sexual secondary characteristics; no missing maxillary teeth (except lateral incisors); good general health; good periodontal health; good oral hygiene; nonsmoking status during the study period; and acceptance and signature of the consent form. The only exclusion criterion was any health problem that presented a contraindication to the surgery. Pretreatment and treatment characteristics of the sample are presented in Tables I and II .
| Sex | Age | Dental characteristics | Skeletal characteristics | |||||||
|---|---|---|---|---|---|---|---|---|---|---|
| Molar Relation | OJ | OB | SNA | SNB | ANB | FMA | ||||
| Right | Left | |||||||||
| 1 | M | 17.9 years | II (6) | II (5) | 10.0 | 7.0 | 82.0 | 76.0 | 6.0 | 28.0 |
| 2 | F | 16.9 years | I | II (5) | 4.0 | 3.0 | 78.0 | 79.0 | −1.0 | 27.0 |
| 3 | M | 25.3 years | III (1) | III (3.5) | 1.0 | −1.0 | 82.5 | 81.0 | 1.5 | 29.0 |
| 4 | F | 16.9 years | I | II (4.5) | 3.0 | 2.0 | 82.5 | 77.0 | 5.5 | 34.0 |
| 5 | F | 26.7 years | I | I | 0.5 | 0.5 | 84.0 | 82.5 | 1.5 | 35.0 |
| 6 | F | 39.7 years | I | II (3) | 3.0 | 2.0 | 77.5 | 73.0 | 4.5 | 32.0 |
| 7 | F | 20.4 years | II (3) | II (3) | 6.5 | 6.0 | 85.0 | 76.5 | 8.5 | 31.0 |
| 8 | M | 20.7 years | I | I | 5.0 | 0.0 | 86.0 | 78.5 | 7.5 | 33.0 |
| 9 | F | 27.1 years | II (3.5) | II (3) | 1.5 | 7.5 | 81.5 | 73.0 | 8.5 | 35.0 |
| 10 | M | 18.2 years | II (4.5) | II (2) | 2.5 | 2.5 | 77.5 | 76.0 | 1.5 | 28.0 |
| 11 | F | 16.4 years | I | I | 3.0 | 4.0 | 81.5 | 78.5 | 3.0 | 22.0 |
| 12 | F | 25.2 years | II (5.5) | I | 3.0 | 4.0 | 78.5 | 76.0 | 2.5 | 19.0 |
| 13 | F | 34.11 years | II (4) | II (7) | 6.5 | 0.0 | 79.0 | 74.0 | 5.0 | 41.0 |
| 14 | M | 17.4 years | III (5) | III (5) | 0.0 | 0.0 | 83.5 | 86.5 | –3.0 | 24.0 |
| Screw | Extraction | Surgery | |||
|---|---|---|---|---|---|
| Expansion | Without | With | One maxilla | Two maxillae | |
| 1 | 7.50 | X | X | ||
| 2 | 10.25 | X | |||
| 3 | 9.75 | X | |||
| 4 | 9.00 | X | |||
| 5 | 10.50 | X | |||
| 6 | 10.00 | X | |||
| 7 | 9.00 | X | |||
| 8 | 11.50 | X | |||
| 9 | 10.50 | X | |||
| 10 | 9.00 | X | |||
| 11 | 9.00 | X | |||
| 12 | 8.25 | X | |||
| 13 | 11.25 | X | X | ||
| 14 | 12.00 | X | X | ||
All orthodontic clinical manipulations were performed by C.G. (resident in orthodontics) and supervised by A.P. (orthodontist). All patients were treated using a Hyrax-type expander, which was bonded to both first and second premolars as well as first molars with a metal extension on the mesial-occusal surface of the second molar to prevent supraeruption during the expansion and retention. The mean expansion was 9.82 mm (7.5 to 12.0 mm). All had a 1-year retention period (4 months with the Hyrax-type appliance and 8 months with a Hawley-type appliance) before fixed orthodontic treatment began. All surgeries were performed by the same oral and maxillofacial surgeon (N.P.). The surgery included osteotomies of the lateral walls of the maxilla, midpalatal suture, and pterygoid plates, as well as release of the nasal septum.
At this time, 2 time points were considered: T0 (initial) and T1 (6 months after expansion) for all patients. A periodontal chart was completed at each time point by a periodontist (R.V.). The collected data included probing depth, width of keratinized tissue, attachment level using the enamocemental junction, gingival recession, tooth mobility, bleeding on probing, and assessment of the furcations.
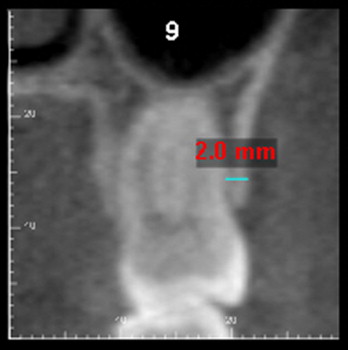
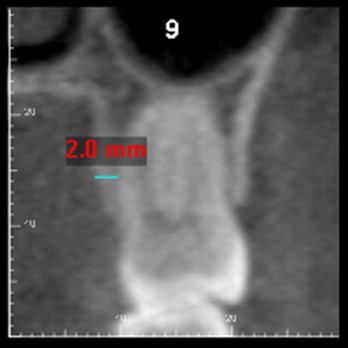
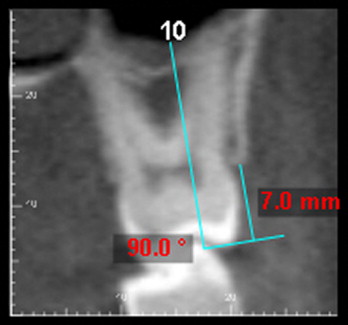
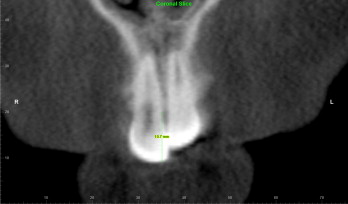
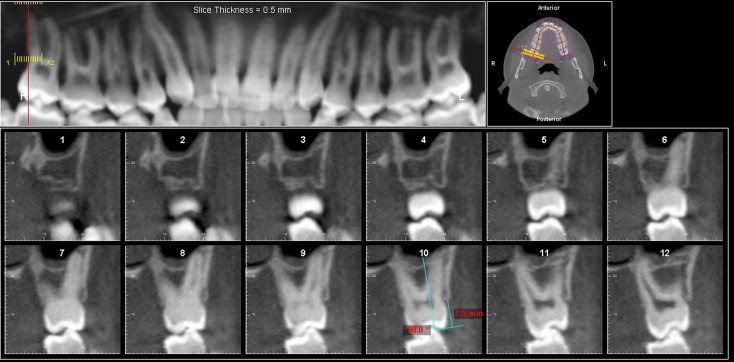
A CBCT (i-CAT, Imaging Sciences International, Hatfield, Pa) was taken at each time point, and scanning parameters were a visualization field of 22 cm (enlarged field), an acquiring time of 22 seconds, and a voxel size of 0.2 mm. During image acquisition, subjects were seated with the head stabilized, occlusal plane parallel to the floor, and teeth in maximal intercuspidation. The Digital Imaging and Communications in Medicine (DICOM) images were assessed with Dolphin 3D software, 10.5 version (Dolphin Imaging and Management Solutions, Chatsworth, Calif). All measurements were done by a blinded examiner (O.Q., resident in orthodontics, under the supervision of M.P. (oral and maxillofacial radiologist). The following parameters were recorded: buccal alveolar bone thickness (BABT) ( Fig 1 ), palatal alveolar bone thickness (PABT) ( Fig 2 ), buccal alveolar crest level (BACL) ( Fig 3 ), and interproximal alveolar crest level (IACL) ( Fig 4 ). From an axial section parallel to the occlusal plane ( Fig 5 ), a curved planar reconstruction was made in which the imaging plane passed through the center of each maxillary tooth. A serial transplanar reconstruction was then made, giving 0.2-mm-thick and 0.5-mm-spaced orthogonal slices. The first 3 parameters were evaluated on slices that passed through each cusp, from the canine to the second molar on both sides. Palatal and buccal bone thicknesses were measured at a level 2 mm apical to the furcation of the right first molar. The fourth parameter was measured on a coronal slice passing through the long axis of each central incisor.
Statistical analyses
The median, mean, and standard deviation of each variable were determined at T0 and T1, as well as changes between T0 and T1. Dependent t tests were calculated to compare all radiographic parameters, as well as the width of the attached gingiva. Wilcoxon tests were used to compare the level of attachment and mobility as well as the attached gingiva for control teeth, since data distribution did not follow normal law. All clinical measurements were taken twice within a 2-week interval for 5 teeth at T0 to establish intraexaminer reliability. As for the radiographic measurements, 2 assessments of each parameter at T0 were taken for the right teeth at least 2 weeks apart. Both were expressed as the intraclass correlation coefficient, and it ranged from r = 0.852 to 1.000 for clinical measurements and from r = 0.966 to 0.996 for radiographic measurements. All results were regarded as significant for P <0.05.
Results
Evaluation of clinical data showed no significant change in the attachment levels between T0 and T1. The palatal aspect of maxillary teeth showed no change in attachment level between T0 and T1, with median 0.0 both at T0 and T1, all P >0.3173. Changes in attachment level for the buccal aspect of maxillary teeth are presented in Table III . The first molars presented a tendency toward a loss of attachment at its buccal central aspect, which was not statistically significant ( P = .0656). Changes in attachment level for both buccal and palatal aspects of central incisors are presented in Table IV . One patient who already had gingival recession on 5 teeth at T0 showed 5 new recession sites (0.5 to 1.0 mm) and worsening of the previous recessions of up to 1 mm. Two patients showed gingival recession (1 mm) at T1 on the mesial aspect of the central incisors. Eleven of the 14 patients lost the interdental papilla between the central incisors. The patients who showed evidence of a papilla at T1 had had a complete spontaneous closure of the interdental space that had been opened during the expansion phase.
| T0 | T1 | Number of subjects | P | ||
|---|---|---|---|---|---|
| Median (min–max) | Median (min–max) | T0>T1 | T0<T1 | ||
| Right Molar – D | 0.0 (0.0-0.0) | 0.0 (0.0-0.0) | |||
| 2nd Right Molar – C | 0.0 (0.0-4.0) | 0.0 (0.0-3.5) | 1 | 0.2850 | |
| 2nd Right Molar – M | 0.0 (0.0-0.0) | 0.0 (0.0-0.0) | |||
| Right Molar – D | 0.0 (0.0-3.0) | 0.0 (0.0-4.0) | 1 | 0.3173 | |
| 1st Right Molar – C | 0.0 (0.0-4.0) | 0.0 (0.0-4.0) | 4 | 0.0656 | |
| 1st Right Molar – M | 0.0 (0.0-0.0) | 0.0 (0.0-0.0) | |||
| 2nd Right Premolar – D | 0.0 (0.0-0.0) | 0.0 (0.0-0.0) | |||
| 2nd Right Premolar – C | 0.0 (0.0-0.0) | 0.0 (0.0-0.0) | |||
| 2nd Right Premolar – M | 0.0 (0.0-0.0) | 0.0 (0.0-0.0) | |||
| 1st Right Premolar – D | 0.0 (0.0-2.5) | 0.0 (0.0-0.0) | 1 | 0.3173 | |
| 1st Right Premolar – C | 0.0 (0.0-0.0) | 0.0 (0.0-3.0) | 1 | 0.3173 | |
| 1st Right Premolar – M | 0.0 (0.0-2.5) | 0.0 (0.0-0.0) | 1 | 0.3173 | |
| Right Canine – D | 0.0 (0.0-0.0) | 0.0 (0.0-4.0) | 1 | 0.3173 | |
| Right Canine – C | 0.0 (0.0-4.0) | 0.0 (0.0-4.0) | 1 | 0.3173 | |
| Right Canine – M | 0.0 (0.0-0.0) | 0.0 (0.0-0.0) | |||
| Left Canine – M | 0.0 (0.0-0.0) | 0.0 (0.0-3.0) | 1 | 0.3173 | |
| Left Canine – C | 0.0 (0.0-4.0) | 0.0 (0.0-3.0) | 1 | 0.3173 | |
| Left Canine – D | 0.0 (0.0-0.0) | 0.0 (0.0-0.0) | |||
| 1st Left Premolar – M | 0.0 (0.0-0.0) | 0.0 (0.0-0.0) | |||
| 1st Left Premolar – C | 0.0 (0.0-0.0) | 0.0 (0.0-3.0) | 2 | 0.1797 | |
| 1st Left Premolar – D | 0.0 (0.0-0.0) | 0.0 (0.0-0.0) | |||
| 2nd Left Premolar – M | 0.0 (0.0-0.0) | 0.0 (0.0-0.0) | |||
| 2nd Left Premolar – C | 0.0 (0.0-0.0) | 0.0 (0.0-0.0) | |||
| 2nd Left Premolar – D | 0.0 (0.0-0.0) | 0.0 (0.0-0.0) | |||
| 1st Left Molar – M | 0.0 (0.0-0.0) | 0.0 (0.0-0.0) | |||
| 1st Left Molar – C | 0.0 (0.0-3.0) | 0.0 (0.0-3.0) | 1 | 2 | 0.5637 |
| 1st Left Molar – D | 0.0 (0.0-0.0) | 0.0 (0.0-0.0) | |||
| 2nd Left Molar – M | 0.0 (0.0-0.0) | 0.0 (0.0-0.0) | |||
| 2nd Left Molar – C | 0.0 (0.0-0.0) | 0.0 (0.0-0.0) | |||
| 2nd Left Molar – D | 0.0 (0.0-0.0) | 0.0 (0.0-0.0) | |||
| T0 | T1 | Number of subjects | P | ||
|---|---|---|---|---|---|
| Median (min–max) | Median (min–max) | T0>T1 | T0<T1 | ||
| BUCCAL ASPECT | |||||
| Right Central Incisor – D | 0.0 (0.0-0.0) | 0.0 (0.0-3.0) | 2 | 0.1573 | |
| Right Central Incisor – C | 0.0 (0.0-0.0) | 0.0 (0.0-0.0) | |||
| Right Central Incisor – M | 0.0 (0.0-0.0) | 0.0 (0.0-3.0) | 2 | 0.1573 | |
| Left Central Incisor – M | 0.0 (0.0-0.0) | 0.0 (0.0-3.0) | 2 | 0.1573 | |
| Left Central Incisor – C | 0.0 (0.0-0.0) | 0.0 (0.0-0.0) | |||
| Left Central Incisor – D | 0.0 (0.0-3.0) | 0.0 (0.0-4.0) | 1 | 0.3173 | |
| PALATAL ASPECT | |||||
| Right Central Incisor – D | 0.0 (0.0-0.0) | 0.0 (0.0-2.5) | 1 | 0.3173 | |
| Right Central Incisor – C | 0.0 (0.0-0.0) | 0.0 (0.0-0.0) | |||
| Right Central Incisor – M | 0.0 (0.0-0.0) | 0.0 (0.0-2.0) | 1 | 0.3173 | |
| Left Central Incisor – M | 0.0 (0.0-0.0) | 0.0 (0.0-3.0) | 1 | 0.3173 | |
| Left Central Incisor – C | 0.0 (0.0-0.0) | 0.0 (0.0-0.0) | |||
| Left Central Incisor – D | 0.0 (0.0-0.0) | 0.0 (0.0-3.0) | 1 | 0.3173 | |
The width of attached gingiva ( Table V ) showed statistically significant changes for the first molar on the right side and the second molar on both sides. The most significant decrease was observed on the second molar, with a mean of 0.8 ± 1.0 mm ( P = 0.0088) and 0.9 ± 0.7 mm ( P = 0.0004) on the right and left side, respectively.
| T0 | T1 | T0-T1 | P | P >0.05 | |
|---|---|---|---|---|---|
| 2nd Right Molar | 1.9 ± 0.3 | 1.1 ± 0.3 | 0.8 ± 1.0 | 0.0088 | ∗ |
| 1st Right Molar | 3.4 ± 0.5 | 2.7 ± 0.3 | 0.7 ± 1.0 | 0.0285 | ∗ |
| 2nd Right Premolar | 3.6 ± 0.4 | 3.5 ± 0.4 | 0.1 ± 0.7 | 0.4346 | |
| 1st Right Premolar | 2.5 ± 0.4 | 2.1 ± 0.3 | 0.4 ± 0.8 | 0.0537 | |
| Right Canine | 2.5 ± 0.4 | 2.5 ± 0.4 | 0.0 ± 0.9 | 1.0000 | |
| Right Central Incisor | 3.2 ± 0.4 | 2.7 ± 0.4 | 0.5 ± 1.0 | 0.0893 | |
| Left Central Incisor | 3.1 ± 0.3 | 2.6 ± 0.3 | 0.5 ± 0.9 | 0.0682 | |
| Left Canine | 2.4 ± 0.4 | 2.3 ± 0.4 | 0.1 ± 0.5 | 0.4257 | |
| 1st Left Premolar | 2.2 ± 0.3 | 1.8 ± 0.3 | 0.4 ± 1.0 | 0.1667 | |
| 2nd Left Premolar | 3.1 ± 0.3 | 3.0 ± 0.3 | 0.1 ± 0.7 | 0.4346 | |
| 1st Left Molar | 3.4 ± 0.3 | 2.8 ± 0.3 | 0.6 ± 1.0 | 0.0554 | |
| 2nd Left Molar | 2.3 ± 0.3 | 1.4 ± 0.3 | 0.9 ± 0.7 | 0.0004 | ∗ |
There was a statistically significant increase in tooth mobility ( Table VI ) between T0 and T1 for all teeth, with the exception of the second molars, for which mobility changes were not statistically significant. Between T0 and T1, all central incisors had a grade I or grade II mobility according to the Miller Classification ; 6 of the 14 patients presented with grade II mobility. At T1, many teeth exhibited some mobility, but not more than a grade I mobility.
| T0 | T1 | Number of subjects | P | |||
|---|---|---|---|---|---|---|
| Median (min–max) | Median (min–max) | T0>T1 | T0<T1 | P >0.05 | ||
| 2nd Right Molar | 0.0 (0-0) | 0.0 (0-1) | 2 | 0.1573 | ||
| 1st Right Molar | 0.0 (0-0) | 1.0 (0-1) | 8 | 0.0047 | ∗ | |
| 2nd Right Premolar | 0.0 (0-0) | 1.0 (0-1) | 10 | 0.0016 | ∗ | |
| 1st Right Premolar | 0.0 (0-0) | 1.0 (0-1) | 10 | 0.0016 | ∗ | |
| Right Canine | 0.0 (0-0) | 0.0 (0-1) | 3 | 0.0833 | ||
| Right Central Incisor | 0.0 (0-1) | 1.0 (1-2) | 12 | 0.0017 | ∗ | |
| Left Central Incisor | 0.0 (0-1) | 1.5 (1-2) | 11 | 0.0024 | ∗ | |
| Left Canine | 0.0 (0-0) | 0.0 (0-1) | 4 | 0.0455 | ||
| 1st Left Premolar | 0.0 (0-0) | 1.0 (0-1) | 12 | 0.0005 | ∗ | |
| 2nd Left Premolar | 0.0 (0-0) | 1.0 (0-1) | 9 | 0.0027 | ∗ | |
| 1st Left Molar | 0.0 (0-0) | 0.0 (0-1) | 4 | 0.0455 | ∗ | |
| 2nd Left Molar | 0.0 (0-0) | 0.0 (0-1) | 1 | 0.3173 | ||
Radiographic analyses showed a significant decrease in the thickness of the alveolar bone on the buccal aspect ( Table VII ) of all premolars and molars and a significant increase on the palatal aspect ( Table VIII ) of most canines, premolars, and first molars. Second molars showed a slight decrease in the PABT. The most important changes of BABT were observed on the mesial aspect of the left first molar, with a mean of 0.6 ± 0.5 mm ( P = 0.0036), which represents a loss of 55% of the initial thickness.
| T0 | T1 | T0-T1 | P | P >0.05 | |
|---|---|---|---|---|---|
| 2nd Right Molar – D | 1.7 ± 0.2 | 1.1 ± 0.2 | 0.6 ± 0.7 | 0.0064 | * |
| 2nd Right Molar – M | 1.8 ± 0.2 | 1.3 ± 0.2 | 0.5 ± 0.4 | 0.0009 | * |
| 1st Right Molar – D | 1.6 ± 0.2 | 0.8 ± 0.2 | 0.8 ± 0.5 | 0.0000 | * |
| 1st Right Molar – M | 0.8 ± 0.2 | 0.5 ± 0.2 | 0.4 ± 0.4 | 0.0043 | * |
| 2nd Right Premolar – B | 2.0 ± 0.3 | 1.7 ± 0.3 | 0.4 ± 0.6 | 0.0483 | * |
| 1st Right Premolar – B | 1.0 ± 0.1 | 0.7 ± 0.2 | 0.3 ± 0.4 | 0.0386 | * |
| Right Canine – B | 0.3 ± 0.1 | 0.3 ± 0.1 | 0.1 ± 0.2 | 0.3969 | |
| Left Canine – B | 0.4 ± 0.1 | 0.3 ± 0.1 | 0.0 ± 0.3 | 0.6663 | |
| 1st Left Premolar – B | 1.2 ± 0.2 | 0.8 ± 0.2 | 0.4 ± 0.4 | 0.0023 | * |
| 2nd Left Premolar – B | 2.3 ± 0.2 | 1.9 ± 0.2 | 0.5 ± 0.5 | 0.0036 | * |
| 1st Left Molar – M | 1.0 ± 0.2 | 0.5 ± 0.2 | 0.6 ± 0.5 | 0.0013 | * |
| 1st Left Molar – D | 1.8 ± 0.2 | 1.0 ± 0.2 | 0.9 ± 0.6 | 0.0001 | * |
| 2nd Left Molar – M | 2.0 ± 0.2 | 1.4 ± 0.2 | 0.6 ± 0.5 | 0.0010 | * |
| 2nd Left Molar – D | 2.1 ± 0.1 | 1.5 ± 0.2 | 0.6 ± 0.8 | 0.0083 | * |
Stay updated, free dental videos. Join our Telegram channel
VIDEdental - Online dental courses


