Introduction
The purpose of this study was to evaluate palatal contours in nonextraction orthodontic treatment and long-term stability in patients with Class II Division 1 malocclusions.
Methods
Data were obtained from maxillary study models before treatment, after treatment, and at least 5 years postretention. Data were collected with a digital pantograph in the canine, second premolar, and first molar regions. Palatal width, base width, palatal height, and alveolar angle were evaluated.
Results
During treatment, the canine region was stable; in the premolar and molar regions, there were statistically significant increases in transverse (palatal and base widths) and palatal height measurements, whereas the alveolar angle decreased. In the postretention evaluation, the canine region showed the greatest modifications, except for alveolar angulation, which was stable. The premolar region showed stability, but, in the molar region, palatal width and alveolar angulation decreased.
Conclusions
In analyzing alterations in the geometry of palatal configuration, we concluded that a favorable transverse gain of the palatal base, from growth or orthodontics, was important for stability. The transverse gain of palatal base width during Class II treatment is important to compensate for the expected transverse loss in the cervical region and the decrease of alveolar angle in the long term.
The Class II growth pattern does not differ from that of Class I in terms of magnitude. A balanced face with good occlusion has a better relationship between its osseous elements. In contrast, facial skeletal disharmony can occur because of the lack of osseous coordination resulting from shape discrepancies. Therefore, recognizing and diagnosing the osseous configuration are useful for identifying the most pressing treatment needs. Studies have shown that treatment strategies that follow protocols for three-dimensional diagnosis are more likely to achieve long-term stability.
In this context, the maxillary and mandibular dental arches have been extensively assessed in terms of configuration because they reflect the skeletal form of units involved, like maxillary, mandibular, and cranial base bones. However, few studies have aimed to specifically identify palatal morphology. This might be because of methodologic difficulties in assessing curved forms.
The objective of this study was to assess long-term alterations in palatal configuration contours in the front view in patients with Class II Division 1 malocclusions who were treated without extractions.
Material and methods
The sample comprised 33 subjects (10 boys, 23 girls) with Class II Division 1 malocclusion who had nonextraction orthodontic treatment. The subjects were selected from the records of the orthodontic program of the University of Brazil in Rio de Janeiro (25 patients) and a private clinic (8 patients) in Florianópolis where patients had been treated by a practitioner trained in this orthodontic program.
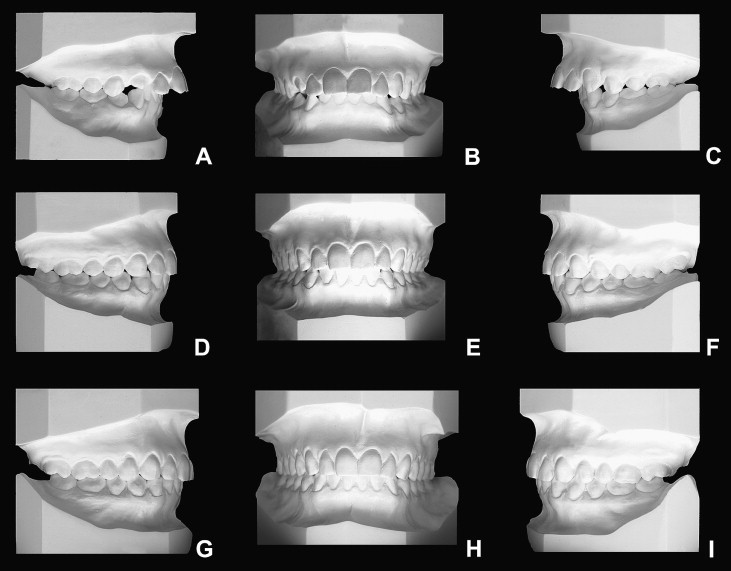
The inclusion criteria were as follows: at pretreatment (T1), a bilateral Class II molar and canine relationship and an overjet of at least 5 mm ( Fig 1 ). Subjects were also considered if they had a Class II first molar relationship of at least end to end, with the palatal cusp of maxillary first molar occluding anteriorly to the groove between the lingual cusps of the mandibular first molar. Only patients with good dental intercuspation at the end of the treatment (T2) were included in the study. Postretention records and any cephalometric criteria were not used to select the subjects.
The mean age of the patients at T1 was 10 years 9 months (range, 8 years 8 months to 14 years 8 months). At T2, the mean age was 15 years 1 month (range, 11 years 9 months to 18 years). Only 4 patients were more than 17 years old at T2. In the postretention phase (T3), the mean age of the patients was 26 years 3 months (range, 20 years 5 months to 39 years).
On average, active treatment lasted 2 years 8 months, maxillary retention took 2 years 3 months, and the nonretention period was 7 years 7 months.
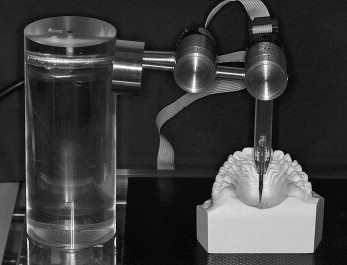
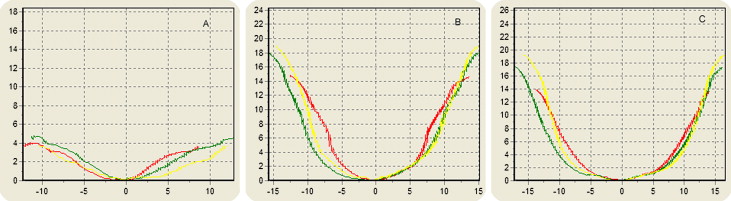
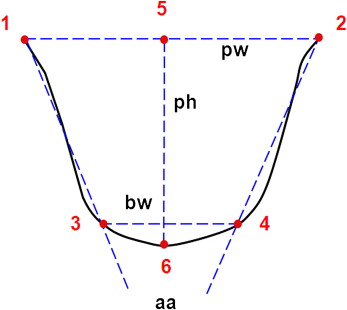
The palatal contours in the canine, second premolar, and maxillary first molar regions were obtained by using a digital pantograph ( Fig 2 ), allowing the cast model surfaces to be recorded and the images of the palatal contours to be digitally stored. In the canine region, the initial reading point was at the cervical-gingival margin of the crown of the maxillary right permanent canine or the maxillary right deciduous canine, whereas the final reading was recorded on the opposite side of the corresponding tooth. In the premolar region, the initial reading point was recorded at the cervical-gingival margin of the center of the crown of the maxillary right second permanent premolar or the center of the mesiopalatal cusp of the maxillary right deciduous second molar up to the corresponding point on the opposite side. In the maxillary first molar region, the initial reading was recorded at the cervical-gingival margin in the center of the mesiopalatal cusp up to the corresponding point on the opposite side. Each reading produced a file that was processed by Project 1 software (developed specially for this work by Laboratory of Robotics, Engineering Mechanics Department [COOPE-UFRJ], Rio de Janeiro, Brazil) which generated palatal contour graphics ( Fig 3 ) based on the measurements of each variable ( Fig 4 ).
Statistical analysis
Means, standard deviations, and minimum and maximum values were calculated for each variable (palatal width, base width, palatal height, and alveolar angle) at T1, T2, and T3. After determining normal data distribution by using the nonparametric Shapiro-Wilks test, we used the Student paired t test to identify statistically significant differences ( P ≤0.01) for the T1 to T2 and T2 to T3 periods based on the null hypothesis of the equality between mean values. The Student t test was also performed for independent samples to compare the mean values between the sexes. No statistically significant difference ( P ≤0.01) was found between these groups.
The readings were made at the same time and randomized to minimize the systematic error. To enhance precision, 10 readings were done for each dental region, and the means were recorded. To determine the reproducibility of the measurements, 12 cast models were randomly separated, and the reading procedures with the pantograph were performed twice at a 4-week interval. Comparisons between both readings were evaluated with the Student t test for paired samples (95% significance level); no statistically significant difference was found.
The statistical software SPSS for Windows (version 15, SPSS, Chicago, Ill) was used for all tests.
Results
Table I gives the means, standard deviations, and minimum and maximum values for each variable studied at each time.
| Canine | Premolar | Molar | |||||
|---|---|---|---|---|---|---|---|
| Mean (SD) | Min-max | Mean (SD) | Min-max | Mean (SD) | Min-max | ||
| pw (mm) | T1 | 24.11 (1.79) | 19.55-28.04 | 29.25 (2.75) | 23.78-35.16 | 31.50 (2.60) | 26.90-37.74 |
| T2 | 24.60 (1.60) | 21.10-27.12 | 32.39 (1.98) | 29.79-36.49 | 34.25 (2.26) | 30.23-39.23 | |
| T3 | 23.74 (1.53) | 20.69-26.60 | 31.83 (2.74) | 20.45-36.36 | 33.81 (2.18) | 29.77-37.97 | |
| bw (mm) | T1 | 8.13 (1.62) | 5.71-11.25 | 11.97 (1.83) | 7.25-16.93 | 13.77 (2.44) | 8.73-18.62 |
| T2 | 8.89 (2.34) | 5.50-15.42 | 13.17 (2.58) | 7.68-18.95 | 14.84 (3.04) | 9.56-21.10 | |
| T3 | 10.40 (3.24) | 6.42-18.83 | 13.36 (2.58) | 8.72-18.35 | 15.15 (3.12) | 9.65-20.24 | |
| ph (mm) | T1 | 3.66 (0.57) | 2.66-5.54 | 13.28 (1.59) | 9.64-16.33 | 12.52 (1.89) | 8.39-15.69 |
| T2 | 3.83 (0.71) | 2.62-5.33 | 15.71 (1.90) | 11.65-19.50 | 15.46 (1.94) | 11.80-20.50 | |
| T3 | 3.35 (0.81) | 1.46-4.71 | 15.43 (2.09) | 10.76-19.62 | 15.83 (2.10) | 12.06-20.59 | |
| aa (°) | T1 | 141.97 (6.90) | 129.08-155.87 | 74.68 (11.43) | 55.67-95.41 | 80.43 (11.41) | 61.72-104.63 |
| T2 | 139.32 (8.81) | 122.60-157.12 | 70.66 (11.30) | 47.52-99.09 | 71.25 (11.44) | 53.63-106.79 | |
| T3 | 139.70 (11.11) | 119.54-164.25 | 70.12 (11.82) | 47.70-101.58 | 67.99 (11.49) | 52.13-104.49 | |
Table II shows differences between the mean values at T1 and T2. Statistically significant ( P ≤0.01) increases in palatal width, base width, and palatal height were observed in the premolar and molar regions. Decrease in alveolar angulation was also observed, which was statistically significant for the canine ( P = 0.05), the premolar, and molar ( P ≤0.01) regions.
| Canine | Premolar | Molar | |||||||
|---|---|---|---|---|---|---|---|---|---|
| Mean | t | P | Mean | t | P | Mean | t | P | |
| Palatal width (mm) | 0.49 | 1.83 | 0.08 | 3.40 | 7.51 | ≤0.01 † | 2.75 | 7.14 | ≤0.01 † |
| Base width (mm) | 0.76 | 1.59 | 0.12 | 1.21 | 4.22 | ≤0.01 † | 1.07 | 3.56 | ≤0.01 † |
| Palatal height (mm) | 0.17 | 1.36 | 0.18 | 2.44 | 10.12 | ≤0.01 † | 2.94 | 11.12 | ≤0.01 † |
| Alveolar angle (°) | −2.65 | −2.06 | 0.05 ∗ | −4.01 | −3.35 | ≤0.01 † | −9.18 | −6.04 | ≤0.01 † |
More specifically, in the canine region, the palatal configuration was maintained between T1 and T2, except for alveolar angulation, where a statistically significant ( P = 0.05) reduction of 2.65° was observed.
In the premolar and molar regions, all differences between T1 and T2 were statistically significant ( P ≤0.01), showing palatal changes from both growth and orthodontic mechanics.
The transverse measurements, palatal width and base width, showed similar behavior in the premolar and molar regions, although the increases in these measurements were greater at the midpalatal region than in the posterior region.
Palatal heights increased in the premolar and molar regions by 2.44 and 2.94 mm, respectively. Changes in palatal height were more pronounced in the posterior region.
The molar region had the greatest reduction in alveolar angulation (9.18°), thus confirming the trend toward parallelism regarding the alveolar processes.
Table III lists the values for the mean differences between the variables in the long term. The canine region had the greatest modifications between T2 and T3, with all differences statistically significant ( P ≤0.01), except for alveolar angulation. Palatal width decreased by 0.86 mm, and palatal contour tended to be flatter, with a statistically significant increase ( P ≤0.01) in base width (1.51 mm) and a decrease in palatal height (–0.48 mm).
| Canine | Premolar | Molar | |||||||
|---|---|---|---|---|---|---|---|---|---|
| Mean | t | P | Mean | t | P | Mean | t | P | |
| Palatal width (mm) | −0.86 | −4.98 | ≤0.01 ∗ | −0.56 | −2.63 | 0.08 | −0.44 | −3.65 | ≤0.01 ∗ |
| Base width (mm) | 1.51 | 4.49 | ≤0.01 ∗ | 0.19 | 0.97 | 0.34 | 0.31 | 1.12 | 0.27 |
| Palatal height (mm) | −0.48 | −4.95 | ≤0.01 ∗ | −0.28 | −1.68 | 0.10 | 0.37 | 2.24 | 0.03 |
| Alveolar angle (°) | 0.38 | 0.30 | 0.77 | −0.55 | −0.74 | 0.47 | −3.26 | −3.23 | ≤0.01 ∗ |
Stay updated, free dental videos. Join our Telegram channel
VIDEdental - Online dental courses


