Introduction
The purpose of this study was to establish the influence of soft-tissue profile values on the decision of orthodontists to recommend orthognathic surgery for patients with Class II Division 1 malocclusion.
Methods
A questionnaire containing 40 profile photographs of adults with Class II Division 1 malocclusion was sent to all 256 consultant orthodontists in the United Kingdom asking for a “yes” or “no” response to the question: “Based on the profile view of this patient, would you treat this patient using an orthognathic surgical approach?” A soft-tissue analysis was carried out on each photograph, and multi-level logistic regression was used to investigate factors that affect the decision to recommend surgery.
Results
The response rate was high: 208 of 256 questionnaires (81.3%). Intraexaminer reliability of the photographic analysis method with a Bland-Altman plot showed good (95% CI) limits of agreement for each measurement. Consultants who carried out more orthognathic surgery treatment were more likely to recommend surgery. Secondary analysis with a logistic regression model indicated that 80% of the consultants would recommend surgery if B-point was more than or equal to −14.1 mm posterior to the true vertical through subnasale (95% CI, −29.9 to −10.9 mm), the facial profile angle was less than or equal to 148.9° (95% CI, 6.7° to 151.1°), pogonion to true vertical through subnasale was more than or equal to −12.0 mm (95% CI, −48.7 to −8.6 mm).
Conclusions
The facial profile angle and the positions of soft-tissue pogonion and B-point are useful clinical guides for planning treatment for adults with Class II Division 1 malocclusion.
Orthognathic surgery is a well-established treatment approach for persons with skeletal discrepancies beyond the scope of conventional orthodontic treatment. Previous research showed that facial and dental anomalies that affect a person’s appearance can result in social disadvantages. Combined orthodontic and surgical treatment aims to produce more harmonious facial skeletal and soft-tissue relationships and to improve occlusal function. Most patients who request such treatment do so to improve their facial or dental esthetics, rather than to improve occlusal function. Orthognathic patients can experience psychosocial benefits as well as improved self-confidence, body and facial image, and social adjustment.
In a patient who has completed growth, there are 2 options for treatment of a Class II malocclusion with a skeletal discrepancy: compensation of the dentition to camouflage the underlying skeletal problem and surgical correction of the underlying skeletal discrepancy.
A clinical examination and cephalometric assessment are needed to determine whether a patient can be treated with orthodontic camouflage, or whether orthognathic surgery is required. With respect to the clinical factors affecting this decision, Proffit et al described an “envelope of discrepancy” to aid in treatment planning. However, generally, there is limited high-quality evidence on the clinical parameters used to make this decision.
Numerous soft-tissue analysis methods have been developed to aid in diagnosis and treatment planning; however, these are frequently measured from lateral cephalograms. As a result, clinical facial analysis can sometimes become subordinate to cephalometric examination in treatment planning. As part of informed consent, all treatment options are discussed with patients to help them decide on the most appropriate treatment. Although it has been shown that patients’ perceptions of the need for surgery are much lower than those of orthodontists, it would be invaluable for informed consent purposes if an orthodontist could provide his or her recommendations on whether surgery is indicated based on appropriate interpretations of both clinical and cephalometric findings.
The aims of this study then were to identify (1) key soft-tissue profile values that might indicate the need for orthognathic surgical treatment in patients with Class II Division 1 malocclusions; and (2) any confounding factors that could influence the assessors’ decisions in terms of year of qualification, sex, and the number of orthognathic patients they currently treat each year.
The null hypotheses were that (1) for Class II Division 1 patients, there is no statistically significant difference in clinical soft-tissue profile values between patients whom orthodontists perceive as needing orthognathic surgical treatment and those whom orthodontists perceive as needing orthodontic camouflage of their malocclusion; and (2) the year of qualification, sex, and number of orthognathic patients each year do not influence the assessors’ decisions.
Material and methods
Ethical approval was approved by the Leeds East Ethics Committee (08/H1306/96), and research and development approval was granted from Leeds Teaching Hospitals NHS Trust, Bradford Teaching Hospitals NHS Foundation Trust, and York Teaching Hospitals NHS Trust in the United Kingdom.
The patients were drawn from new patient clinics in York District Hospital and Leeds Dental Institute. Forty patients were recruited with Class II Division 1 malocclusions exhibiting wide variations in degree of malocclusion with a good range of each variable to be investigated.
The inclusion criteria were (1) Class II Division 1 malocclusion, defined as the mandibular incisor edges lying posterior to the cingulum plateau of the maxillary central incisors, an increase in the overjet, and the maxillary central incisors usually proclined ; (2) white ethnicity; and (3) age over 16 years.
The exclusion criteria were (1) previous orthodontic treatment; (2) previous orthognathic surgical treatment; (3) cleft lip or palate, or other craniofacial anomaly; and (4) consent not given to participate in the study.
Most orthognathic care in the United Kingdom is undertaken by hospital orthodontic consultants who have had a further 2 years of postgraduate study after their initial 3 years of study in orthodontics leading to specialization. The sample population for this study included all consultant orthodontists not involved in the care of the patients selected. A database of all 256 eligible consultant orthodontists was obtained from the British Orthodontic Society.
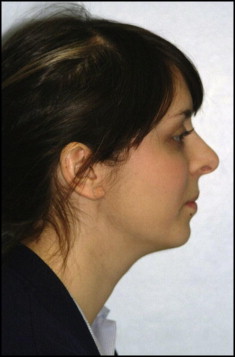
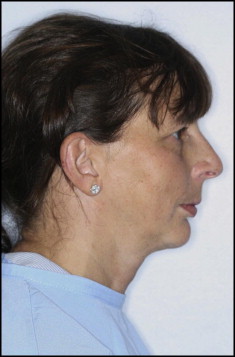
The photographs for the questionnaire booklet were taken under standardized conditions. Each photograph was taken in the right profile view with the patient seated in the natural head position, with the lips passive ( Figs 1 and 2 ). This was obtained by asking the subject to look at the reflection of his or her pupils in a mirror held at the subject’s eye level. It was important to maintain standardization of the photos; any photographs showing evidence of mentalis activity (puckered or flattened chin) were removed. The face filled the frame, extending from above the top of the head, in front of the nose and below the chin. Each patient sat on a chair with the midsagittal plane along a line set at 2 m from the camera lens. The camera was mounted on a tripod. The camera and lighting were adjusted so that the patient’s shadow was thrown behind him or her. The photographs were taken against a standardized background, and a vertical plumb line was constructed by using a length of string secured to the wall at its upper end and a weight secured to the other end. The patient was positioned so that the plumb line was just in front of the tip of the patient’s nose and fully within the frame of the shot. The same camera (EOS 30D; Canon [UK] Ltd, Surrey, United Kingdom) was used for all photographs with the shutter speed set at 1/125 second and the opening of the diaphragm at f 5.6.
Once 40 suitable subjects were chosen, the photographs were numbered 1 through 40 for anonymity and ensuring their easy identification.
A booklet was produced, and the consultants were asked to provide the following information: number of orthognathic patients treated per year, year of qualification as a specialist in orthodontics, and sex.
The inside cover asked the reader to spend no more than 30 seconds looking at each photograph and then answer “yes” or “no” to the following question: “Based on the profile view of this patient, would you treat this patient using an orthognathic surgical approach?” The following 40 pages of the booklet each had a single profile color photograph with “yes” and “no” at the bottom of the page so that the reader could provide a response for each photograph.
The booklet was produced on high-quality matte paper and piloted with senior specialist trainees in orthodontics at the Leeds Dental Institute to ensure validity.
Each booklet was accompanied by a cover letter that was personalized and explained the aims of the study and what the participant was asked to do. It also emphasized that, obviously in a real-life clinical scenario, the decision for surgery would be based on a wide range of records, but for the purposes of this study a distinct yes or no answer was required. A booklet, along with its cover letter and a stamped, addressed return envelope, was sent to all 256 consultants on the list from the British Orthodontic Society. Each booklet was labeled with a number on the inside of the back cover; this allowed the responses to be recorded as they were returned. A month was allowed for response, and subsequently a second (or a third) booklet was sent to nonresponders.
In addition to the 40 patient photographs, a photograph was taken of a Perspex square (a thermoplastic sheet of polymethyl methacrylate) (Ineos Acrylics, Darwen, Lancashire, United Kingdom) with a dimension of 100 × 100 mm. This was taken with the same camera settings and permitted calibration of distances measured on photographs to actual distances.
The photographs were printed on A4 paper, and then each profile photograph had a soft-tissue analysis with a hand-tracing method. This was done (by P.T.B.) by using a self-propelling pencil, a protractor, and a ruler to measure distances to the nearest 0.5 mm. The picture of the square was printed on the same paper and measured in the same way.
The reproducibility of the measurements was retested on 10 photographs by the same operator (P.T.B.) 2 weeks after the first analysis. A Bland-Altman plot was then constructed for each part of the analysis by plotting the mean of the 2 measurements against the difference of the 2 measurements. Upon this, a line representing the mean of the differences in the 2 measurements (bias) was plotted, and then 95% agreement limits were drawn on the plot.
Statistical analysis
Quantitative variables such as number of patients per year and soft-tissue measurements were summarized by using means and standard deviations after checking for normality. Categorical variables such as sex and year of study were summarized with frequencies and proportions.
The data were analyzed by using a statistical package (version MLwiN 2.16; Centre for Multilevel Modeling, University of Bristol, Bristol, United Kingdom).
A multi-variable, multi-level logistic regression model was used to investigate the factors that influenced the assessor’s decision. The response variable was binary (needed surgery, yes or no). The predictors for the model were 8 soft-tissue profile values, and the confounding variables were year of qualification, sex, and number of orthognathic patients treated each year.
A multi-level framework was adopted because the data were clustered according to orthodontist. Responses from the same orthodontist were likely to be correlated, and this violated the independence assumption required by traditional statistical tests. Photograph perceptions were nested in the orthodontist’s responses and were hence not independent. A 2-level multi-variable logistic regression model was fitted in the MLwiN 2.6 statistical software. Estimates were derived by using second-order penalized quasi-likelihood procedures, which are preferable to the alternative first-order marginal quasi-likelihood methods. Iterative generalized least squares estimation was used because the response variable was not normal. Collinearity among the soft-tissue measurements was investigated by using pair-wise correlations between the soft-tissue measurements and the variance inflation factor. Model goodness-of-fit was assessed by using binary logistic regression.
Results
Of the 256 booklets sent, 208 were returned, giving a response rate of 81.3%. Of the 208 returned, 5 were incomplete with at least 1 piece of data missing. All returned booklets were included in the analysis. Of the booklets that were returned, 97% were fully completed.
Of the 208 (63%) consultants, 131 were male and 77 were female (37%). Information about the years that the consultants qualified as orthodontists was grouped and showed that the over 40% of them qualified between 1991 and 2000, with the next highest group between 1981 and 1990 (29.9%). The mean number of orthognathic patients treated per year for the sample group was 25.9, with a range of 1 to 150 (SD, 21.3).
Bland-Altman plots were used to measure agreement between 2 metric continuous variables, and the plots constructed to investigate intraexaminer reproducibility showed a good level of reproducibility for each measurement ( Table I ).
| Measurement | Bias | 95% CI |
|---|---|---|
| Lower anterior face height percentage (M1) | 0.20% | 4.96, −4.6 |
| Facial profile angle (M2) | 0.7° | 3.84, −2.44 |
| Soft-tissue A-point to true vertical (M3) | 0.2 mm | 0.75, −0.29 |
| Soft-tissue B-point to true vertical (M4) | 0.3 mm | 1.48, −0.8 |
| Soft-tissue pogonion to true vertical (M5) | 0.2 mm | 1.05, −0.59 |
| Labrale superior to E-plane (M6) | 0.2 mm | 0.87, −1.17 |
| Labrale inferior to E-plane (M7) | 0 mm | 0.78, −0.78 |
| Nasolabial angle to true vertical (M8) | 2.5° | 9.24, −4.24 |
Table II gives information about the measurements made on the photographs during the analysis, and Table III presents the descriptive statistics of soft-tissue measurements; 80% of the orthodontists would recommend surgery.
| Measurement | n | Minimum | Maximum | Mean | SD |
|---|---|---|---|---|---|
| Lower anterior face height percentage (M1) | 40 | 48.10% | 64.20% | 56.10% | 3.80% |
| Facial profile angle (M2) | 40 | 147.0° | 178.0° | 161.2° | 6.3° |
| A-point to true vertical (M3) | 40 | −3.0 mm | 0.7 mm | −1.1 mm | 0.8 mm |
| B-point to true vertical (M4) | 40 | −14.0 mm | −1.5 mm | −7.2 mm | 2.8 mm |
| Pogonion to true vertical (M5) | 40 | −13.6 mm | 0.7 mm | −6.0 mm | 3.1 mm |
| Labrale superior to E-plane (M6) | 40 | −5.3 mm | 0 mm | −2.1 mm | 1.3 mm |
| Labrale inferior to E-plane (M7) | 40 | −4.5 mm | 2.7 mm | −1.4 mm | 1.6 mm |
| Nasolabial angle to true vertical (M8) | 40 | −17.0° | 18° | 1.3° | 9.1° |
| Eighty percent or more would recommend surgery | M1 (%) | M2 (°) | M3 (mm) | M4 (mm) | M5 (mm) | M6 (mm) | M7 (mm) | M8 (°) |
|---|---|---|---|---|---|---|---|---|
| No | ||||||||
| n | 26 | 26 | 26 | 26 | 26 | 26 | 26 | 26 |
| Mean | 57.177 | 163.5 | −0.9171 | −6.2452 | −5.1389 | −2.1982 | −1.252 | 3 |
| Median | 57.25 | 163.5 | −0.757 | −6.813 | −5.4883 | −1.8925 | −1.1355 | 5 |
| Minimum | 50 | 152 | −2.27 | −11.36 | −11.36 | −5.3 | −4.54 | −15 |
| Maximum | 64.2 | 171 | 0.76 | −1.51 | 0.76 | −0.76 | 1.51 | 18 |
| SD | 3.3552 | 4.2638 | 0.7952 | 2.4159 | 2.79818 | 1.2394 | 1.5131 | 7.3212 |
| SEM | 0.658 | 0.8362 | 0.156 | 0.4738 | 0.54877 | 0.2431 | 0.2968 | 1.4358 |
| Yes | ||||||||
| n | 14 | 14 | 14 | 14 | 14 | 14 | 14 | 14 |
| Mean | 54.143 | 156.93 | −1.3788 | −9.0299 | −7.4619 | −2.1899 | −1.6492 | −2 |
| Median | 53.65 | 156 | −1.514 | −8.5163 | −7.1915 | −2.6495 | −1.7033 | −5 |
| Minimum | 48.1 | 147 | −3.03 | −14 | −13.63 | −4.54 | −4.54 | −17 |
| Maximum | 63.5 | 178 | 0 | −4.92 | −0.76 | 0 | 2.65 | 16 |
| SD | 4.1558 | 7.3533 | 0.8478 | 2.4747 | 3.16825 | 1.4331 | 1.84 | 11.273 |
| SEM | 1.1107 | 1.9653 | 0.2266 | 0.6614 | 0.84675 | 0.383 | 0.4918 | 3.0128 |
The simplest hierarchical model is the variance components model, which has no explanatory variables. It is used to establish the variation in response across all levels: ie, level 1 (photograph) and level 2 (consultant orthodontist). The variance components model showed a significant variation among orthodontists of 0.214 (SD, 0.031).
To explain the variation in the variance component model, the following covariates were added into the model: sex of the consultant, year that the consultant qualified as an orthodontist (grouped into 1960-1979, 1980-1989, and 1990-present), number of orthognathic patients the consultant treated per year, lower anterior face height percentage, facial profile angle, A-point to true vertical, B-point to true vertical, pogonion to true vertical, labrale superior to E-plane, labrale inferior to E-plane, and nasolabial angle. Table IV shows the results of the multi-variable, multi-level logistic regression model. The values are coefficients and 95% confidence intervals (numbers in parentheses), with only significant predictors shown. Nonsignificant predictors were sex and year of qualification.
| Independent predictors | Unadjusted ∗ | Adjusted ∗ |
|---|---|---|
| Patients per year | 0.004 (0.002) | 0.005 (0.002) |
| Lower anterior face height percentage (M1) | −0.122 (0.006) | −0.114 (0.009) |
| Facial profile angle (M2) | −0.107 (0.004) | −0.068 (0.007) |
| A-point to true vertical (M3) | −0.450 (0.029) | −0.216 (0.055) |
| B-point to true vertical (M4) | −0.314 (0.0101) | −0.765 (0.037) |
| Pogonion to true vertical (M5) | −0.215 (0.009) | 0.375 (0.037) |
| Labrale superior to E-plane (M6) | 0.143 (0.018) | 0.009 (0.038) NS |
| Labrale inferior to E-plane (M7) | −0.035 (0.014) | −0.154 (0.030) |
| Nasolabial angle to true vertical (M8) | −0.031 (0.003) | 0.126 (0.008) |
The adjusted regression coefficients in Table IV show the effects of the independent variable on the other predictor variables in the model. Exponentiating the regression coefficients in the output produces the adjusted odds ratios, adjusted for the other predictors in the model.
This model showed that sex and year of qualification did not have significant effects on the assessor’s decision. An increase in the number of patients, a millimeter increase in pognonion to true vertical, and a degree increase in nasolabial angle were associated with an increased likelihood of recommending surgery. A unit increase in lower face height and facial profile angle was associated with a reduction in the likelihood of recommending surgery. Surgery was also less likely as A-point and B-point moved anteriorly and with anterior movement of labrale superior.
Some of these statistical findings, however, go against clinical conventions.
The adjusted analysis resulted in reversal of the regression coefficient for M5 and M8 ( Table II ). We therefore investigated collinearity among the predictor variables. Multi-collinearity among soft-tissue measurements was investigated by using pair-wise correlations and the variance inflation factor. Correlations in Table V show that some soft-tissue measurements are highly correlated. Variance inflation factors also indicated multi-collinearity among the predictor variables. Variance inflation factors for M5, M4, and M8 were 20.5, 15.6, and 7.08, respectively. The other variables, M3 and M7, have variance inflation factor values approximately equal to 3. A variance inflation factor greater than 10 indicates serious collinearity, and a value greater than 2.5 is a cause for concern. Multi-collinearity inflates the variances of parameter estimates and can also result in wrong signs and incorrect magnitudes of regression coefficients.
| M1 | M2 | M3 | M4 | M5 | M6 | M7 | M8 | |
|---|---|---|---|---|---|---|---|---|
| M1 | ||||||||
| Pearson correlation | 1 | 0.332 ∗ | 0.481 † | 0.468 † | 0.417 † | 0.445 † | 0.405 † | 0.664 † |
| Sig (2-tailed) | 0.037 | 0.002 | 0.002 | 0.008 | 0.004 | 0.01 | 0 | |
| n | 40 | 40 | 40 | 40 | 40 | 40 | 40 | 40 |
| M2 | ||||||||
| Pearson correlation | 0.332 ∗ | 1 | 0.447 † | 0.652 † | 0.715 † | −0.281 | −0.224 | 0.401 ∗ |
| Sig (2-tailed) | 0.037 | 0.004 | 0 | 0 | 0.079 | 0.164 | 0.01 | |
| n | 40 | 40 | 40 | 40 | 40 | 40 | 40 | 40 |
| M3 | ||||||||
| Pearson correlation | 0.481 † | 0.447 † | 1 | 0.674 † | 0.647 † | 0.340 ∗ | 0.196 | 0.790 † |
| Sig (2-tailed) | 0.002 | 0.004 | 0 | 0 | 0.032 | 0.226 | 0 | |
| n | 40 | 40 | 40 | 40 | 40 | 40 | 40 | 40 |
| M4 | ||||||||
| Pearson correlation | 0.468 † | 0.652 † | 0.674 † | 1 | 0.947 † | 0.031 | 0.002 | 0.671 † |
| Sig (2-tailed) | 0.002 | 0 | 0 | 0 | 0.852 | 0.992 | 0 | |
| n | 40 | 40 | 40 | 40 | 40 | 40 | 40 | 40 |
| M5 | ||||||||
| Pearson correlation | 0.417 † | 0.715 † | 0.647 † | 0.947 † | 1 | −0.074 | −0.197 | 0.606 † |
| Sig (2-tailed) | 0.008 | 0 | 0 | 0 | 0.652 | 0.224 | 0 | |
| n | 40 | 40 | 40 | 40 | 40 | 40 | 40 | 40 |
| M6 | ||||||||
| Pearson correlation | 0.445 † | −0.281 | 0.340 ∗ | 0.031 | −0.074 | 1 | 0.686 † | 0.564 † |
| Sig (2-tailed) | 0.004 | 0.079 | 0.032 | 0.852 | 0.652 | 0 | 0 | |
| n | 40 | 40 | 40 | 40 | 40 | 40 | 40 | 40 |
| M7 | ||||||||
| Pearson correlation | 0.405 † | −0.224 | 0.196 | 0.002 | −0.197 | 0.686 † | 1 | 0.466 † |
| Sig (2-tailed) | 0.01 | 0.164 | 0.226 | 0.992 | 0.224 | 0 | 0.002 | |
| n | 40 | 40 | 40 | 40 | 40 | 40 | 40 | 40 |
| M8 | ||||||||
| Pearson correlation | 0.664 † | 0.401 ∗ | 0.790 † | 0.671 † | 0.606 † | 0.564 † | 0.466 † | 1 |
| Sig (2-tailed) | 0 | 0.01 | 0 | 0 | 0 | 0 | 0.002 | |
| n | 40 | 40 | 40 | 40 | 40 | 40 | 40 | 40 |
Stay updated, free dental videos. Join our Telegram channel
VIDEdental - Online dental courses


