Introduction
In this study, we used the finite element method to examine the optimum conditions for parallel translation of the anterior teeth under a retraction force.
Methods
Finite element models of the 6 maxillary anterior teeth and the supporting structures (periodontal ligament and alveolar bone) were generated as a standard model based on a dental model (Nissin Dental Products, Kyoto, Japan). After designating the position and length of the power arm as variables, the initial displacement of each tooth was measured with finite element simulation, and the rotation angle of each tooth was calculated.
Results
The relationship between the position and length of the power arm was analyzed, and model equations for this relationship were proposed. As a result, the length of the power arm was either 4.987 or 8.218 mm when it was located either between the lateral incisor and the canine or between the canine and the first premolar, respectively.
Conclusions
The length of the power arm increased as its position was moved from the lateral incisor to the premolar. This was because the length of the power arm must be increased to be in equilibrium mechanically. Overall, it is expected that the efficient positions and lengths of the new dental models can be calculated if these total procedures are established as a methodology and applied to new dental models. Moreover, the parallel translation of the maxillary anterior teeth can be generated more effectively.
Orthodontic treatment maintains the occlusion by rearranging the teeth to a desirable position by application of an external force to the teeth and supporting structures. The demand for adult orthodontic treatment has increased. In addition to more patients seeking treatment to have their malocclusion corrected, there has also been an increase in the number of orthodontic treatments for bimaxillary prognathism in Korea. This suggests that a protruded facial contour is corrected by retracting the anterior teeth with teeth in normal occlusion.
For the best orthodontic treatment, tooth movement can be estimated and controlled without harming the structures surrounding the teeth by application of an optimal external force. Accordingly, in the orthodontic process, it is essential to examine the biometric phenomena both physiologically and histologically. Therefore, biomechanical analysis for the applied orthodontic tools should be carried out before the procedure. This biomechanical study is an important way to predict and explain the complicated reactions in orthodontics.
Previous studies have used the photoelasticity method, the strain gauge method, laser holography, and the finite element method (FEM) to examine the biomechanical characteristics of orthodontic tooth movement. Among them, the FEM can reconstruct the size and shape of a model similar to the actual object. The FEM allows evaluation of the stress distributions and 3-dimensional (3D) displacements in various systems with an irregular geometry and nonhomogeneous physical properties.
Sliding mechanics to eliminate the loop from the archwire are used mainly to produce effective orthodontic tooth movement. Although the anchorage might be destroyed by friction between the bracket and acrhwire, this problem can be solved by using miniscrews as orthodontic anchorage. There have been attempts to increase the length of the power arm for applying a retraction force to the position close to the center of resistance (CR) of the anterior teeth. Therefore, previous studies have examined the possibility of translating the anterior teeth parallel to the desired direction by using a retraction force. Sia et al measured the rotation angle of the central incisor according to the length of the power arm using a 2-point 3D displacement magnetic sensor developed by Yoshida et al. Sia et al concluded that the CR of the maxillary central incisor is located at approximately 77% of the root length from the apex. Burstone and Pryputniewicz reported that the CR is located at 67% of the root length from the apex on a 3D model with parabolic root geometry. Using finite element (FE) models, Tanne et al concluded that the location of the CR shifted toward the root when the root length of the alveolar bone increased. However, previous studies described only the CR of 1 tooth model or used the CR of the maxillary central incisor to represent the CR of all teeth. Few studies have examined the relationship between the position and the length of the power arm because there are few explanations for the tipping phenomenon according to the position of the power arm.
We examined the optimum conditions for parallel translation of the maxillary anterior teeth with normal inclination under a retraction force using the FEM. The FE models of the 6 maxillary anterior teeth and the supporting structures (periodontal ligament [PDL] and alveolar bone) were generated as a standard model, and FE simulations were performed as a horizontal retraction force was applied bilaterally to the power arm. The initial tooth movements and degree of rotation were measured according to the position and length of the power arm, and the relationship between the variables was then analyzed and explained mechanically.
Material and methods
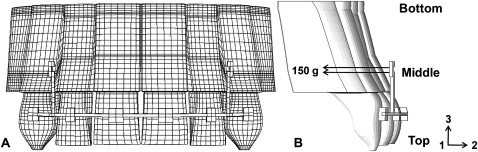
FE models of the 6 maxillary anterior teeth and supporting structures (PDL and alveolar bone) were generated as a standard model based on a normal axis of the anterior teeth arranged in a dental model (Nissin Dental Products, Kyoto, Japan) as shown in Figure 1 . Maxillary first premolars were excluded because they might be extracted. Figure 2 shows the dimensions of the central incisor, lateral incisor, and canine. In general, an FE model of a dental structure is generated by scanned data such as computed tomography (CT). We did not use a CT machine, and we measured the dental model of the Nissin product manually. Like CT, a tooth consists of 5 or 6 fault planes, and each plane was connected by a Ferguson curve. A PDL was extruded with a thickness of 0.25 mm horizontally. This method had many assumptions, and this structure might be a little different from a real dental structure. However, since a person has each dental structure, we did not focus on how to make it similar to a realistic dental structure, but we concentrated on the new methodology of parallel translation of the maxillary anterior teeth based on our reasonable logic and procedures.

The PDL plays the major role in orthodontic tooth movement, and the stiffness of the tooth is relatively greater than that of the PDL and the alveolar bone. Therefore, the tooth was assumed to be a rigid body, and the PDL and the alveolar bone were assumed to be isotropic and have homogeneous linear elasticity. This does not perfectly reflect the complex structure and behavior of the PDL. However, in combined experimental and numeric studies, this assumption was demonstrated to be valid for orthodontic loading and sufficient for describing initial tooth displacement. ABAQUS (standard version 6.5-1, Dassault Systems, Providence, RI) was used to construct a 3D FE model of the maxillary anterior teeth and to carry out the FE analysis. A mesh of the tooth was generated with 3D 4-node rigid elements, and those of the other elastic materials consisted of 3D 8-node linear brick elements.
Considering the biologic changes during orthodontic treatment, significant error could be generated if the PDL and alveolar bone are not included in the FE analysis of the orthodontic phenomena, in which the tooth moves through the PDL and the alveolar bone. According to Coolidge, the mesh of the PDL consists of 3D 8-node linear brick elements with a 0.25-mm thickness and 3 layers. The alveolar bone surrounding the PDL is also constructed of 3D 8-node linear brick elements with 3 layers, and the displacements of the nodes on the bottom surfaces of the alveolar bone are restricted in the x-, y-, and z-axes. In the 6 anterior teeth, the total numbers of nodes and elements were 5880 and 5700, respectively. The PDL had 86,400 nodes and 65,880 elements, and the alveolar bone comprised 18,720 nodes and 20,550 elements. A wire with a rectangular cross-section of 0.022 × 0.025 in was placed by using a bracket with a rectangular cross-section of 0.021 × 0.025 in . Both the wire and the bracket were made from stainless steel. The bracket and archwire were also assumed to exhibit linear elasticity. Table I lists the material properties of each object based on the results reported by Reimann et al and Dorow and Sander. In the standard coordinate system, the origin of the geometric coordinate was the center point of a horizontal line connecting the incisal edges of both central incisors. The +x-axis was set in the centrifugal direction, the +y-axis was set in the labial direction, and the +z-axis was set in the apical direction.
| Material | Young’s modulus (MPa) | Poisson’s ratio |
|---|---|---|
| Tooth (rigid body) | — | — |
| PDL (average value) | 1 | 0.3 |
| Alveolar bone (average value) | 1000 | 0.3 |
| Stainless steel bracket and wire | 200000 | 0.3 |
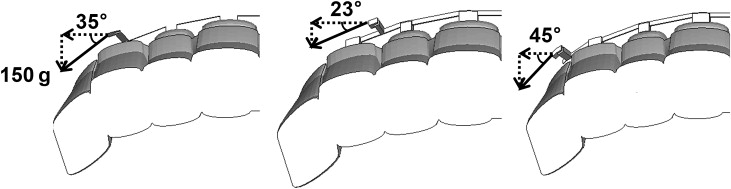
To determine the reliability of the FE simulation, the results were compared with those of Sia et al after analyzing with the same boundary conditions. According to Sia et al, a 150-g horizontal retraction force was applied bilaterally parallel to the archwire after the power arms had been soldered to both sides of the mesial canine region of the archwire. Each power arm contained 6 small hooks with 2 mm between them. In our study, a 150-g horizontal retraction force was also applied bilaterally parallel to the archwire to simulate the en-masse retraction of the anterior teeth. To be equivalent to the direction of the archwire, the retraction force was applied at an angle of 35°, and the components of the force at the x- and y-axes were calculated as shown in Figure 3 . However, the power arm is not normally located at the canine but between the lateral incisor and the canine, or between the canine and the first premolar. Therefore, after examining the reliability of the FE simulation, the 2 above-mentioned cases were analyzed to realistically describe the orthodontic tooth movement. Although the magnitude of the retraction force was the same, its degree was changed to correspond to the direction of the archwire according to the position of the power arm. The retraction force was applied at an angle of 23° or 45° if the power arm was located between the lateral incisor and the canine or between the canine and the first premolar, respectively. Because the length of each power arm ranged from 3 to 11 mm at 2-mm intervals, 5 cases were analyzed according to the position of the power arm.
Mechanical phenomena such as bending, shearing, and sliding were generated by the retraction force to the power arm in the realistic orthodontic tooth movement. They were considered for performing the FE simulation to realize the interaction between the bracket and archwire graphically. Accordingly, the friction contact between the bracket and the archwire followed the friction factor as 0.2, which was assumed in this study. In addition, the bracket was tied with the anterior teeth to increase the convergence of computation, because the bracket generally sticks to the teeth in realistic orthodontic tooth movement, and the interaction between the bracket and teeth has little impact on this work. Since the power arm was connected with the archwire, they were considered 1 object, and it is also possible to describe the bending of the power arm under a retraction force.
To measure the displacement of the tooth under the retraction force, a virtual line connecting the root apex to the incisal edge of each tooth was drawn based on the central part of each tooth. The displacement data of 31 nodes (35 nodes for the canine) passing through this virtual line were obtained. The data for the lingual direction (–y-axis) were only considered to calculate the rotation angle. Since the difference in displacement between the root apex and the incisal edge was the numerator, and the length of the tooth was the denominator, the rotation angle of each case was determined by using an arctangent trigonometrical function.
Results
Before comparing the FE simulation with the experimental results, it was estimated that the power arms used in the experiment of Sia et al were different from those normally used because the power arms were soldered at both sides of the canine. Therefore, in the FE simulation, the power arm and the archwire were assumed to be rigid bodies. As shown in Figure 4 , it was confirmed that a parallel translation had been generated when the length of the power arm was 7 mm. Parallel translation means that the anterior teeth move and maintain the inclination of the axis of each tooth. Therefore, parallel translation occurs because the displacements of each node used to measure the displacement are distributed equally. The central and lateral incisors and the canine moved parallel when the length of the power arm was 7 mm. However, clockwise rotation, crown-lingual tipping, was generated when the lengths of the power arm were less than 6 mm. On the other hand, counterclockwise rotation, crown-labial tipping, occurred when the lengths of the power arm were over 8 mm. These results are similar to the rotation angles according to the length of the power arm reported by Sia et al.
The effects of the length of the power arm for the 2 positions were analyzed because the power arm is located either between the lateral incisor and the canine, or between the canine and the first premolar in realistic orthodontic tooth movement. Figures 5 and 6 show the displacements of each tooth when the power arm was located between the lateral incisor and the canine, and between the canine and the first premolar, respectively. In the former case, parallel translation occurred when the length of the power arm was 5 mm. In the latter case, it was predicted that the anterior teeth would move parallel when the length of the power arm was between 7 and 9 mm. This means that parallel translation of the anterior teeth will occur when the length of the power arm is approximately 8 mm.
Based on these results, Table II lists the rotation angles of each tooth in 10 cases to express the relationship between the rotation angles and the position and length of the power arm as a model equation. The position of the power arm was designated as the x-axis, and a value of 1 indicated that the power arm was located between the lateral incisor and the canine, and a value of 2 indicated that the power arm was positioned between the canine and the first premolar. The y-axis means the length of the power arm with values of 3 to 11 mm at 2-mm intervals. The z-axis indicates the summation of the rotation angles of each tooth according to the position and length of the power arm. As a result, the summation was described in a 3D view ( Fig 7 , A ), and model equations and the length generating the parallel translation were calculated ( Fig 7 , B ). It was estimated that the summation data were also distributed linearly because the FE simulation was performed based on the assumption that the PDL and the alveolar bone exhibit linear elasticity. Accordingly, the summation data of the rotation angles for each position are represented as linear expressions with the length of the power arm. The length of the power arm was 4.987 mm when the x-axis had a value of 1, and the summation of the rotation angles was 0°. When the value was 2, the length of the power arm was 8.218 mm. The displacements of the teeth for each position were reanalyzed by using the optimum lengths obtained from the model equation. As shown in Figure 8 , the summations of the rotation angles of each tooth were 0.00018° and 0.00040° at lengths of 4.987 and 8.218 mm, respectively. It was confirmed that the parallel translation of the maxillary anterior teeth increased when the length of the power arm was 4.987 mm, and it was located between the lateral incisor and the canine. In Figure 8 , each tooth for the x-axis with a value of 1 had a relatively uniform displacement compared with a value of 2. The uniform displacement indicated that the former case can control the displacement of each tooth easily. In the former case, the displacement of each tooth was approximately –2.2 μm, but there were some differences between the displacements of each tooth in the latter case. Therefore, it was concluded that the parallel translation of the maxillary anterior teeth was more stable in the former case because of the uniform displacement of each tooth.


