Highlights
- •
Preparation design and veneer thickness influence the bond of ceramic veneers.
- •
Leucite reinforced ceramic veneers should have a thickness of at least 0.5 mm.
- •
If possible, the dentin should not be exposed during veneer preparation.
- •
OCT permits non-destructive evaluation of the interfacial bond of ceramic veneers.
Abstract
Objectives
In-vitro evaluation of the influence of preparation design and thickness of ceramic veneers on the interfacial bond using optical coherence tomography (OCT).
Methods
Sixty-four central incisors were randomly assigned to four preparation designs differing from no to complete dentine exposure (n = 16 each): non-prep (NP), minimal-invasive (MI, no dentine exposure), semi-invasive (SI, 50% dentine) and invasive (I, 100% dentine). Ceramic veneers (IPS InLine Veneer) of two thicknesses (0.2−0.5 mm (T1) and > 0.5–1.2 mm (T2)) were etched, silanized, and adhesively luted (Optibond FL, Variolink Veneer). After water storage (37 °C, 21d), thermocycling (2000 cycles, 5°-55 °C), and mechanical loading (2 + 1 million cycles, 50 + 100 N) specimens were imaged by spectral-domain OCT (Telesto II, Thorlabs). Adhesive defects at the ceramic-composite and tooth-composite interfaces were quantified on 35 equidistantly distributed OCT B-scans (length, %). Statistical differences were verified with Wilcoxon-/Mann-Whitney- U -test (α = 0.05).
Results
Adhesive defects appeared in all groups at both interfaces, albeit to differing extents (0.1 – 31.7%). NP and MI veneers showed no significant differences at the interfaces (p i > 0.05). In groups, SI and I, significantly more adhesive defects appeared at the tooth-composite compared to the veneer-composite interface (p i ≤ 0.039). The following preparation designs and veneer thicknesses showed differences (p i ≤ 0.021): Veneer-composite: NP-T1 < I-T1, MI-T1 < I-T1, I-T1 > I-T2; Tooth-composite: NP-T1 < SI-T1, NP-T1 < I-T1, NP-T2 > MI-T2, MI-T1 < SI-T1, MI-T1 < I-T1, SI-T1 < I-T1, MI-T2 < SI-T2, MI-T2 < I-T2.
Significance
The interface adhesion of ceramic veneers was influenced by the preparation design and the veneer thickness. A ceramic thickness of at least 0.5 mm and a preparation without exposing dentine is advantageous for the interfacial bond.
1
Introduction
Adhesively luted ceramic laminate veneers have proven to be a highly aesthetic restoration option, especially in the anterior region [ , ]. Nevertheless, there are still some challenges with such ceramic restorations. The adhesive bond has to be stable between the tooth surface and the luting composite on the one hand, and between this composite and the ceramic veneer on the other since a defect of the adhesive bond is one of the main reasons for the failure of such restorations [ ]. Dentine is particularly challenging as a bonding substrate compared to enamel but as well to ceramics due to its high water and collagen content [ ]. The bond strength of ceramic to enamel is still superior compared to the bond strength of ceramic to dentine [ ], and it is therefore recommended to retain as much of the enamel surface as possible to ensure effective and durable micro-retention [ ].
In everyday practice, however, the preservation of tooth enamel is influenced by patient-specific factors such as tooth position or possible damage to the tooth structure. If the thickness of the material is reduced, compromises in aesthetic appearance or tooth shape may have to be accepted. In contrast, a more significant reduction of tooth substance will expose larger areas of the dentine. Even if a cautious preparation is desired in principle, excessive loss of tooth structure and a considerable exposure of the dentine can occur [ ]. Studies evaluating the success of dental veneers according to preparation design and material type recommend retaining as much enamel as possible for the longevity of the veneer restoration [ ].
However, previous studies of the adhesive bond between veneer restorations and tooth structure have often been observations of failure rates, or the restorations have been clinically assessed by visual inspection only refer to scanning electron microscope images showing just the marginal area.
However, previous studies on the adhesive bond of veneer restorations have either been methodologically limited to the determination of failure rates, or the restorations were only been assessed visually [ ] or by scanning electron microscopy with regard to the restoration margins [ ]. In contrast, optical coherence tomography allows the non-destructive imaging of such structures and interfaces [ ]. In dentistry, OCT has become a well-investigated procedure for various areas of application [ , ], including evaluation of adhesive bond between composite material and hard tooth tissues [ , ]. For veneer restorations, however, the possibility to display the internal interface by OCT has not yet been investigated. This study, therefore, takes the opportunity, based on the study by Blunck et al. [ ], who used visual inspection and scanning electron microscopy as an evaluation methodology to introduce optical coherence tomography as a way to assess veneer restorations.
The present study aimed to evaluate the impact of the preparation design and veneer thickness on ceramic/composite and tooth/composite interfacial adaptation using optical coherence tomography. We hypothesize that (I) the more dentine is exposed by the preparation design, the more adhesive defects occur, and (II) that the thickness of the ceramic has an influence on the adhesive bonding at both interfaces.
2
Materials and methods
The present investigation is an in vitro study with eight arms and was conducted following the Declaration of Helsinki and its later amendments. The protocol was approved by the competent ethics committees (s. ethical standards). Essential aspects of the use of materials and methodological procedures have already been published elsewhere by Blunck et al. [ ] so that only methodological aspects relevant to the research question are addressed here.
2.1
Specimen fabrication and sample allocation
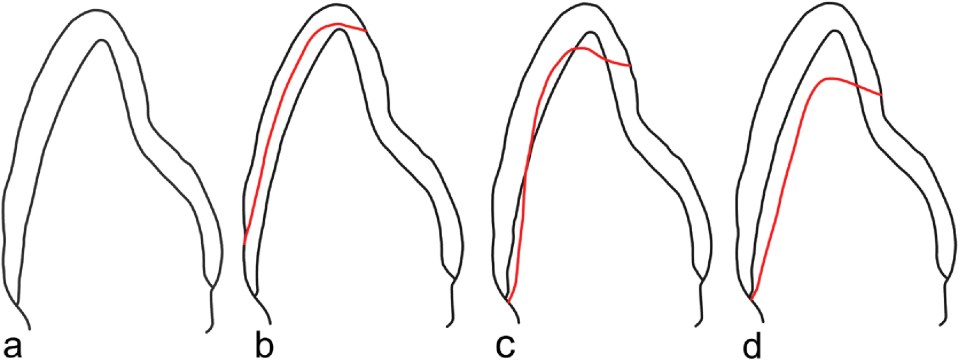
Sixty-four extracted human central incisors visually free of carious lesions or fractures were included. Immediately after extraction and before the examination, the teeth were stored in a 0.5% chloramine solution at 4 °C. The teeth were randomly assigned to eight groups (n = 8, each group): Four main groups of different preparation designs were divided into two subgroups each with different thicknesses of the laminate veneers [0.2 – 0.5 mm (T1) and > 0.5 – 1.2 mm (T2)]: non-prep (NP), minimally invasive (MI, no dentine exposed), semi-invasive (SI, 50% dentine exposed) and invasive (I, labial preparation, 100% dentine exposed) ( Fig. 1 , Table 1 ).
| Center wavelength | 1310 nm |
| Bandwidth | ±120 nm |
| A-scan | 48 kHz |
| B-scan frame rate | 8 – 10 fps |
| Lateral/axial resolution (air) | 20 μm/5.5 μm |
| Sensitivity | ≤ 106 dB |
| Maximum field of view (L x W x D) | 16 × 16 × 3.52 mm |
| Pixel count | 1100 × 500 × 1024 px |
| Power on sample | 3 mW |
All teeth were fixed in a full arch plaster model within a socket made by a paste/paste silicone (Zetaplus, Zhermack GmbH, Marl am Dümmer, Germany) without neighboring teeth. A silicone key was produced to transfer the crown shape of the tooth and thus to be able to check a uniform and standardized reduction of the tooth structure during the preparation. The position of the preparation margins was previously marked with a waterproof pen. Veneer preparations of the teeth were made using a preparation set for veneers (#TD1356A.314, Komet Dental/Gebr. Brasseler GmbH & Co. KG, Lemgo, Germany). All teeth were shortened incisally by 1.5 mm. The incisal plateau was angulated palatally towards the apical. The proximal extension was defined by the contact points, and cervically of these, so-called “elbows” were created as lateral surfaces, which could extend orally slightly beyond the contact point.
The extent of dentine exposure of the various preparation designs was determined visually on dry surfaces. In the minimally invasive group, the extension was restricted to the enamel. In the semi-invasive group, the preparation was 50% in enamel and about 50% in dentine and the cervical margins ended in dentine. In the invasive group, nearly 100% of dentine was exposed. The cervical preparation margin was always within the root dentine. Sharp edges or corners within the preparation line were rounded using flexible discs (Soflex, 1981 M, Medium 10 – 40 μm, 3 M Oral Care, Seefeld, Germany). Care was taken to ensure that the finishing line itself was always visible and sharply defined. The impressions were made using the double mix impression technique with a silicone impression material (Silagum light body, DMG, Hamburg, Germany). For each preparation design, two veneer restorations were made from a leucite-containing veneering ceramic in conventional layering technique (Ceramic IPS InLine, Ivoclar Vivadent AG, Schaan, Liechtenstein) in a commercial dental laboratory by a master dental technician according to the manufacturer’s instructions.
2.2
Adhesive luting of restorations
The intaglio surfaces of the veneers were etched for 120 s using a 5% hydrofluoric acid gel (Porcelain Etch, Ultradent, South Jordan, UT, USA) sprayed with water for 20 s and dried using oil-free compressed air. The veneers were cleaned in an ultrasonic bath with 96% ethanol for 3 min. After air-drying, a silane coupling agent (Monobond Plus, Ivoclar Vivadent AG) was applied and air-dried after 60 s. Preparation areas of the specimens were etched with 35% phosphoric acid (Ultra-etch, Ultradent, South Jordan, UT, USA) according to the manufacturer’s recommendations and immediately afterward conditioned with a three-step etch-and-rinse adhesive (Optibond FL, Kerr, Orange, CA, USA). All veneer restorations were adhesively luted using a dual-cure composite resin (Variolink Veneer, Ivoclar Vivadent AG) and light-cured by a Valo unit (Ultradent, South Jordan, UT, USA) in standard mode with a documented light intensity of 1250 mW/cm 2 at a distance of approximately 5 mm for 40 s from labial, proximal, and incisal aspects. The specimens were polished with silicone tips (Brownie/Greenie, Shofu Dental, Ratingen, Germany) and flexure discs (Sof-Lex, 3 M Espe, Seefeld, Germany) before water storage at 37 °C for 21 days.
2.3
Cyclic fatigue loading
Specimens were thermocycled (2000 cycles between 5 and 55 °C) and mechanically loaded to simulate the intraoral stress situation. For this purpose, the samples were mounted with acrylic resin (Technovit, Kulzer Dental, Hanau, Germany) in a holder that allowed reproducible positioning in the chewing simulator (SD Mechatronic GmbH, Feldkirchen-Westerham, Germany) and to the antagonist. The test specimens were first loaded with 50 N for 2 million cycles and then a further 1 million cycles with 100 N at a frequency of 1.7 Hz and an opening of 5 mm without lateral movement. In between, the teeth were stored in 0.5% chloramine solution.
2.4
Verification of gap detection by OCT
Additional four specimens as validation objects were provided with two veneer preparation designs (2x SI and 2x I) and a ceramic thickness of 0.2 – 0.5 mm with an artificial adhesive defect at the interfaces ceramic/composite and tooth/composite. Half of the preparation area of these specimens was neither etched nor bonded, and the corresponding portions of the ceramic surfaces were not etched and silanized. After thermocycling (500 cycles, 5 / 55 °C, W15, Haake, Karlsruhe, Germany), specimens were imaged using SD-OCT (Telesto II, Thorlabs GmbH, Dachau, Germany). The four samples were then embedded (Stycast, Emerson & Cuming, Westerlo, Belgium) and cut along the reference planes in 6 slices of 200 μm each (Leitz™ 1600 sawing microtome, Ernst Leitz Wetzlar GmbH, Wetzlar, Germany). Before the analysis by scanning electron microscopy (SEM, Phenom G2 pro, Phenom-World BV, Eindhoven, Netherlands), the specimens were prepared according to the laboratory standard. Samples had been conditioned (HCl: 2%, 10 s, 20 °C; NaOCl: 10%, 30 s, 20 °C) with pure water rinsing after every step (60 s, 20 °C). Subsequently, the samples had been dehydrated by ascending alcohol series, stored in hexamethyldisilazane (10 min, 20 °C, HMDS, Carl Roth GmbH, Karlsruhe, Germany) and air-dried. Each slice was mounted on an aluminum specimen stub (12.5 mm Ø, Plano GmbH, Wetzlar, Germany) and gold-coated (2 nm, Sputter Coater MSC1, Ingenieurbüro Peter Liebscher, Wetzlar, Germany). The SEM images were compared with the OCT-B scans regarding the visualization of the adhesive defects at the interfaces.
2.5
OCT imaging of gap formation
After thermocycling and mechanical loading, the specimens were 3-dimensionally imaged by SD-OCT (see above). OCT is based on low-coherence interferometry. SD-OCT is a variant of Fourier domain OCT, using a broadband, low coherence light source. The underlying principle has already been described in detail elsewhere [ , ]. The reflected light from the sample and reference arm interferes with each other, and the resulting signal is recorded. Adjacent structures or phase boundaries with different refractive indices and different light absorption generate detectable signals as grey value differences in 2D B-scans (e.g., interfaces between hard tooth tissues or to the pulp, gaps, bubbles, cracks, or porosities) [ ]. Table 1 summarizes the specifications of the equipment used.
The images obtained by OCT were analyzed based on the platform Image J v1.45 (Wayne Rasband, National Institutes of Health, Bethesda, MD, USA). About 250 B-scans were extracted from the 3D volume dataset, and 35 equally distributed vestibulo-oral oriented B-scan images were assessed.
An OCT-signal indicated an interfacial adhesive defect, which was defined as a signal peak resulting in a bright line extending along with the interfaces between air and ceramic, composite, or air and tooth or composite [ , ]. As previously described [ ], the lengths of the gap-induced OCT signals at the ceramic-composite and tooth-composite interfaces were measured through 35 B-scans per tooth. The length was measured in pixels using ImageJ. The length of the defects on the respective interfaces was put in relation to the total length of this interface and expressed as a percentage of the total length. The assessment was performed by a calibrated examiner, trained by a physicist with several years of practical experience in OCT applications in dentistry.
2.6
Statistical analysis
The statistics program used was Prism (GraphPad Software Inc., La Jolla, CA, USA). Weighted mean values (SD) and medians of the percentage of interfacial gap formation were determined for the subgroups. Since the values of teeth were not generally normally distributed (Kolmogorov-Smirnov test, Shapiro-Wilk test), the group comparisons were carried out non-parametrically using the Friedmann/Wilcoxon test (interfaces VC vs. TC within the subgroups) or the Kruskal-Wallis/Mann-Whitney U -test (interfaces between the subgroups). For all tests, the significance level of α = 0.05 with two-tailed testing was chosen. Due to the exploratory nature of this study, raw p-values are presented, and no correction for multiple testing has been made.
3
Results
Adhesive defects between veneer and composite and between tooth and composite showed up on the OCT-B scans as a line of increased signal intensity. ( Figs. 2 , 3 ). Table 2 shows the gap formation at the veneer-composite (VC) as well as the tooth-composite interface (TC). Differences between the two interface categories only became significant when dentine was exposed by the preparation. In these cases, the gap formation between tooth and composite was significantly increased compared to the contact zone between ceramic and composite. Particularly pronounced differences were observed associated with the invasive preparation for both thinner and thicker veneers (T1: 3.23 vs. 31.66%; T2: 0.59 vs. 15.06%).


