Introduction
Maintaining a patient’s original arch form increases treatment stability. In this study, we assessed the agreement between subjective analyses of arch form and archwire selection by orthodontists and an objective method with Cast Analyzer Iranian X software (Khallaghane Mehr, Tehran, Iran).
Methods
Thirty-six casts with normal occlusion were scanned with a laser. The software generated the best-fit curve using a fourth-degree polynomial equation to the clinical bracket points on the casts; then it selected the best preformed nickel-titanium archwire based on the root mean square calculation either objectively or semiobjectively. Three orthodontists selected the best-fit curve and archwire subjectively using the casts. To assess intraexaminer reliability, the same orthodontists reevaluated 10 casts after 2 weeks. To assess interexaminer reliability, the 3 orthodontists performed the analyses with the software and on the casts. Agreements were evaluated with the intraclass correlation coefficient and Dahlberg’s formula.
Results
The semiobjective method (visual selection of wire by orthodontists using the software) yielded the best results. The differences were clinically negligible between the objective (fully automated) and semiobjective methods (1.30 vs 1.36 mm).
Conclusions
The objective method improved wire adaptation to the clinical bracket points. Agreement among orthodontists regarding wire selection will improve significantly when they are trained to use the software.
Highlights
- •
A semiobjective method was the best for arch curve and wire selection.
- •
The objective method improved wire adaptation to the clinical bracket points.
Andrews introduced the straight wire appliance in 1970 with the main goal of reducing chair time for the fabrication of archwires. It is now the most popular appliance used by orthodontists. The archwire dictates the future arch form, and the teeth move within the created outline. It seems that the range of selection in the current commercially available preformed orthodontic archwires does not appropriately cover diverse dental arch forms.
Arch form classification is a subjective process occurring in the orthodontist’s mind. Arch form has been described by geometric shapes such as catenary, parabolic, elliptical, and hyperbolic and is usually categorized into 3 popular shapes—tapered, oval, and square—for simplicity in the clinical setting. Arch form classification is usually done based on the clinical experience of the orthodontist or using preformed archwires from certain companies.
Recently, there has been a growing tendency toward quantifying the data collected during the clinical examination and the dental cast analysis for both clinical and research purposes. These efforts aim to provide objectivity for diagnostic procedures and achieve more realistic expected outcomes. Since the introduction of new computer-aided diagnostic systems, numerous studies have confirmed the validity and reliability of software programs for clinical decision making and treatment planning. These studies have usually used parameters such as arch depth, arch width, and arch circumference for describing arch forms. However, for a more precise description of arch form, we need to use mathematic models. AlHarbi et al acknowledged that the fourth-degree polynomial function offers the most reasonable model for dental arch description when there is a smooth curvature of the arch. Arai and Will stated that the curve created by the fourth-order polynomial equation results in a smooth flexible curve that can be used as an archwire template for each patient.
Furthermore, different methods of fitting the curve of the preformed archwires to the patient’s original arch form have been proposed in the literature. Among these methods, the root mean square (RMS) is a standard mathematic value by which the similarity of 2 curves is evaluated (the more similar the 2 curves, the lower the value of the RMS). Therefore, with this value, the mean amount of difference between the patient’s tooth and its corresponding point on the archwire can be assessed.
In other words, during the evolution of the straight wire technique, we attempted to achieve the best fit between the brackets and the straight wires inserted into them and the arch to make the fewest changes in the original arch form and ensure the stability of the treatment results. In this study, we evaluated the efficacy of a software program for more precise selection of preformed nickel-titanium archwires and arch form analysis for each patient. In addition, the role of clinicians in arch form analysis and archwire selection is discussed. We selected subjects with normal occlusion to prevent a possible confounding effect of the type of malocclusion on the orthodontists’ clinical decision making.
For this purpose and to decrease the subjectivity in archwire selection, we developed a software program that allows the coordinates of the clinical bracket points (CBPs) to be uploaded by means of an imaging device (2 or 3 dimensional). Then a curve was fitted to the coordinates using a fourth-degree polynomial equation, and the best preformed archwire was selected by the smallest RMS (objective method). The aim of this study was to compare the developed objective method with the conventional method (subjective method routinely used by orthodontists) and the semiobjective method (archwire selection by orthodontists with the software). The role of orthodontists in clinical decision making in each of the 3 methods was also evaluated by calculating the intraobserver and interobserver reliability. In other words, we sought to assess whether the software was intelligent enough to act as do orthodontists in selecting the right archwire for each patient.
Material and methods
This diagnostic study was conducted on 36 maxillary and mandibular dental casts (18 pairs) from subjects with normal occlusion. The sample size was calculated to be 36 considering a 0.6 expected agreement coefficient, a 95% confidence level (α = 0.05), and a 0.16 estimation error. The number of samples was estimated based on the diagnostic aim of the study and for comparison of the methods. Each cast was considered as 1 sample because the wires are selected separately for the maxilla and mandible. The RMS was separately calculated for each sample. Therefore, 36 casts were used for the statistical analyses. The normal occlusion casts were selected from the archives of the Qazvin University of Medical Sciences in Qazvin, Iran, and belonged to adolescents (ages, 12 ± 1 years) with normal occlusion and no history of orthodontic treatment. The subjects had been followed for 4 years, and their final casts were used in this study. The inclusion criteria consisted of acceptable facial proportions in clinical examinations, normal overjet and overbite, coincidence of the dental midline with the facial midline, maximum intercuspation, and Class I first molar and canine relationships. Carious interproximal surfaces, mild rotations, and crowding up to 2 mm were ignored. Normal occlusion casts were selected to minimize the confounding effect of treatment planning in the minds of the orthodontists on wire selection using the software.
This study had 2 main parts: arch form selection and archwire selection. First, the arch form curve was constructed. CBPs were demarcated according to the bracket placement guideline for preadjusted appliances using an orthodontic gauge (3M Unitek, Monrovia, Calif). The CBP is the point where the bracket is attached to the tooth in the clinical setting. We digitized the location of these points and their coordinates using a 3-dimensional (3D) laser scanner (national patent number, 69383; Laser and Plasma Research Institute of Shahid Beheshti University, Tehran, Iran). The diagnostic value of this device has been previously assessed and confirmed.
Pictorial (laser scanned) coordinates were converted to 3D spatial coordinates (x, y, z) using a computer. Spatial coordinates of CBPs were entered as x and y data into the software to draw a curve that proved to have the best compatibility with the arch form for each subject. To adapt a curve to the CBPs, we omitted the z-dimension to construct a smooth curve indicating the subject’s arch form. We used the Cast Analyzer Iranian X software (Khallaghane Mehr, Tehran, Iran), which uses the coordinates of bracket points to draw an arch form based on a fourth-degree polynomial equation (ax 4 + bx 3 + cx 2 + dx + e). This mathematic model has the best fit to a human arch form based on previous studies. Cast Analyzer X software has a national patent (Iran 72897, version 1), and its reliability has been confirmed in previous studies. Three-dimensional laser scanner and Cast Analyzer X software were collaborative projects of the Laser and Plasma Research Institute of Shahid Beheshti University and Shahid Beheshti University of Medical Sciences deputy of research and dentofacial research center in Tehran, Iran. Local patent numbers of the Cast Analyzer X (version 2) and the 3D laser scanner are 84356 and 69383, respectively.
The software enables automatic (objective) or manual (semiobjective) alterations in the angulation and direction of the curves to achieve the best adaptation of the curve to the respective points. The distance from each CBP to the drawn curve was measured, and the RMS value was calculated with the formula given to the software. This means that the distances from 14 CBPs were measured to the corresponding points along the x-axis on the polynomial curve fitted to them and squared. The mean of the squared distances was calculated, and the root of this mean indicated the amount of the RMS (RMS=√∑x2/n)
( RMS = ∑ x 2 / n )
. The smaller the RMS value, the greater the adaptation of the arch to the CBPs. The objective and semiobjective methods in our study involved the use of Cast Analyzer X software.
For objective arch-form selection, the Cast Analyzer X software can automatically fit the best curve to 14 CBPs using a fourth-degree polynomial equation. In this procedure, the orthodontists had no influence on adapting the constructed curve to the CBPs; this task was performed solely by the software.
For semiobjective arch-form selection, the first orthodontist (M.N.), who was one of the software developers, changed the amounts of variables in the fourth-degree polynomial equation to achieve the smallest RMS value for the best-fit curve.
Archwire selection was the second step for selecting the best-fit archwire to the semiobjectively constructed curve for each dental cast. As mentioned earlier, the 3 orthodontists manipulated the polynomial equation variables to achieve the best-fit curve to the CBPs. Archwire selection was performed subjectively (visually), objectively (automatically), and semiobjectively.
For subjective archwire selection, the 3 orthodontists (M.N. and 2 others) fitted commercial nickel-titanium archwires to the dental casts manually to simulate what actually happens in the clinical setting (subjective method).
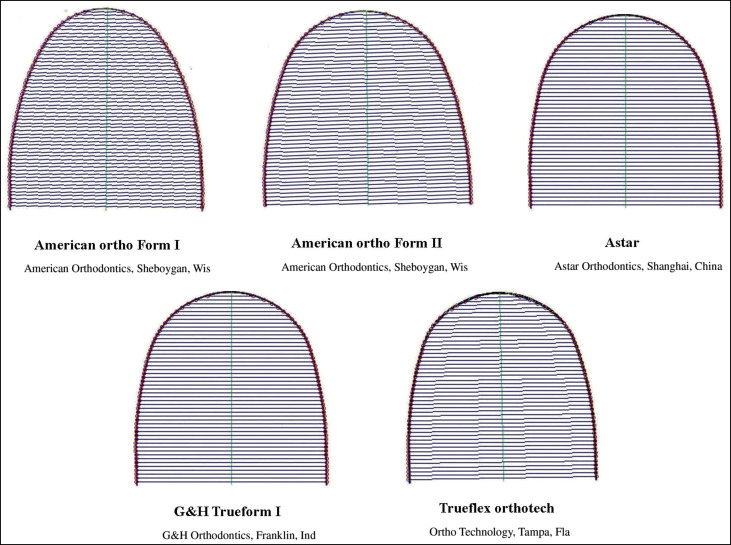
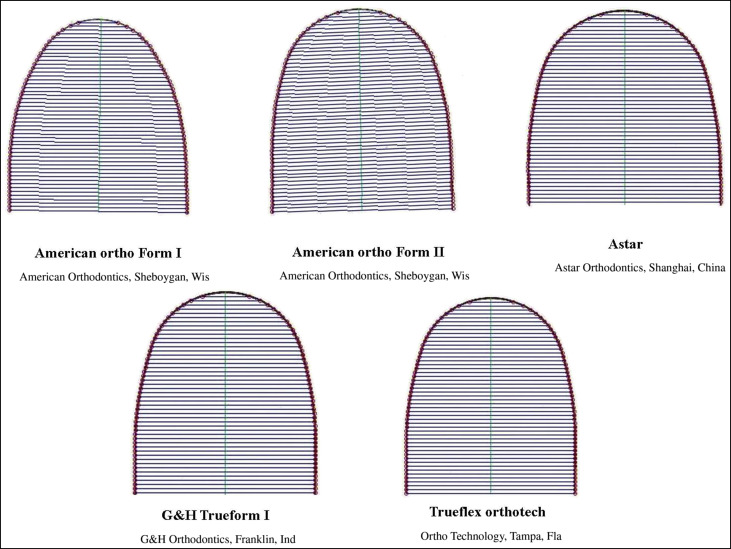
For the objective method, the software chose the best-fit wire for each arch based on the smallest RMS value among the scanned images of 4 pairs of prefabricated nickel-titanium archwires uploaded into the software in JPEG format ( Figs 1 and 2 ). For selection of the best-fit archwire, the distances from 14 corresponding points on the polynomial curve along the x-axis to each archwire curve were the basis for the RMS calculation. The software enables insertion of the first-order deflection of the archwires when engaged in preadjusted brackets using the thickness of the preadjusted brackets (available from the manufacturing company or measured by any device); the thickness of the bracket is compensated for as such. However, this value was not used in our study because it was the same for all 3 methods and therefore would not affect the results. The feature of adding the bracket thickness was designed in the software because of the variability of commercially available bracket types. Oda et al reported that the bracket thicknesses were approximately 1.34 ± 0.16 mm for incisors, 0.75 ± 0.11 mm for canines, and 0.73 ± 0.08 mm for first molars in the mandibular arch. Selection of the best wire by the software was based on the RMS differences; the software prioritized wires as such by adapting 5 points to CBPs at the midline, canines, and molars.
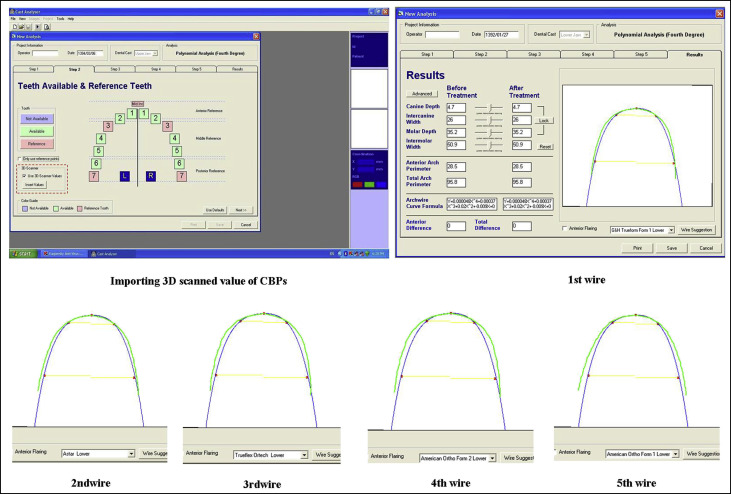
In the semiobjective method, the 3 orthodontists visually selected the best wire for each polynomial curve by comparing the archwire shapes with the polynomial curve based on their clinical expertise without having the RMS values in the software. Figure 3 further clarifies this method. The first and second orthodontists had 15 to 17 years of clinical experience, and the third orthodontist had 5 years of clinical experience. After wire selection by the orthodontists, we needed to have a quantitative variable to assess the differences among the orthodontists and also between the software and each orthodontist. Therefore, selections were entered into the software, the RMS was calculated, and the means and standard deviations of these selections were estimated for each orthodontist. To assess the interobserver reliability, we chose 3 orthodontists based on qualitative studies so that the number of examiners would be odd. We converted the type of wires selected by the orthodontists to their distances from the polynomial curve fitted to them by means of the RMS. By doing so, we changed the variable of wire selection to a mathematic calculation and a parametric variable.
In the final step, the best wire and curve selected by the orthodontists were compared with those selected by the software (as a reliable reference) based on mathematic calculations (ratio scale). The software curve and wire selections were considered as references because they were all measured by devices much more precise than human judgment. That is, the dimensions of the CBPs were identified with a laser scanner. Then a curve was fitted to them using a polynomial equation quantitatively calculated by means of the smallest RMS. The archwire fit to the polynomial curve was also based on the smallest RMS.
To assess intraobserver reliability, the first orthodontist was asked to select the best curve and archwire for the second time for 10 casts after 2 weeks with all 3 methods.
Statistical analysis
For arch-form selection, the polynomial curve fit to the CBPs was assessed using the RMS value for each cast either by the software or after manipulation of the equation by the orthodontists to reach the smallest RMS. The means, standard deviations, and upper and lower boundaries of each RMS were calculated by the software for the 2 methods involving the software.
For archwire selection, as with the arch-form selection, the same statistics were used to describe the fit of the archwires selected by each orthodontist using the RMS values. The means, standard deviations, and upper and lower boundaries of the RMSs were recorded for all orthodontists for the 3 methods. The intraobserver reliability was calculated for the first orthodontist.
The intraclass correlation coefficient (ICC) was used to assess the agreement between the 2 methods, examiners (interobserver reliability), or time points (intraobserver reliability for the first orthodontist), and the values were compared. The differences in each comparison were calculated by Dahlberg’s formula. Although the ICC and Dahlberg’s formula were proper indicators of reliability, we also assessed the significant difference between paired groups with paired t tests. Finally, the RMS values calculated by the 3 methods were compared using repeated measures analysis of variance with a 95% confidence interval. The agreement of wire type suggestions by the software and the orthodontists was assessed using the kappa statistic, ICC, Dahlberg’s formula, and paired t tests.
Results
For arch-form selection, the semiobjective method yielded a better fit by 0.05 ± 0.01 mm (lower RMS value) when arch-form adaptation was manipulated by the first orthodontist via changing the polynomial equation variables. The means, standard deviations, and upper and lower boundaries of the RMS values between the CBPs and the polynomial curve fitted to these points for the 2 methods involving the software are shown in Table I .
| Method | Sample size | Mean | SD | Minimum | Maximum |
|---|---|---|---|---|---|
| Objective | 36 | 0.5056 | 0.16300 | 0.31 | 1.02 |
| Semiobjective | 36 | 0.4544 | 0.15413 | 0.29 | 0.99 |
For archwire selection, the semiobjective method was found to be the best when the RMS values were compared. This means that the best fit was achieved when the orthodontists selected the wire in the software after constructing the polynomial curve. The means, standard deviations, and upper and lower boundaries of the RMS values calculated by the software for the 3 methods by each orthodontist are presented in Table II and Figure 4 . The differences between the 2 methods involving the software were clinically negligible (1.30 compared with 1.36 mm for the first orthodontist). This indicates that the software was as valid as the orthodontist’s judgment for archwire selection, based on the RMS values of subjects with normal occlusion.


