Introduction
Orthodontic tooth movement implies application of forces that generate an inflammatory process. The myeloperoxidase (MPO) enzyme is found inside neutrophil granules. MPO activity indirectly reflects the level of inflammation. The aim of this study was to measure MPO activity in gingival crevicular fluid (GCF) and whole saliva in orthodontic patients with different levels of dental crowding at the alignment phase of orthodontic treatment with the same archwires.
Methods
Twenty patients were classified according to the irregularity index into 2 groups: severe and minimum crowding (10 in each group). MPO activity was evaluated in GCF and saliva at 0 and 2 hours, and 7 and 14 days after the orthodontic appliances were activated. MPO activity was measured using the modified Bradley-Bozeman technique.
Results
In both groups, the maximum activity was at 2 hours ( P <0.05) after activation. MPO activity remained elevated until day 7, and values similar to baseline were found at day 14 in the GCF and saliva samples. Enzymatic activity did not show statistical differences between the groups.
Conclusions
The amount of dental crowding does not seem to influence MPO activity, which showed similar patterns in GCF and saliva, but the values in GCF reflected the inflammatory changes more accurately than did the values in saliva. The quantification of MPO activity is a useful biologic marker as an indirect measurement of inflammation generated with tooth movement independent of the amount of crowding.
Orthodontic tooth movement involves 2 interrelated processes: deflection or bending of the alveolar bone and remodeling of the periodontal tissues. This bone remodeling is used by orthodontists when forces transmitted to the surrounding tissues of the periodontium initiate the remodeling process. The mechanical stimulus causes an inflammatory response in the periodontal tissues, and inflammatory mediators that trigger the biologic processes associated with alveolar bone resorption and apposition are released. It has been proven that orthodontic forces cause acute inflammatory reactions, vascular changes, and migration of leucocytes.
Inflammation is characterized by infiltration of leucocytes, among them neutrophils. These polymorphonuclear cells have granules that contain myeloperoxidase (MPO); this enzyme produces oxidant molecules that can cause lipid peroxidation. The level of MPO activity is proportional to the number of polymorphonuclear cells in a tissue, reflecting the degree of inflammation.
MPO enzymatic activity analysis of saliva or gingival crevicular fluid (GCF) is a useful method for monitoring periodontal inflammation. This is particularly interesting because collection of the sample is not invasive, and the determination method is simple and accessible to standard laboratories.
Dental crowding is a disparity in the relationship between tooth size and jaw size. It occurs when the space required for alignment of the permanent teeth exceeds the space available in the dental arch. This usually results in rotated, ectopic, or impacted teeth.
We expected that MPO activity and then inflammation could differ in patients exposed to orthodontic forces with different levels of dental crowding at the alignment phase of orthodontic treatment. The aim of this study was to examine changes in MPO activity in saliva and GCF in patients with different amounts of dental crowding after their first orthodontic activation with the same archwire size.
Material and methods
Patients attending the orthodontic clinic of the University of Guadalajara in Mexico were invited to participate in the study. All patients gave written informed consent. The study was approved by the Ethics and Biosecurity Board of the Health Sciences University Center of the University of Guadalajara. Twenty orthodontic patients (5 male, 15 female; mean age, 19 ± 1.3 years) were enrolled and classified as having severe (7-9 mm) or minimum (1-3 mm) crowding of the mandibular teeth according to the irregularity index. Each group included 10 patients. All patients met the following criteria: clinically healthy, no anti-inflammatory drugs taken during the month before the study, no antibiotics taken in the previous 6 months, nonsmokers, healthy periodontal tissues with generalized probing depths 3 mm or less, no periodontal bone loss according to their radiographs, and no supragingival plaque on the teeth.
The subjects were told not to eat or drink for 1 hour before the examination. The GCF and saliva samples were collected immediately before the colocation of the orthodontic fixed appliances at baseline, 2 hours, 7 days, and 14 days after the initial orthodontic activation. The initial activation consisted of placement of superior and inferior bands with 0.022-in tubes (3M Unitek, Monrovia, Calif) and bonded fixed orthodontic appliances with a 0.022-in slot (3M Unitek) using a direct technique in all teeth with a light-cured adhesive (Transbond XT, 3M Unitek). To ensure the same activation in both groups, the initial archwire for all patients was a 0.012-in nickel-titanium alloy (Nitinol Classic; 3M Unitek) with an elastomeric ligature in each bracket. The wire was fully engaged in each bracket. GCF samples were taken from the mesiobuccal or distobuccal aspect of the mandibular incisors that received active forces during the initial activation. Samples were always taken from the same site at the 4 time points. After isolating each tooth with a cotton roll, the crevicular site was dried with an air syringe. The GCF samples were collected using an absorbent paper strip (periopaper, Pro-Flow; Interstate Drug Exchange, Amityville, NY) placed into the sulcus until some resistance was felt and left in for 30 seconds. The paper strips were completely filled. The samples were not contaminated with saliva or blood. The filled strips were individually placed in sterile Eppendorf tubes containing 100 μL of buffer (50 mmol/L of Tris-hydrogen chloride, pH 7.4; 200 mmol/L of sodium chloride; 10 mmol/L of calcium chloride; and 0.02% of triton X-100). The samples were kept on ice for half an hour and then centrifuged at 13,000 g for 10 seconds at 4°C. Supernatants were collected and stored at −70°C until further analysis. Saliva was collected from under the right side of the tongue after the patients rinsed their mouths with water.
The amount of saliva that was collected was 5 mL using a 10-mL sterile syringe; it was placed in a 15-mL sterile Falcon tube (Corning Inc, Corning, NY). The samples were immediately centrifuged at 10,000 g for 10 seconds at 4°C, and the supernatants were stored at –70°C until MPO analyses.
MPO activity was measured by Bradley-Bozeman modified technique. Briefly, 100 μL of the sample (GCF, saliva, or MPO standard) was mixed intensively using a vortex with 2 mL of 0.5% of hexadecyltrimethylammonium bromide (Sigma-Aldrich, St Louis, Mo) solution. After that, 0.9 mL of solution containing 1.6 mmol/L of 3,3′,5,5′-tetramethyl benzidine (Sigma-Aldrich), 50 mmol/L of o-Dianisidine dihydrochloride (Sigma-Aldrich), and 0.5 mmol/L hydrogen peroxide were added. An intense vortex was applied for 15 seconds, and the reaction was incubated in darkness for 10 minutes. Subsequently, 100 μL of the reaction solution was placed in a 96-well plate (Costar; Corning Inc), and 50 μL of stop solution (sulphuric acid [H 2 SO 4 ], 2 mol/L) was added. A spectrophotometrical reading was accomplished at a wavelength of 450 nm using a μQuant microplate reader (Bio-TekInstruments, Winooski, Vt). A standard curve with MPO reagent (Sigma-Aldrich) was generated. MPO activity was expressed as units per 100 μL.
Statistical analysis
Data were expressed as means and standard deviations. Statistical significances were calculated with the Friedman test for intergroup and intragroup differences, followed by the Wilcoxon test for related samples and the Kruskal-Wallis test for independent samples in both crowding groups. Differences in the comparisons between the groups were considered significant at P <0.05.
Results
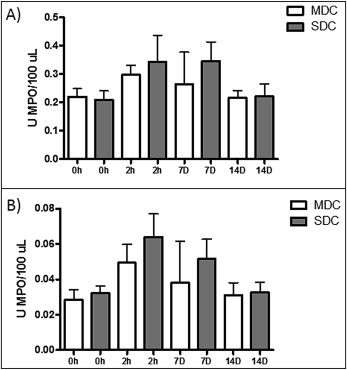
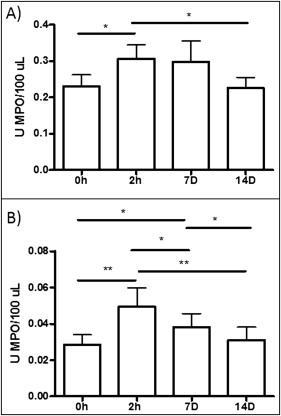
The mean for dental crowding in the minimum crowding group was 1.3 ± 0.6 mm according to irregularity index. As shown in Figure 1 , A , after initial activation, patients with minimum dental crowding showed increased MPO activity in their saliva at 2 hours (0.30 ± 0.11; P <0.05) compared with baseline (0.23 ± 0.09) and 14 days (0.22 ± 0.09), and this increase remained at day 7 (0.29 ± 0.18) but without statistical difference. MPO activity in the GCF showed increased activity at 2 hours (0.04 ± 0.03; P <0.05) and 7 days (0.03 ± 0.02; P <0.05) compared with baseline (0.02 ± 0.01) and 14 days (0.03 ± 0.02), as depicted in the saliva ( Fig 1 , B ).
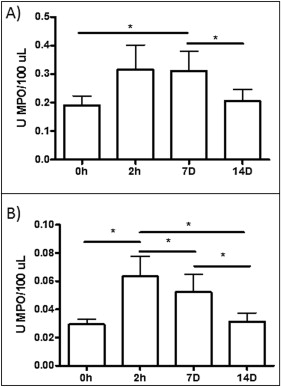
In the group with severe dental crowding, the mean was 8.3 ± 0.8 mm according to the irregularity index. As shown in Figure 2 , A , after initial activation, the patients showed a tendency for increased MPO activity in their saliva at 2 hours (0.31 ± 0.26) and 7 days (0.31 ± 0.20; P <0.05) compared with baseline (0.18 ± 0.10) and 14 days (0.20 ± 0.12). There was no statistical significance for the data at 2 hours. In Figure 2 , B , MPO enzymatic activity in the GCF increased at 2 hours (0.06 ± 0.04; P <0.05) and at day 7 (0.05 ± 0.03; P <0.05) compared with baseline (0.02 ± 0.01) and day 14 (0.03 ± 0.01).
As shown in Figure 3 , A , MPO activity in the saliva showed similar patterns in patients with minimum and severe dental crowding; the levels tended to be increased at 2 hours and 7 days, compared with the data at baseline and 14 days. However, at 2 hours and 7 days, the mean values for the patients with severe dental crowding were higher than those of the patients with minimum crowding, perhaps indicating an effect during the acute phase of inflammation. In the GCF, the maximum MPO activity was detected at 2 hours; this activity was maintained at day 7 and reached levels similar to baseline at day 14 ( Fig 3 , B ). Also, when all patients were grouped without taking into account their dental crowding, MPO activity increased at 2 hours (0.31 ± 0.19; P <0.05) and 7 days (0.31 ± 0.18; P <0.05) after the initial activation in saliva and reached levels similar to the baseline (0.22 ± 0.09) at day 14 (0.21 ± 0.01) ( Fig 4 , A ). This pattern was similar for GCF, but in this biologic fluid the statistical significance was even greater; by day 7, a decrease in MPO activity had started ( Fig 4 , B ). MPO activity increased at 2 hours (0.04 ± 1.01; P <0.01) and 7 days (0.03 ± 0.01; P <0.05) compared with baseline (0.02 ± 0.01) and 14 days (0.02 ± 0.01). Also, the levels of MPO activity were about 10-fold higher in saliva than in GCF, indicating that GCF is probably a more sensitive marker for inflammation caused by tooth movement.