Introduction
In this study, we compared patterns of morphologic variations of the craniofacial skeleton between patients affected by clefts who were operated on and unaffected subjects, aiming to discuss possible morpho-functional consequences of treatment in craniofacial development.
Methods
The lateral cephalograms of 76 subjects, comprising patients with operated unilateral cleft lip and palate (OpC) and a group matched for sex and age without cleft, were used. Thirteen landmarks were used as variables in geometric morphometric tests quantifying and describing overall shape variation, differences between group means, allometry, and upper-lower face covariation.
Results
The OpC group showed broader shape variations including noncleft group characteristics, but mainly a retrognathic maxilla, a vertically elongated face, a more open mandibular angle, and a more closed basicranial angle. Group means differed mainly in the maxillomandibular relationships. Allometry differed between groups, with the smallest OpC patients showing the most altered morphology. Upper and lower face covariation was stronger in the OpC group, showing mainly vertical changes in the anterior face.
Conclusions
Operated patients affected by clefts achieve a broad range of morphologies; the most altered were found in those with skeletal Class III and small size. Furthermore, their strongest upper and lower face shape covariation suggests that a harmonic dental occlusion could be a key factor in achieving “normal” craniofacial morphology.
Highlights
- •
We compared the facial shapes of subjects affected and unaffected by unilateral cleft lip and palate (UCLP).
- •
The operated UCLP patients had a broader range of craniofacial features than did the controls.
- •
The main features in the operated UCLP group were a Class III profile and a smaller centroid size.
- •
Upper and lower face covariation was stronger in the operated UCLP group and related to Class III features.
- •
Postsurgery, normal occlusion would be a key to a harmonic craniofacial development in patients with UCLP.
Clefts of the lip and palate (CLP) are common congenital anomalies. The incidence is highly variable among populations. The highest incidence is found in Asians and Native Americans, with 1 in 500 live births, and the lowest in Africans, with 1 in 2500 births; white, Hispanic, and Latin populations (among these, Chileans) have intermediate incidence of 1 in 1000 live births. Cleft etiology is multifactorial, comprising both genetic and environmental factors acting during intrauterine development.
Unilateral CLP (UCLP) is the most common cleft type. Morphologic alterations of operated patients with UCLP have been widely reported in the literature, of which changes in maxillomandibular relationship are the most prevalent, as described below. Since unoperated subjects have the potential to develop a “normal” (ie, skeletal Class I) maxillomandibular relationship, it has been proposed that altered maxillomandibular relationships are caused by the effect of surgery, particularly lip closure, on the developing bone and sutures. This has led to the proposal of different protocols for the surgical management of CLP that concur in the importance of reconstructing the muscular anatomy of the lip and the soft palate after the third month of age.
Despite the differences in surgical approaches and treatment protocols, the morphologic features in operated patients with UCLP tend to be uniform. In general, they are described as having a retrognathic maxilla. They also show asymmetric faces and altered growth of the transversal and vertical facial dimensions. Alterations of the cranial base have also been reported, although authors do not agree about these descriptions.
Among the methods used to describe and compare skull morphology in individuals affected by orofacial clefts, the use of linear morphometrics and univariate statistics is common. These have some limitations related to the difficulty in assessing separately the changes in shape and size and the impossibility of capturing the geometry of all the areas of interest. The advances in multivariate statistics and computer technology over recent decades have led to the development of geometric morphometrics, a statistical tool widely used for the quantitative study of the shape (ie, form minus size) of organisms. Geometric morphometrics also allows visualizing the changes in morphology associated with the variables of interest. This statistical tool has been applied in studies of operated individuals affected by cleft to characterize their face surface and that of their parents. Geometric morphometrics has also been used to study cranial morphology in affected individuals in the frontal plane and the anteroposterior changes in shape during growth. It has been used in mice to assess developmental integration in the skull of cleft-susceptible mouse strains.
We used geometric morphometrics analyses in this study to compare the craniofacial morphologies of a group of operated patients with UCLP with a control group of unaffected subjects with normal occlusion. We tested the general null hypothesis that patients with operated UCLP and unaffected subjects show the same patterns of craniofacial shape variations. Four parameters were studied: general shape variations, differences in mean shape between groups, allometry, and shape covariation between the upper and lower face.
Material and methods
Ethical approval was granted from the Scientific Ethical Committee of the Faculty of Dentistry, University of Chile (number 2013/34) for the use of image data from the faculty’s clinical records.
The sample comprised the lateral radiographs of 76 persons: 38 (19 men, 19 women) patients with nonsyndromic, operated UCLP (OpC group); and 38 (19 men, 19 women) control subjects with Class I dental occlusion and with an overall harmonious skeletal and soft-tissue profile (NonC group). All the radiographs belonged to patients from the dental clinic of the University of Chile and were taken for medical reasons (diagnosis or treatment evaluation) before the beginning of this study. The radiographs had been taken according to the institutional protocol at the time, with pano/ceph equipment (Siemens Healthcare, Erlangen Germany) operated at 75 to 80 kV and 20 to 25 mA. The position of the head was determined by the cephalostat, fixing the position of the external acoustic meatus and nasion.
All patients were Chileans living in Santiago de Chile or the surrounding areas, representing a dihybrid sample of Amerindian-Spanish admixture with varying levels of the Amerindian component. Those with a greater Amerindian component have been associated with a higher susceptibility to clefts compared with subpopulations of white origins. The mean ages were 13.1 ± 2.67 years in the OpC group and 12.68 ± 2.28 years in the NonC group. Patients in the OpC group had undergone cosmetic surgery of the soft tissues and orthodontic treatment without orthognathic surgery or orthopedic treatment with a maxillary-traction facial mask. The primary cleft closure of the patients in the OpC group was performed at a few clinical institutions by various surgeons in Chile. When these patients were operated on, most surgeons in Chile used an approach based on the Tennison-Randall, Skoog, and Millard techniques, with the primary lip closure performed at 3 months of age, the primary soft-palate closure at 12 months, and the hard-palate closure performed simultaneously at one of these times.
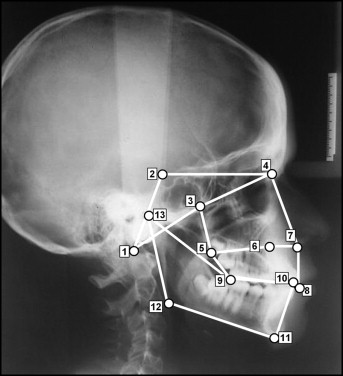
The 2-dimensional geometry of the cranial base, upper face, and mandible was captured using 13 landmarks ( Table I , Fig 1 ). They were selected according to the criteria of Bookstein and Dryden and Mardia for biologic landmark data. To improve the comparability with other studies in the field, most of the selected landmarks were based on those of Delaire et al. The number of landmarks used was considered sufficient to capture key anatomic features and appropriate to increase the statistical power of analyses (see the studies of Bookstein and Monteiro et al for recommendations about the optimal number of landmarks and sample size). The landmarks were marked by 1 observer (A.D.M.) on a transparent acetate sheet placed on each radiograph and revised by a second observer (J.C.A.). Raw data in the format of x and y coordinates representing each landmark were digitized by 1 observer (V.T.-I.) using a mechanical digitizing system (MicroScribe; Immersion, Palo Alto, Calif). Landmark coordinates were exported as text files to be used in subsequent analyses. To assess the effect of measurement error, 16 subjects (4 men and 4 women from each of the 2 groups) were redigitized on 6 different days.
| Landmark | Abbreviation | Description | |
|---|---|---|---|
| 1 | Basion | Ba | Most anterior point of the foramen magnum |
| 2 | Clinoid posterior | ClP | Apex of the posterior clinoid process |
| 3 | Pterygoid superior (UF) | PtS | Most superior point of the pterygopalatine fossa |
| 4 | Enlow (UF) | M | Intersection between the frontonasal and the nasomaxillary sutures |
| 5 | Posterior nasal spine (UF) | PNS | Most posterior point of the bony palate |
| 6 | Nasopalatine (UF) | Np | Most superior point of the anterior wall of the nasopalatine canal |
| 7 | Anterior nasal spine (UF) | ANS | Most anterior point of the anterior nasal spine |
| 8 | Upper incisor | UI | Incisal edge of the central incisors |
| 9 | Occlusal posterior (LF) | OcP | Most posterior point of contact between both dental arches |
| 10 | Lower incisor (LF) | LI | Incisal edge of the central incisors |
| 11 | Menton (LF) | Me | Most inferior point of the menton |
| 12 | Gonion (LF) | Go | Point of maximum curvature at the gonial angle |
| 13 | Condyle posterior (LF) | CoP | Most posterior point of the head of the condyle |
Statistical analysis
The geometric morphometric analyses were performed on shape variables. These were obtained by Procrustes fit, which consists of translation, rotation, and scaling to unit size of the landmark configurations. These new rotated, translated, and scaled configurations lie in a manifold-like shape space from where they are orthogonally projected to a tangent Euclidian space to obtain shape variables (Procrustes coordinates) that are suitable for traditional multivariate statistics. As a result of this stage, a consensus configuration was obtained that is the reference for quantifying the shape changes of the subjects in the sample (see Fig 3 in the study of O’Higgins and Jones ).
An analysis of variance (Procrustes ANOVA) was performed on the redigitized sample to assess the general effect of sex, condition, and measurement error on shape variation In this subsample, there was no significant effect of sex or repeated landmark placing ( Table II ). The nonsignificant effect of sex was corroborated by repeating the analysis in the groups in the entire sample (data not shown). Subsequently, the subjects were not pooled by sex in the rest of the analyses (except for allometry, as explained below).
| Effect | SS | MS | df | F | P value |
|---|---|---|---|---|---|
| Sex | 0.019974 | 0.000908 | 22 | 0.64 | 0.8946 |
| Condition | 0.180671 | 0.008212 | 22 | 5.78 | <0.0001 |
| Individual | 0.406597 | 0.001422 | 286 | 18 | <0.0001 |
| Measurement error | 0.139006 | 0.000079 | 1760 |
General shape variations were studied using principal component analysis. The differences between average landmark configurations of each group were assessed using discriminant analysis and estimating the Mahalanobis distances between group means in the original shape space. The strength of the classification of the subjects in each group based solely on their morphology was estimated through leave-1-out cross-validation.
The effect of size on shape variation or allometry within groups was evaluated by multivariate regression of Procrustes coordinates on centroid size : ie, the square root of the sum of the squared distance of each landmark from the configuration geometric centroid. Since an ANOVA of centroid size yielded a significant effect of sex ( Table III ), the sexes were studied separately in the control and experimental groups. To improve the visualization of the dependence of shape on centroid size, the approach of Drake and Klingenberg was used. According to this approach, shape scores for each group are computed by projecting the shape variables onto a line in the direction of the regression vector. The directions of the allometric vectors representing the pattern of shape changes with the size of each group were compared to assess differences in shape-size relationships.
| Effect | SS | MS | df | F | P value |
|---|---|---|---|---|---|
| Condition | 173.2 | 173.2 | 1 | 2.178 | 0.144 |
| Sex | 2992 | 2992 | 1 | 37.620 | <0.0001 |
| Condition and sex interaction | 3.459 | 3.459 | 1 | 0.0435 | 0.835 |
| Error | 5726 | 79.53 | 72 |
The shape covariation between the upper and lower face within groups was assessed using 2-block partial least square (PLS) analysis. This analysis estimates the extent of covariation between 2 sets of data. To evaluate the strength of the association between the main axes of covariation, the RV coefficient (Escoufier’s multivariate analog of the squared correlation ) was calculated. Since the graphic output of the PLS analysis shows shape changes in separate and independent blocks (1 for each upper and lower face), interpretations of relative sizes and positions between blocks were not possible.
The statistical significance of differences between mean shapes, the allometric effect, and upper and lower face covariation were calculated using permutation tests with a significance level of 0.05. All geometric morphometric analyses were performed with the software MorphoJ version 1.05. The main trend of shape changes was inferred using wire frames connecting landmark points, warped from the mean shape in each case to fit the configuration of the target.
Results
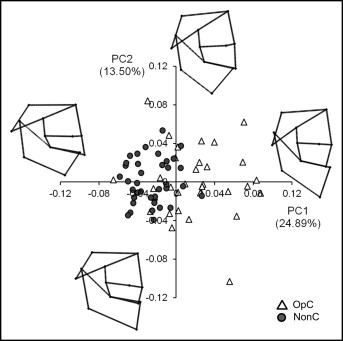
In terms of general shape variation, the principal component analysis results show some overlap between groups ( Fig 2 ). About a third of the patients in the OpC group showed a craniofacial variation similar to that of the NonC subjects. However, because of the much larger variability in the OpC group compared with the NonC group, 2 main clusters of subjects can be distinguished. The main axes of shape variation depict changes in the anteroposterior facial projection in relation to the cranial base, the anteroposterior relationship between the maxilla and the mandible, and the vertical dimensions of the anterior portion (Na, ANS, UI; see Table I for abbreviations) relative to the posterior portion of the upper face (PtS, PNS, and OcP).
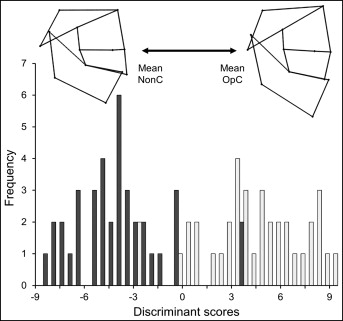
The discriminant analysis resulted in significant differences between the mean shape configurations of each group (Mahalanobis distance, 2.95; P <0.0001). The cross-validation of the linear discriminant classification showed that 7 patients in the OpC and 5 in the NonC groups had a craniofacial shape that could have been found in the opposite group (corresponding to 18.42% and 13.15% of mismatching, respectively). The OpC group mean had a slightly more closed cranial base, an anterior crossbite, a more open mandibular angle, and a more elongated anterior face compared with the control group ( Fig 3 ).
None of the groups showed a significant allometric effect ( Table IV ). The vector directions representing the shape-size relationship pattern did not differ significantly between groups either, but among the male subjects the relationship was close to the threshold value for statistical significance. Despite the P values we obtained, the plots of the regression scores against centroid size depict a different size-shape relationship between the OpC group and the controls ( Fig 4 ), irrespective of sex. The largest subjects in both groups showed a similar maxillomandibular relationship and anterior dental occlusion, but the OpC group had relatively less anteroposteriorly developed cranial base and upper face. The palate segment between Np and PNS was less developed in relation to the ANS-Np portion, and the angle LI-Me-Go was more acute. The smallest subjects, on the other hand, showed different maxillomandibular relationships, with an anterior crossbite in the OpC group. This group also had a less vertically developed posterior portion of the upper face compared with the NonC group ( Fig 4 ).
| Subjects | Regression | Allometric vector comparison | |||
|---|---|---|---|---|---|
| Sex | Condition | R 2 | P value | Vector angle (°) | P value |
| Women | OpC | 0.083 | 0.121 | 94.661 | 0.644 |
| NonC | 0.062 | 0.329 | |||
| Men | OpC | 0.071 | 0.204 | 70.647 | 0.061 |
| NonC | 0.088 | 0.087 | |||
Stay updated, free dental videos. Join our Telegram channel
VIDEdental - Online dental courses


