Introduction
The purpose of this pilot study was to use cone-beam computed tomography (CBCT) to determine the volumes of the maxilla and the mandible in subjects with skeletal Class I, Class II, and Class III malocclusions. Hypothesis 1 was that the volume (size) of a skeletal Class II maxilla is larger than those of Class I and Class III. Hypothesis 2 was that the volume of a skeletal Class III mandible is larger than those of Class I and Class II.
Methods
Thirty women patients were classified into 3 groups according to their skeletal pattern: skeletal Class I (0° ≤ANB <6°), Class II (ANB ≥6°) and Class III (ANB <0°). The volumes of the maxilla and the mandible were measured with CBCT. CB MercuRay (Hitachi Medico, Tokyo, Japan) and CB works software (CyberMed, Seoul, Korea) were used to process the images.
Results
There was a trend that skeletal Class III subjects might have significantly greater mandibular volume compared with Class II subjects ( P = 0.089). The ratios of maxilla-to-mandible volumes between the skeletal Class II and Class III groups were significantly different ( P = 0.005). Differences were observed in the ratios of maxillary and mandibular volumes across the 3 groups.
Conclusions
Hypotheses 1 and 2 were rejected; there was no trend for Class III subjects to have larger mandibles ( P = 0.089) compared with Class II subjects. The ratio of the maxilla and mandible volumes in skeletal Class III subjects was significantly larger ( P = 0.005) compared with Class II subjects.
Conventional head film analysis of skeletal morphology (cephalometrics) has been used since the Broadbent era. In the last 10 years, 3-dimensional (3D) imaging applications have been used in orthodontic studies, including asymmetry of skeletal abnormalities, localization of impacted teeth, growth modality of orthodontic treatment, implant bone thickness, and upper airway. To better understand the 3D morphology of skeletal Class I, Class II, and Class III malocclusions, a study on the volumes of the maxilla and the mandible would be helpful. Two-dimensional analysis can measure only the angular and linear differences and be used to evaluate the components of dental and skeletal abnormalities. A skeletal Class II malocclusion could be a combination of a protrusive or large maxilla and a retrusive or small mandible. In contrast, a skeletal Class III mallocclsuion could be characterized by a retrusive mandible, a protrusive mandible, or a combination. Kau et al reported that 3D CBCT imaging in orthodontics seems to be a paradigm shift from landmarks, lines, distances, and angles to surfaces, areas, and volumes.
The purpose of this study was to use CBCT to determine whether there are any differences in the volumes of the maxilla and the mandible in subjects with skeletal Class I, Class II, and Class III malocclusions. Hypothesis 1 was that the volume (size) of a skeletal Class II maxilla is greater than those of Class I and Class III. Hypothesis 2 was that the volume of a skeletal Class III mandible is greater than those of Class I and Class II.
Material and methods
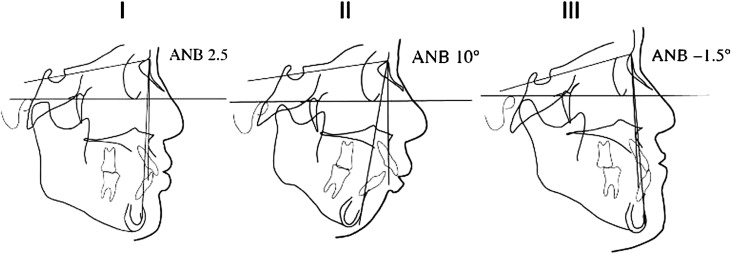
Informed consent was obtained from 30 women patients chosen randomly from a private orthodontic clinic in Kyoto, Japan. They were classified into 3 groups according to skeletal pattern: skeletal Class I (0° ≤ANB <6°; n = 10), Class II (ANB ≥6°; n = 10), and Class III (ANB <0°; n = 10) as shown in Figure 1 . The CBCT images in the pretreatment records were studied. All patients had no history of orthodontic treatment and congenital diseases.
Imaging was performed with the CB MercuRay (Hitachi Medico, Tokyo, Japan). The device was operated at 15 mA and 100 kV with 1 scan time of 10 seconds. Each field of view mode was 12 in. Then the image was processed with CB works software (CyberMed, Seoul, Korea). With a threshold set by an operator, the best images of the maxilla and the mandible were obtained. A 3D image was obtained by rendering the 3D volume. The upper reference line to the volume of the maxilla is the lower side of the palatal plane (anatomic posterior nasal spine-anterior nasal spine line) that does not contain a tooth crown. The volume of the mandible without a tooth crown is the whole bone, including the condyle. The boundaries of alveolar bone and tooth crown were hand-drawn.
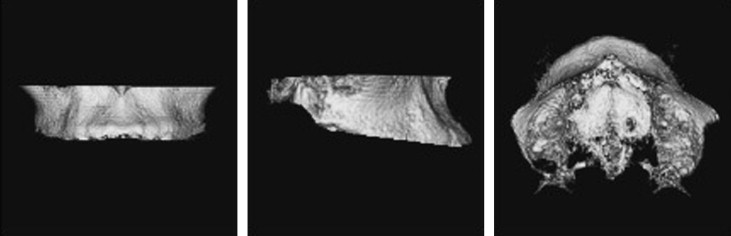
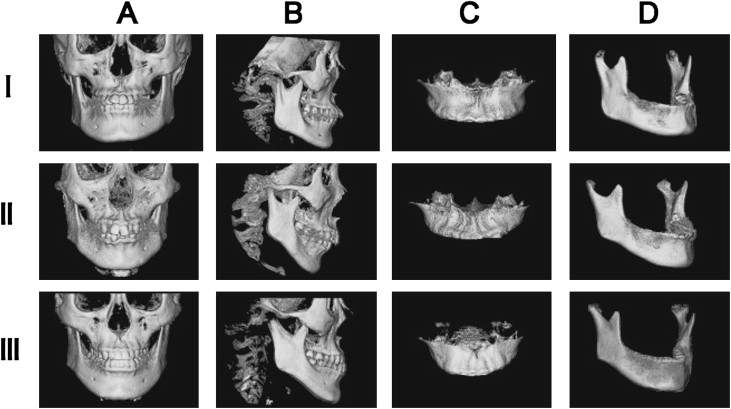
The coronal, sagittal, and axial views for setting the boundaries of the maxilla volume are shown in Figure 2 . There were lateral and frontal 3D skeletal images of the maxilla and the mandible in skeletal Class I, Class II, and Class III malocclusions ( Fig 3 ).
Measurement accuracy was verified. Although CBCT images are not standard, there are reference points when a CBCT image is taken: (1) the patient’s head is fixed with a head holder, (2) the lateral line of light of the floodlight projector is parallel to the Frankfort plane, and (3) the frontal line of light is parallel to the orbital line, and the perpendicular line of light is perpendicular to the midline of the face.
Statistical analysis
All analyses were performed by using SPSS software (version 15.0, SPSS, Chicago, Ill). One-way analysis of variance (ANOVA) was performed to determine whether there were differences in age across the 3 classes if normality and homogeneity of variance assumptions were satisfied; otherwise, the equivalent nonparametric Kruskal-Wallis test was used. Analysis of coveriance (ANCOVA) was performed to take into account the significant differences in age across the 3 skeletal classes when comparing the following measurements: volume of the maxilla, volume of the mandible, and the mandible-maxilla ratio. The Bonferroni adjustment was used for type 1 error on the multiple pair-wise comparisons. Statistical significance was set at P <0.05. Five randomly chosen subjects had their maxillary and mandibular volumes measured twice, and Dahlberg’s formula was used to assess the method of error ( Table I ).
| Class I | Class II | Class III | |
|---|---|---|---|
| Maxilla (mm 3 ) | 120 | 138 | 115 |
| Mandible (mm 3 ) | 423 | 387 | 402 |
Results
The mean age of the Class I subjects was 26 years 8 months (range, 19 years 3 months-40 years 4 months). The mean ages were 30 years 3 months (range, 15 years 9 months-43 years 5 months) of the Class II subjects and 20 years 2 months (range, 15 years 2 months-35 years 4 months) of the Class III subjects ( Table II ). Table II shows the descriptive statistics for age, ANB angle, volumes of the maxilla and the mandible, and mandible-maxilla ratio. The subjects with Class II malocclusion were significantly older than the Class III subjects ( P = 0.024). There were no differences in volume of the maxilla across the 3 classes. Differences were observed in the mandible-maxilla ratio. The subjects in the skeletal Class III group had a significantly larger ( P = 0.005) ratio compared with the Class II subjects. Likewise, the Class I subjects had a higher ratio compared with the Class II subjects, but this was near statistical significance ( P = 0.069). There was also a trend that Class III subjects might have a significantly greater mandibular volume ( P = 0.089) compared with Class II subjects ( Table II and Fig 4 ).
Stay updated, free dental videos. Join our Telegram channel
VIDEdental - Online dental courses


