Background and Purpose
The aim of this study was to test if corticotomy-induced osteoclastogenesis and bone remodeling underlie orthodontic tooth movement and how selective alveolar decortication enhances the rate of tooth movement.
Materials and Methods
A total of 114 Sprague-Dawley rats were included in 3 treatment groups: selective alveolar decortication alone (SADc); tooth movement alone (TM); and “combined” therapy (SADc + TM). Surgery was performed around the buccal and palatal aspects of the left maxillary first molar tooth and included 5 decortication dots on each side. Tooth movement was performed on the first molar using a 25-g Sentalloy spring. Measurements were done at baseline (day 0: no treatment rendered) and on days 3, 7, 14, 21, 28 and 42. Microcomputed tomography, Faxitron analyses, and quantitative real-time polymerase chain reaction (q-PCR) of expressed mRNAs were used to assess changes.
Results
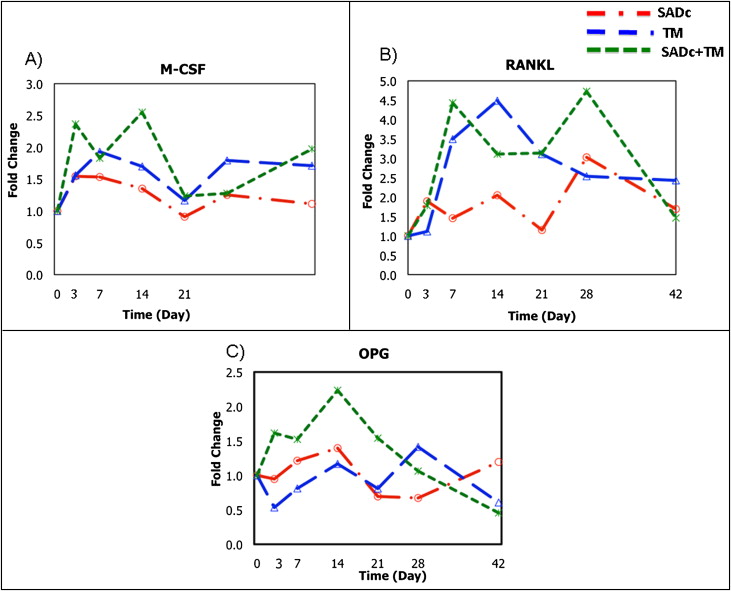
The combined group showed increased tooth movement ( P = 0.04) at 7 days compared with the tooth movement group with significantly decreased bone volume (62%; P = 0.016) and bone mineral content (63%; P = 0.015). RNA markers of osteoclastic cells and key osteoclastic regulators (M-CSF [macrophage colony-stimulating factor], RANKL [receptor activator of nuclear factor kappa-B ligand], OPG [osteoprotegerin], calcitonin receptor [CTR], TRACP-5b [tartrate-resistant acid phosphatase 5b], cathepsin K [Ctsk]) all showed expression indicating increased osteoclastogenesis in the combined group. RNA markers of osteoblastic cells (OPN [osteopontin], BSP [bone sialoprotein], OCN [osteocalcin]) also showed increased anabolic activity in response to the combination of alveolar decortication and tooth movement.
Conclusions
The data suggest that the alveolar decortication enhances the rate of tooth movement during the initial tooth displacement phase; this results in a coupled mechanism of bone resorption and bone formation during the earlier stages of treatment, and this mechanism underlies the rapid orthodontic tooth movement.
Historically, orthodontic tooth movement was described as a site-specific bone remodeling and consists of coupled bone resorption and bone formation. The mechanical basis of orthodontic treatment is the application of force (stimuli) to the teeth using an appliance. This, in turn, leads to biologic reactions, including remodeling changes in the dental and periodontal tissues.
Biologically, tooth movement has 2 fundamental requirements: (1) periodontal ligament (PDL) between the tooth and alveolar bone and (2) bone turnover. In response to orthodontic force, the PDL mediates the mobility of the tooth in the alveolus. The bone is temporarily and spatially regulated, facilitating the movement of teeth. Application of force during orthodontic tooth movement leads to osteoclastogenesis characterized by tissue damage with production of inflammatory mediators in the PDL and alveolar process deformation. A few days after force application, the first osteoclast progenitor cells appear at the compression sites in the alveolar crest vasculature and marrow spaces, and the PDL space widens. Osteoclasts appear in higher quantity at the compression sites compared with tension sites.
While the pathologic aspect of inflammation certainly does not represent the physiologic response to the mechanical forces by the alveolar bone during the orthodontic therapy, pathways inherent to inflammatory processes regulate the bone turnover, soft and hard tissue reactions, and the healing process. Proinflammatory cytokines such as interleukin-6, interleukin-8, and tumor necrosis factor-α are produced at this stage, which supports the notion that the pathways of inflammation initiate the osteoclastogenesis during tooth movement. Osteoclastic activity is characterized by changes in tooth-supporting tissue biomarkers of receptor activator of nuclear factor (RANK), RANKL, and OPG during tooth movement. RANKL expression is increased in response to compressive forces and mediated by prostaglandin E2. RANKL mediates osteoclastogenesis and tooth movement, and its actions are antagonized by OPG. Osteoclastic activity is coupled with osteogenesis, where the type of orthodontic force determines the osteoblast recruitment and tensile strains determine the osteogenic activity. Tensile strains stimulate the proliferation of the osteoblast progenitor cells in the PDL, leading to bone formation and inhibition of bone resorption.
Various methods have been tested to enhance the rate, magnitude, and stability of the tooth movement. While the history of intentional wounding of the alveolar bone to enhance the speed of the tooth movement dates back to the late 19th century, Köle reintroduced the corticotomy procedure to orthodontic therapy. He proposed that by disturbing the continuity of the cortical layer, tooth movement would increase dramatically as a “bony block” with several teeth embedded. This technique was not widely accepted because of its invasive nature, but it was tested in various experimental models with some modifications. More recently, accelerated osteogenic orthodontics has been introduced as a combination of ideas from previous corticotomy-facilitated tooth movement, along with periodontal therapy including alveolar bone augmentation, allowing the selective alveolar decortication in areas of desired tooth movement.
It was proposed that the coupling between demineralization and remineralization during corticotomy-facilitated tooth movement therapy was due to a regional acceleratory phenomenon and not as a net result of bony “block” movement. Following the observation that bone resorption occurs following the periosteal flap surgery ; rapid mineral release was hypothesized to occur during the earlier weeks after the surgery followed by resorption of the bone organic matrix, release of calcium, and occurrence of localized osteoporosis. However, while the clinical protocols have been well defined and successful outcomes have been reported, the biologic mechanism underlying the corticotomy-assisted tooth movement is not understood.
A recent rat model studying the biologic mechanisms underlying the corticotomy process in vivo demonstrated that bone turnover followed the alveolar decortication, suggesting that a periodontium-mediated Regional Acceleratory Phenomenon (RAP) accompanies the decortication. Enhancement of the PDL activity and a dominant role by the spongiosa suggested that tooth movement could be the result of increased turnover rate in alveolar bone.
We have hypothesized that SADc-induced osteoclastogenesis and bone remodeling underlie the orthodontic tooth movement, where alveolar decortication enhances the rate of tooth movement by increasing bone remodeling compared with conventional tooth movement. Thus, the aims are (1) to study the rate of tooth movement after orthodontic treatment with or without SADc, (2) to examine the alveolar bone structure after orthodontic tooth movement with or without SADc using MicroCT, (3) to analyze the osteoclastic and osteoblastic activities in selective alveolar decortication-facilitated tooth movement at the molecular level, and (4) to assess the temporal relationships in the expression of regulatory genes that control bone formation and remodeling.
Material and methods
Study design
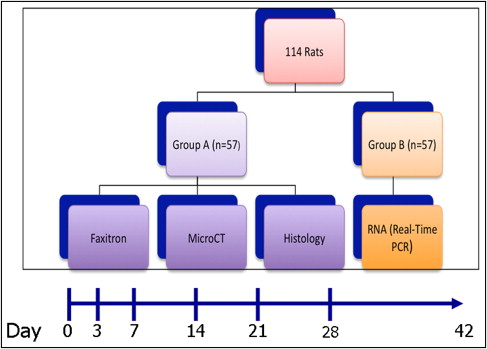
The study included a total of 114 Sprague-Dawley (Crl:CD) rats obtained from Charles River Laboratories, Mass. The study protocol was approved by the Institutional Animal Use and Care Committee. All animals were housed at the Laboratory Animal Science Center where all procedures, including surgery, orthodontic appliance application, orthodontic appliance removal, and euthanasia were performed. A 12-hour light cycle was maintained during the period of observation, and a regular hard diet was supplied. The animals were anesthetized intraperitoneally with a mixture of anesthetic solution (100 mg/kg of ketamine hydrochloride [Ketaset III; Injectable, 100 mg/mL, Fort Dodge Animal Health, Fort Dodge, Iowa], 4 mg/kg of xylazine hydrochloride [AnaSed; Injectable, 20 mg/mL, Lloyd Inc., Shenandoah, Iowa], and 0.9% sodium chloride solution [Hospira Inc., Lake Forest, Ill]). During the surgery, animals were closely monitored and a heating pad was placed under the operation field to avoid body temperature loss. Observations were made at baseline (day 0: no treatment rendered) and days 3, 7, 14, 21, 28, and 42. Table I summarizes the distribution of the animals among different groups and subgroups with the corresponding observation periods; Figure 1 represents the study design and timeline.
| Time (Days) |
Subgroup | Faxitron, Micro-CT | Molecular markers (RNA) |
|---|---|---|---|
| 0 | Baseline controls | 3 | 3 |
| 3 | SADc | 3 | 3 |
| TM | 3 | 3 | |
| SADc + TM | 3 | 3 | |
| 7 | SADc | 3 | 3 |
| TM | 3 | 3 | |
| SADc + TM | 3 | 3 | |
| 14 | SADc | 3 | 3 |
| TM | 3 | 3 | |
| SADc + TM | 3 | 3 | |
| 21 | SADc | 3 | 3 |
| TM | 3 | 3 | |
| SADc + TM | 3 | 3 | |
| 28 | SADc | 3 | 3 |
| TM | 3 | 3 | |
| SADc + TM | 3 | 3 | |
| 42 | SADc | 3 | 3 |
| TM | 3 | 3 | |
| SADc + TM | 3 | 3 | |
| 57 | 57 | ||
| Total | 114 | ||
∗ Table summarizes the study design and animal numbers in each group. Half of the animals were used in microcomputed tomography (MicroCT), and Faxitron analyses and the rest were used for molecular biology studies (RNA isolation and real-time PCR). Timeline included baseline observation, where no procedures were performed, and 3, 7, 14, 21, 28 and 42 days of active tooth movement. Nine animals were used at each time point and 3 treatment groups were defined: selective alveolar bone decortication only (SADc), tooth movement only (TM), and combination of selective alveolar bone decortication with tooth movement (SADc + TM).
Clinical procedures
Selective alveolar decortication was performed first by making a sulcular incision from the mesial aspect of the maxillary left first molar, which extended 5 mm (measured by a periodontal probe) in a mesial direction from the tooth line-angle extending to the edentulous soft tissue space adjacent to the molar. Full-thickness flaps were then elevated on the buccal and palatal aspects. Using a slow-speed hand piece and a small No. 1/4 round bur (Buffalo Dental Manufacturing, Syosset, NY), 5 intramedullary decortication marks—each 0.25-mm wide and 0.25-mm deep corresponding to the size of the bur—were made on both the buccal and palatal sides under water irrigation. Drilling was done where the 0.25-mm bur was fully immersed into bone (for every decortication mark). Flaps were sutured with simple interrupted bioresorbable 6–0 chromic gut sutures (ACE Surgical Supply Inc., Brockton, Mass). Primary closure was achieved for primary tissue healing.
Orthodontic tooth movement was performed on the left side of the maxilla. The original technique was first described by Verna. We modified the model to achieve stability over the course of the study period. Force was applied to the maxillary left first molar using an ultralight (25 g) superelastic NiTi (Sentalloy) closed coil spring with eyelets (GAC International, Bohemia, NY) between the left maxillary first molar and the maxillary incisors. A retentive groove was made using a 1/4 round bur in a slow-speed hand piece. The groove connected the linear mesial angles of the first molar. Another retentive groove was made on the central incisors placed as close to the gingiva as possible on the lateral surface of the central incisor continuing to the buccal surface of the incisors and ending on the lateral surface of the contralateral incisor. A 0.010-in stainless steel ligature wire (GAC international, Bohemia, NY) was inserted under the contact point of the first and second maxillary left molars palatal and pulled from the buccal using a Mathieu forceps. The ligature wire was then wrapped around the first molar under the retentive groove, and the distal eyelet of the coil spring was engaged into the palatal end of the ligature wire. The ligature wire was then tied against the mesial site of the first molar securing the distal end of the coil spring to the mesiopalatal angle of the first molar. Another stainless steel ligature wire was inserted into the mesial eyelet of the coil spring, snapped between the 2 incisors, wrapped around the incisors in a double figure-8 tie running under the retentive groove, and then tied against the buccal surface of the incisors. This was used to secure the closed coil spring against the palatal surface of the incisors.
To ensure the stability of the ligature wire in the anterior area, a 1.5-mm-diameter 4-mm-long titanium miniscrew (Neuro MD screw, KLS Martin LP, Jacksonville, Fla) was inserted through the mesial eyelet of the coil spring palatal to the incisors into the maxillary bone, avoiding the palatal bony suture. Flowable composite bonding material (Henry Schein Inc., Melville, NY) was placed over the ligature wire on the mesial-buccal-distal aspects of the incisor teeth. This was done to prevent appliance loss and protect the animal’s lips from damage by the ligature.
Prior to placement of the bonding material, the incisors were etched using a self-etching primer (Transbond plus, 3M Unitek, Monrovia, Calif). The bonding material was then light cured. This model resulted in delivering a continuous 25-g mesial force to the left maxillary first molar, with an absolute anchorage resulting from the use of the miniscrews. The 25-g continued force was measured by an internal dial caliper gauge at the initial day of the procedure and the force was remeasured using the caliper gauge prior to complete removal of the appliance on the day of sacrifice. Our measurements showed consistent force delivery of 25 g throughout the treatment period.
Faxitron-assisted assessment of tooth movement
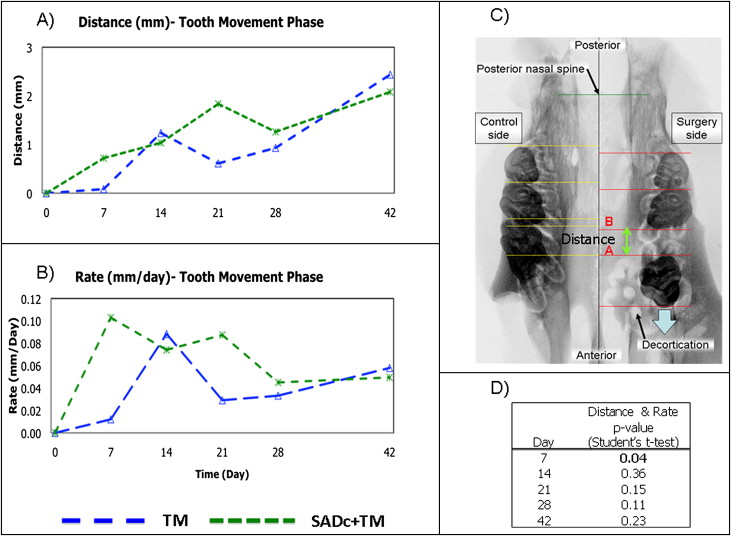
Two-dimensional radiographic Faxitron imaging has been widely used in animal research for studying the specimen without distortion. In this study, terminal Faxitron x-ray images (Faxitron X-Ray Corp. Wheeling, Ill) were taken after the harvest of the maxillae. The images were taken at 3x magnification with 35 kV for 45 seconds’ exposure on XAR-5 Kodak film (Kodak, Rochester, NY). Data obtained from Faxitron images was analyzed using Olympus MicroSuite five software (Olympus, Center Valley, Pa). It consisted of the following linear variables measured from the posterior nasal spine and palatal midline ( Fig 2 ):
- 1.
Anterior-posterior (mesial-distal) length measurements
- 2.
Transverse tooth-width measurements
- 3.
Space created by mesial movement of right first molar (distance)
- 4.
Rate of tooth movement (distance/time, calculated from measurements).
Microcomputed tomography
Microcomputed tomography (MicroCT) was used as a tool to study the structural changes, which occurred in bone in 3 dimensions. Samples were immersed in Accustain formalin solution 10% neutral buffered (Sigma-Aldrich Inc., St. Louis, Mo, USA) during scanning in order to minimize decomposition of the tissue throughout the duration of the scan. Scans were performed using a Scanco μCT 40 system (Scanco Medical, Bassersdorf, Switzerland). Total mineral density was calculated by converting the grayscale output of bone voxels in Hounsfield units (HU) to mineral values (mg/mL of hydroxyapatite) through the use of a calibration phantom containing air, water, and hydroxyapatite (SB3; Gammex RMI, Middleton, Wis, USA). Total mineral density was defined as the average bone voxel HU value divided by the average HA phantom HU value multiplied by 1130 mg/mL (hydroxyapatite physical density). The same calibration phantom was used in each scan to normalize mineral density measurements and to account for possible variability among scan sessions.
Scans were performed at a resolution of 36 μm/voxel. Samples were filtered to remove extraneous voxels using a gaussian smoothing algorithm and individually adjusted using a standard threshold algorithm to segment bone and nonbone voxels. Adjusted MicroCT images were used to measure mineralized tissue surrounding the maxillary first molar. In order to measure the mineral bone only, with exclusion of tooth-mineral structure, a region of interest was isolated using the contouring option. The bone area found in between the 5 roots of the maxillary first molar was defined as region of interest (ROI). Measurements of the bone (total volume) and density (volume fraction and mineral density) were made directly from the MicroCT image data of each specimen. The following measurements were obtained from the MicroCT scanning:
-
TV: The total volume of tissue enclosed by the contours that were measured
-
BV: The volume of the voxels that were above the threshold (8192), that is, the volume of mineralized tissue and therefore considered to be bone.
-
BV/TV: Bone volume fraction: the ratio of bone volume to total volume; this parameter is described as a percentage of the total volume that is bone
-
BMD: The average mineral density of only those voxels above the threshold (ie, voxels that are considered to be bone tissue)
-
BMC: The average mass of bone mineral over those voxels above the threshold and therefore considered to be bone.
RNA isolation from the alveolar bone
mRNA isolation was prepared from each animal around the maxillary molar area harvested. The boundaries of the collected bone area was a box-like configuration that measured 5 mm mesial to the maxillary molar, the exact distal area of the molar, 5 mm palatal bone, and 5 mm buccal bone. In addition, the box enclosed the root apex. The specimens were powdered in liquid nitrogen using a mortar and pestle. mRNA was extracted using QIAzol Lysis Reagent (QIAGEN Inc., Valencia, Calif). RNeasy Lipid Tissue Mini Kit (QIAGEN Inc., Valencia, Calif) was used to purify the RNA as described by the manufacturer. Quantification of mRNA was determined using NanoDrop 1000 (Thermo Fisher Scientific, Wilmington, Del). mRNA sample integrity was verified by visualization of ribosomal RNA with Gelstar Nucleic Acid Stain (Cambrex Bioscience Rockland Inc., Rockland, Me) after denaturing RNA gel electrophoresis. mRNA samples were stored at −80°C until use. RNAse-free water (American Bioanalytical, Natick, Mass) was used for all dilutions during procedures.
Quantitative mRNA expression by q-PCR for detection of osteoclastic and osteoblastic activity in alveolar bone
To study osteoclastic and osteoblastic activities, we analyzed 9 markers at mRNA level by q-PCR. The markers were grouped by function into 3 categories:
- 1.
Osteoclast regulation markers
- •
M-CSF
- •
OPG
- •
RANKL
- •
- 2.
Osteoclast activity markers
- •
TRACP 5b
- •
Cathepsin K (Ctsk)
- •
Calcitonin receptor (CTR)
- •
- 3.
Osteoblast markers
- •
Osteopontin (OPN)
- •
Bone sialoprotein (BSP)
- •
Osteocalcin (OCN)
- •
All reagents for the q-PCR analysis were from Applied Biosystems, and plate assays were read on an ABI 7700 Sequence Detector (Applied Biosystems, Foster City, Calif). One microgram of total RNA was used for each preparation of cDNA. All cDNA preparations were generated by random hexamer priming. External and internal primers for ß-actin, CTR, Ctsk, OCN, OPG, and RANKL were purchased from commercial sets available from Applied Biosystems Inc. Pertinent sequence information and amplicon sizes for each target gene are presented in Table II . In addition, we designed our own primers and probes for the markers, which were not available at Applied Biosystems. These (BSP, M-CSF, OPN, and TRACP 5b) were purchased from either Sigma-Aldrich or Invitrogen ( Table III ). Each plate contained 2 negative controls and a positive control probe. The endogenous control β-actin was used in all experimental samples for normalization and quantification of each target sequence. All samples were run in triplicate. The fractional cycle number at which the fluorescence passed the fixed threshold (CT values) was used for quantification by using a comparative CT method. Sample values were normalized to the threshold value for β-actin (Actb) for each time point: ΔCT = X CT (exp) – X CT (Actb). The CT value for baseline (day 0) was used as a reference in the following formula: ΔΔCT = X CT (exp) −X CT (control day 0). The fold change in mRNA expression for each time point was plotted in a graph using day 0 as a reference: 2−ΔΔCT (baseline at day 0) = 1.
| Gene | Gene Symbol | UniGene ID | Reference Number | Primer Sequence |
|---|---|---|---|---|
| β-Actin | Actb | Rn.94978 | NM_031144.2 | CCTTCCTTCCTGGGTATGGAATCCT |
| Calcitonin R | Calcr | Rn.10062 | NM_053816.2 | CCGGACTTTGACCCAACAGAAAAGG |
| Cathepsin K | Ctsk | Rn.5598 | NM_031560.2 | ATAATTAAAAACAGCTGGGGAGAAA |
| Osteocalcin | Bglap | Rn.9722 | NM_013414.1 | CTGACAAAGCCTTCATGTCCAAGCA |
| Osteoprotegrin | Tnfrsf11b | Rn.202973 | NM_012870.2 | CTGTGCACTCCTGGTGTTCTTGGAC |
| RANKL | Tnfsf11 | Rn.217570 | NM_057149.1 | GCCGACATCCCATCGGGTTCCCATA |
∗ Table represents gene probes purchased from Applied Biosystems and their pertinent information, including primer sequences.
| Gene | Forward Sequence | Reverse Sequence |
|---|---|---|
| BSP | TGACGCTGGAAAGTTGGAGTTAG | GCCTTGCCCTCTGCATCTC |
| M-CSF | CCGACACAGGCTCTTCTATTCAG | CAGCCAGCAAGACTAGGATGA |
| OPN | GGAGCGGTCGGATGCTATC | TCGTGGCTCTGATGTTCCA |
| TRACP 5b | TGCATGACGCCAATGACAA | GAGGGCACGGTCAGAGAAC |
Statistical analysis
The data for both the control and experimental groups were presented as means. Two independent and blinded investigators at different time points evaluated the Faxitron data. MicroCT measurements were repeated 3 times by the same investigator at different time points. The average of the 3 measurements was reported in the final results. q-PCR measurements were all done in triplicate, and all assays were repeated twice. The level of significance was P <0.05 for all data analyzed. One-way analysis of variance (ANOVA) using the effect of time, treatment, and the interaction between time and treatment was used. When applicable, a post hoc least significant difference (LSD) test was used to identify significant differences between the means. As a nonparametric alternative to the 1-way independent samples ANOVA, a Kruskal-Wallis test was performed. We observed no differences between the 2 tests. Therefore, we elected, with a consultation with statisticians, to use 1-way ANOVA for our study. SPSS 16.0.1 (SPSS Inc., Chicago, Ill) software was used for all statistical analysis.
Results
Magnitude and rate of tooth movement
The impact of alveolar decortication on tooth movement was initially assessed via Faxitron analysis. Two variables were measured. First, we examined the amount of tooth movement that occurred in both the tooth movement (TM) and combined (SADc + TM) groups. Second, we calculated the rate of tooth movement in TM and SADc + TM. In terms of the amount of tooth movement, our results illustrated that the SADc + TM group showed a steady increase beginning from baseline up to 21 days. The amount of tooth movement was higher at 7 days in the SADc + TM group compared with the TM group ( Fig 2 , A ; P = 0.04). In contrast, the TM group demonstrated a fluctuation reflecting the typical characteristics of tooth movement phases beginning with an initial displacement (seen as an increase between 7 and 14 days), followed by a lag phase (decrease between 14 days to 28 days), and then a continuous tooth movement (increase between 28 days and 48 days). TM and SADc + TM demonstrated similar tooth movement displacement (amount of movement and rate) between 28 and 42 days. Rate of tooth movement illustrated an early, sharp increase in the SADc + TM group compared with the TM group for the first 7 days. This was significantly higher compared with the TM group ( Fig 2 , B ; P = 0.04). The TM group showed a similar sharp increase 7 days later (at 14 days) compared with the SADc + TM group. Alveolar decortication appears to keep the rate of tooth movement at a high steady level during the initial force application for part of tooth movement. The TM group showed a dramatic decrease in tooth movement rate by 21 days. The effect of alveolar decortication on tooth movement seems to diminish by 28 days; SADc + TM and TM groups had a similar tooth movement rate between day 28 and end of therapy at 42 days ( Fig 2 , D ).
Structural changes in alveolar bone
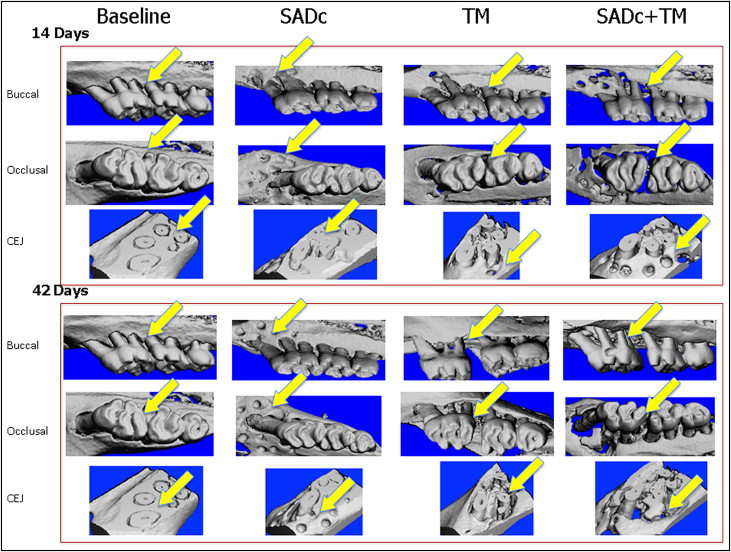
In order to determine how alveolar decortication affects the bone during tooth movement, we next examined the overall bone structure and mineral content by MicroCT. Representative MicroCT images of the first molar and surrounding area are shown in Figure 3 . The bone volume, which is defined as total volume of voxels above a density threshold, was found to be significantly decreased (−62%) in the combined group by 14 days compared with the baseline, ( P = 0.016), but BV was increased to higher levels than baseline by 42 days (+30%). In comparison, the TM group demonstrated a significant decrease (−65 %) by 21 days, 1 week after the SADc + TM group ( P = 0.013), and restored to levels close to baseline (+6%) by 42 days. Selective alveolar decortication by itself resulted in no effect on BV until 21 days (+33% bone formation). Overall, there were no significant differences between the TM and SADc + TM groups at any given time point regarding the BV ( Fig 4 , A ). The SADc group showed no significant changes in BV. In addition, MicroCT analysis showed that SADc + TM resulted in a proportional and significant reduction in the overall ratio of bone volume–to–total volume (BV/TV) 7 days after treatment (−55%; P = 0.010 vs baseline) and at 14 days (−44%; P = 0.039). BV/TV was restored to baseline levels by 28 days in the SADc + TM group (+8%). Tooth movement alone demonstrated a decrease in BV/TV as well, but the change was not statistically significant compared with the baseline. The difference between the SADc + TM (−55%) and TM (−18%) groups showed a strong trend toward statistical significance at 7 days ( P = 0.075). While there was a decrease in the BV/TV in the SADc group, the difference was not statistically significant compared with the baseline. Interestingly, the SADc group showed a significant increase in BV/TV between day 28 (+19%) and day 42 (+22%; P = 0.045) ( Fig 4 , B ).
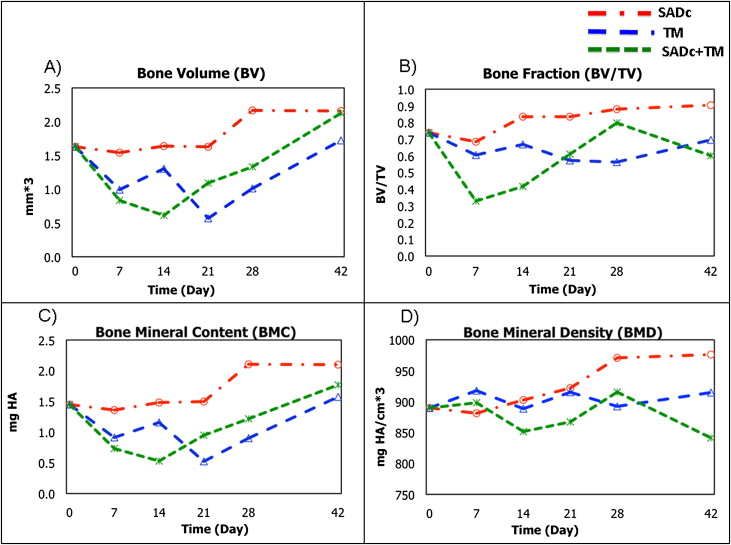
To examine the mineralization associated with alveolar decortication combined with tooth movement, we analyzed bone mineral content (BMC) and bone mineral density (BMD). In terms of bone mass (BMC), the combined group demonstrated a decrease starting at 7 days (−49%; P = 0.056). This decrease was statistically significant by 14 days (−63%; P = 0.015) and restored to levels greater than baseline (day 0) at 42 days (+22%). Tooth movement alone exhibited a significant decrease compared with baseline in BMC at a later stage, 21 days, (−64%; P = 0.015). The BMC was restored to levels close to baseline by the end of the study at 42 days (+9%). SADc by itself did not affect the BMC while an increase was observed at 42 days (+45%) compared with SADc at 7 days (−6%; P = 0.049) ( Fig 4 , C ).
In terms of BMD, there were no statistical significant changes among the 3 procedures at any time point. The BMD fluctuated in response to TM and SADc + TM, but no statistically significant changes were observed. In response to SADc alone, BMD showed a gradual increase, which reached its maximum level at 28 days (+9.1%). This increase was significant when compared with 7 days (−0.96%, P = 0.012), 14 days (+1.45%, P = 0.008), and 21 days (+3.61%, P = 0.005) ( Fig 4 , D ).
Molecular mechanism of osteoclastogenesis
Since selective alveolar decortication results in significant therapeutically induced osteopenia and our MicroCT results further confirmed that this may be the mechanism in rapid tooth movement, we examined the mRNA expression of the major molecules that regulated osteoclastogenesis. M-CSF is essential for osteoclast development and regulation. Its expression increased at 3 days in the SADc + TM group, suggesting the presence of mature osteoclasts at an early stage of SADc + TM compared with TM alone ( P = 0.005 vs baseline). At 14 days, the SADc + TM group showed a further increase in M-CSF expression compared with the baseline ( P = 0.001) ( Fig 5 , A ).